
Timing & trends
Produced by McIver Wealth Management Consulting Group
Mark Jasayko, CFA,MBA, Portfolio Manager with McIver Wealth Management of Richardson GMP in Vancouver.


The U.S. housing recovery that wasn’t?
There has been some noticeable chatter on the newswires this morning about how the U.S. federal government shutdown might affect the so called U.S. housing “recovery.” Much of it points to the fact that mortgage approvals may take longer to process. Apparently staff at the Federal Housing Administration has been reduced by 90% during the shutdown.
Just what kind of housing recovery is this? Is it so flimsy that delays in mortgage approvals might derail it? Granted, U.S. home prices are higher than at any other time since the real estate crash that occurred from 2006-2008. I suppose higher prices are a component of a recovery. But where is the robustness? Remember, the Fed has engaged in $3 trillion of money-printing with one of the major goals being to elevate housing prices. Despite all that, it is surprising to think that economists think that delays in mortgage approvals are a threat.
I remember the last U.S. federal government shutdown. Thinking back, I cannot remember anyone talking about how it might threaten the real estate market directly. U.S. housing was pretty healthy then, recovering from the early 1990’s dip, and it was still a few years before the Barney Frank / Fannie Mae / Freddie Mac Circus that proclaimed “homes for everyone.” As a result, there was a solid foundation in terms of housing prices and not much froth yet. Housing back then was in a real recovery.
The recent rhetoric of the current “recovery” has suggested that it has been solid, that it is a beacon that will lead the U.S. economy out of its anemic growth trap, and that in some areas prices are “booming.” But what is all of that worth if it only takes a delay in mortgage approvals to get people worried?
The opinions expressed in this report are the opinions of the author and readers should not assume they reflect the opinions or recommendations of Richardson GMP Limited or its affiliates. Assumptions, opinions and estimates constitute the author’s judgment as of the date of this material and are subject to change without notice. We do not warrant the completeness or accuracy of this material, and it should not be relied upon as such. Before acting on any recommendation, you should consider whether it is suitable for your particular circumstances and, if necessary, seek professional advice. Past performance is not indicative of future results.
Richardson GMP Limited, Member Canadian Investor Protection Fund.
Richardson is a trade-mark of James Richardson & Sons, Limited. GMP is a registered trade-mark of GMP Securities L.P. Both used under license by Richardson GMP Limited.

My monthly market valuation updates have long had the same conclusion: US stock indexes are significantly overvalued, which suggests cautious expectations on investment returns. In a “normal” market environment — one with normal business cycles, Federal Reserve policy, interest rates and inflation — current valuation levels would be a serious concern.
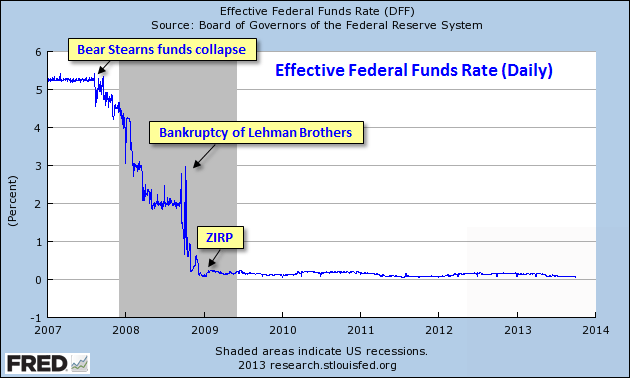
But these are different times. The economic cycle shaped by the Financial Crisis that began emerging in 2007 shortly after the Bear Stearns hedge funds collapsed. The Fed began its historic crusade in cutting the overnight rate from an average of 5.25% prior to the hedge fund collapse to ZIRP (Zero Interest Rate Policy) as of December 16, 2008. The bankruptcy of Lehman Brothers on September 15, 2008 was the most dramatic precipitator of the Fed’s unprecedented policies.
Note from dshort: I’ve update the charts in this commentary to include the latest monthly data.
….3 more charts & commentary HERE
 As one deadline after another passes, the US government is beginning to shut down.
- This is a truly horrific situation, and I’m stunned by the incredible complacency being exhibited by stock market investors.
- For decades, I’ve labelled the September – October time frame as “crash season”.
- In my view, it’s critical that all mainstream investors get out of the market during this period, because it’s when the most devastating market meltdowns tend to occur.
- It can take generations for investors to recover the losses they experience during crash season. The risk of 25% – 90% losses far outweighs the potential reward of 2% – 5% gains.
- Today is the first day of October. The crash of 1929 occurred during this month. Can a similar event happen again? Of course it can, and the current atmosphere of complacency increases the risk of it occurring.
- Please click here now. You are looking at the weekly chart of the Dow Jones Industrial Average. The technical situation is deteriorating dramatically.
- There is a huge RSI non-confirmation in play. The Dow has made new highs while this key oscillator is exhibiting a horrific meltdown.
- There is also a nasty bearish wedge beginning to form, and there’s not much support above the 13,750 area.
- Please click here now. As horrifying as the weekly Dow chart is, this monthly chart looks even worse. Note the volume at the bottom of the chart. Despite tomes of bullish news, volume continues to sag. That’s a huge red flag for stock market investors.
- As somebody who bought key Dow stocks into the lows of 2009 without leverage, I find myself now holding almost the exact opposite view that I held then. The current complacency exhibited by many general equity investors could be viewed as an exhibition of financial madness.
- There is a gargantuan bearish wedge formation on this Dow chart, and a huge RSI sell signal is flashing. I’ve highlighted that sell signal with a red circle at the top of the chart.
- It’s possible that the Dow is able to move higher, despite facing a growing hurricane of bearish seasonal, technical, and fundamental factors involving the US government. Regardless, the risk of being in the market probably vastly outweighs the potential reward. I wouldn’t touch the general stock market now with a ten foot pole.
- There is some very good fundamental news for gold investors. Currently, nine Chinese banks control all gold flowing into and out of China. When gold was sold heavily by Western investors in April, the Chinese banks imposed restrictions on the amount of financing available to Chinese gold dealers. That meant that Chinese buyers couldn’t absorb the gold offered by sellers. Only the banks themselves could buy in size, and they appear to have allowed gold to experience a “free fall” event.
- Yesterday, Reuters News announced that the Chinese central bank would allow more Chinese entities to import gold. In my opinion, this announcement is a fundamentally important event, because it should allow Chinese gold investors to buy more of the gold that is offered for sale during market panics.
- In theory, and hopefully in practise, the gold market should become less volatile, as there will be more dealers that can quickly move supply to buyers. In the short term, there could be a modest decrease in the price of gold, as new dealers import gold to build inventory.
- “The People’s Bank of China said on its website (www.pbc.gov.cn) that the new rules would allow bank members of the Shanghai Gold Exchange, as well as gold producers with an annual output of more than 10 tonnes, to apply for import and export licenses. Trade is currently restricted to just nine banks, while the exchange has 25 bank/financial institution members.” – Reuters News, September 30, 2013.
- Please click here now. You are viewing the daily gold chart. Just as too many cooks in a kitchen can spoil the broth, excessive use of technical indicators and trend lines can prevent an investor from taking professional action in the gold market.
- For many weeks, I’ve suggested that gold investors need to focus on just four main price zones. On the sell-side, there is $1350 and $1425. Horrifically, many amateur investors actually bought gold in the $1425 area, believing that the price was “getting away”.
- On the buy-side, there are the price zones around $1266 and $1200. The wild action on Sunday night pushed gold into the $1350 area, which is a key selling zone for professional investors.
- I think the odds are higher that investors will see $1425 before $1266, but the “jobs report” is due to be released on Friday, and that report can cause immense gold price volatility. Be prepared to buy $1266 in the short term, while cheering for a surge to $1425 and higher!
- Please click here now. The price action of sugar can be a leading indicator for silver. On this daily chart, there’s a bullish inverse head and shoulders bottom pattern in play.
- That’s good news for silver investors, who are currently being forced to deal with “wet noodle” price and oscillator action. On that note, please click here now. Watch the red downtrend line closely. A move over that line could trigger a lot of hedge fund buying.
- Ben Bernanke is scheduled to give a key speech to various banksters on Wednesday at 3pm. I would be stunned if Dr. Bernanke says anything “metals-negative”, given the fact that the entire US government is on the verge of shutting down. Richard Fischer of the Dallas Fed gives another speech on Thursday, and he’s rumoured to own a lot of gold himself. Let’s cheer for bullish speeches this week, and a jobs report that is positive for the metals. Most importantly, please consider docking your stock market boat, because it’s hurricane season!
Special Offer For Website Readers: Please send me an Email to freereports4@gracelandupdates.com and I’ll send you my free “Short GDXJ Versus ZJG.TO” report. I’ll show you how I’m playing both of these key junior gold stocks ETFs, both on the long and short side!
Thanks!
Cheers
St
“Basically, price fluctuations have only one significant meaning for the true investor. They provide him with an opportunity to buy wisely when prices fall sharply and to sell wisely when they advance a great deal. At other times he will do better if he forgets about the stock market and pays attention to his dividend returns and to the operating results of his companies.” -Benjamin Graham
Let us just preface this article by stating it is typically very difficult, if not impossible, to properly time the market. We do think, however, that it is possible to lower risks (raising cash) at times when earnings multiples seem elevated to historical averages. We are currently seeing multiple indicators giving warning signs to the astute investor. Since late 2008, we have been fully invested and have ridden up with most of the bull market with very few errors of commission (except Knight Capital), but mainly errors of omission. We think at this point in the market cycle it is time to become more defensive and raise cash levels and/or rotate into lower duration fixed income investments.
Margin debt at all time high.
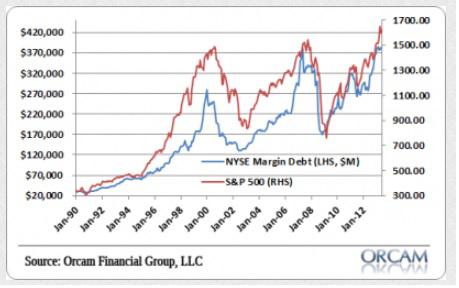
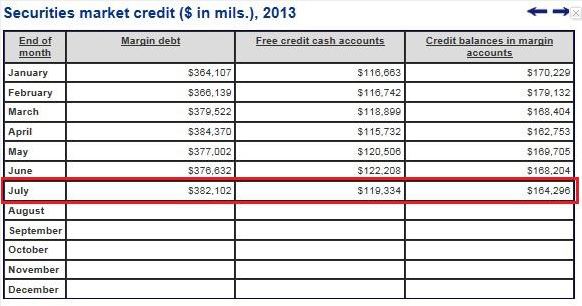
Though the NYSE has not yet published the August margin data, we can surmise that August will inevitably be higher than July, due to the pattern of markets continuing to find new highs at the beginning of the month. At current levels, we are in new territory with respect to leverage; in our opinion, most of this excess leverage is due to the easy money policies from the fed. It will be quite interesting to see how the markets react when rates get into the 3.0%+ range; we think there is a higher likelihood now for a substantial correction in equity prices of 15-20%. While there is definitely money on the sidelines, we think investors are still justifiably skeptical as a result of the financial crisis of 08′ and 09′. Given the metrics above we feel the next selloff is likely to trigger forced margin selling which could propel stocks sharply lower.
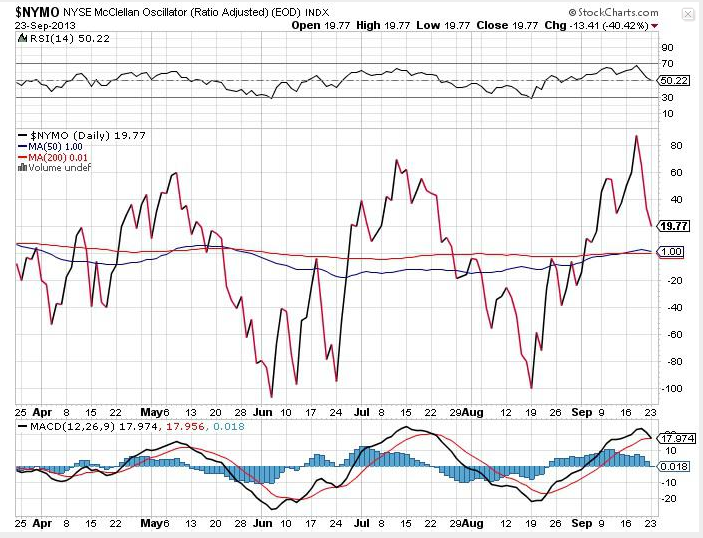
The McClellan oscillator is a market breadth indicator used to evaluate the rate of money entering or leaving the market, and is indicative of overbought and oversold conditions of the market. A recent six month high on the NYSE McClellan Oscillator also may confirm our suspicion that markets have come a little too far, too fast.
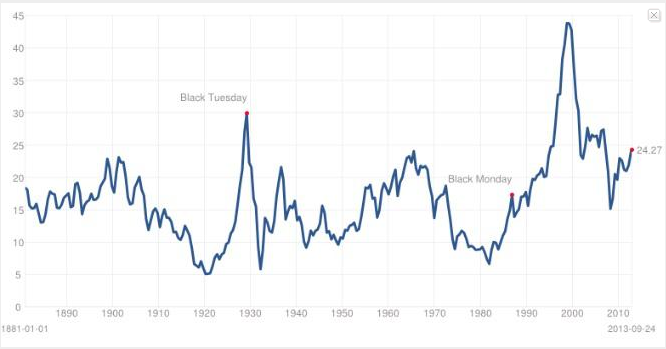
The cyclically adjusted P/E ratio is based on the average inflation-adjusted earnings from the prior 10 years. The Shiller cyclically adjusted P/E ratio shows an alarmingly high multiple of 24.27, which is at the high end of the 130 year plus timeframe.
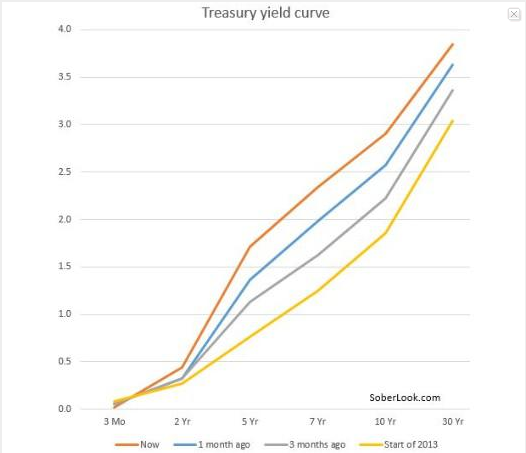
Upward sloping yield curve
While we think the markets are overbought at these levels, the Treasury yield curve is still sharply positive. Therefore, we find it very difficult to be constructively negative long-term with a steep upward sloping yield curve. An inverted yield curve is usually an excellent leading indicator that stocks will enter a bear market within 6-12 months. Yield curve inversions have preceded each of the last seven recessions in the U.S., and we believe that yield curves inversions continue to be one of the most important recessionary indicators.
Though Warren Buffet has put away his elephant gun, we think it is notable that the size of his cash hoard is almost $50 billion. If Buffet is not buying anything in this market, that to us is the equivalent of a sell recommendation. Mr. Buffet hardly ever gives market timing advice, but he has, on numerous occasions, been very close to selling at market tops and buying close to market bottoms. Another notable investor, Seth Klarman, has also been giving investors cash back. Klarman says it is, “to better match our assets under management with the opportunity set we see for new investments”. We think this is yet another sign that Klarman is having a hard time putting his money to work. While these indicators may just be clues, we feel investors at the very least should avoid putting new money to work at today’s market prices.
Our current strategy has been trimming some of our longs like Exco Resources Inc. (XCO) and adding to shorts on large up days like Sandstorm Gold (SAND) and SPDR Gold Trust (GLD). Finally, we also suggest selling short-term out of the money calls on the SPDR S&P 500 (SPY).
Disclaimer: This report is intended for informational purposes only and you, the reader, should not make any financial, investment, or trading decisions based upon the author’s commentary. Although the information set forth above has been obtained or derived from sources believed to be reliable, the author does not make any representation or warranty, express or implied, as to the information’s accuracy or completeness, nor does the author recommend that the above information serve as the basis of any investment decision. Before investing in a security, readers should carefully consider their financial positions and risk tolerances to determine if such a stock selection is appropriate.
At any time, the author of this report may trade in or out of any securities that are mentioned in the report as long or short positions in his own personal portfolio or in client portfolios that he manages without disclosing this information. At the time this report was published, the author had a long position in XCO, and a short position in SAND and GLD; either in his personal account or in accounts that he managed for others.
THIS REPORT IS NOT A RECOMMENDATION TO BUY OR SELL ANY SECURITIES MENTIONED. THE AUTHOR ACCEPTS NO LIABILITY FOR HOW READERS MAY CHOOSE TO UTILIZE THE INFORMATION PRESENTED ABOVE.
Additional disclosure: We are short SAND and GLD, and will potentially enter into a transaction in the SPY within the next 72 hours.

-
I know Mike is a very solid investor and respect his opinions very much. So if he says pay attention to this or that - I will.
~ Dale G.
-
I've started managing my own investments so view Michael's site as a one-stop shop from which to get information and perspectives.
~ Dave E.
-
Michael offers easy reading, honest, common sense information that anyone can use in a practical manner.
~ der_al.
-
A sane voice in a scrambled investment world.
~ Ed R.
Inside Edge Pro Contributors

Greg Weldon

Josef Schachter

Tyler Bollhorn

Ryan Irvine

Paul Beattie

Martin Straith

Patrick Ceresna

Mark Leibovit

James Thorne

Victor Adair