
Timing & trends
Last week the price of silver climbed to $23.45 after U.S. Federal Reserve Chairman said its huge stimulus program would stay in place. In our previous 2 essays we focused on two important links: the one between gold and oil, and the one between gold and the USD Index. In the latter we wrote the following about gold:
As you see on the above chart, gold verified the breakdown below the long-term resistance line created by the July 2005 and the October 2008 bottoms (taking intraday bottoms into account). At this point, it’s worth noting that there was an invalidation of the breakout above the 38.2% Fibonacci retracement level based on the September 2012 – June 2013 decline earlier this month. This was a bearish sign.
From this point of view, it seems that even if gold increases once again in the coming days and reaches the above-mentioned levels once again, the medium-term outlook will continue to be bearish.
Please note that in 2008, when gold moved higher before plunging for the final time, there were several intra-week attempts to move higher after which gold finally declined. Therefore, a double top pattern should not surprise us here. The same goes for a triple top
Gold has declined since the above was posted, so the medium-term downtrend definitely remains in place. In today’s free commentary we will focus on other parts of the precious metals sector: silver and palladium. After all, it is usually the case that the most important price moves are seen simultanously in all precious metals, so by comparing different metals‘ performance we could spot some confirmations or invalidations of the above.
Let’s take a look at the charts and find out what the current outlook for silver and palladium is. Today we will start with the analysis of silver from the long-term perspective (charts courtesy by http://stockcharts.com).
Click HERE or image to enlarge

When we take a look at the above chart, we see that silver pulled back last week, but in spite of this upward move, it still remains visibly below the 32.8% Fibonacci retracement level based on the entire September 2012 – June 2013 decline.
Taking this into account, the medium-term downtrend was not invalidated. In fact, from the long-term perspective, the pullback was barely visible – the most recent move that we can see on the above chart is this month’s decline.
To see more details, let’s move to the short-term chart now.
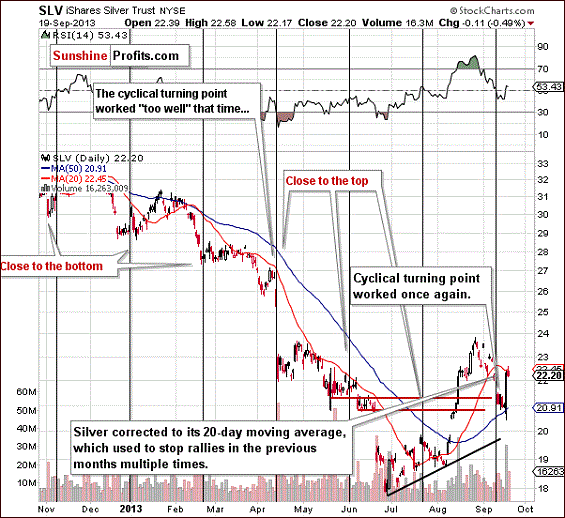
On the above chart, we see that silver pulled back after the cyclical turning point and reached the 20-day moving average last Wednesday. As you see on the daily chart, this moving average was seen to stop rallies multiple times in previous months.
In the recent days, history repeated itself and we saw a downward move. With this correction silver erased almost all last week’s gains and dropped below $21, which is not a positive sign for silver bulls.
In spite of last Wednesday‘s rally, the situation hasn’t changed much. From today’s point of view we see that silver moved up right after the cyclical turning point (after comments from the Fed, which were an important indicator, but perhaps the proximity of the turning point was what made this upswing so significant) and it seems that what was likely to happen based on it has already happened. Consequently, it seems that the medium-term trend in silver is still down.
Once we know the current situation in silver, let’s find out what has recently happened with palladium and where it is right now.
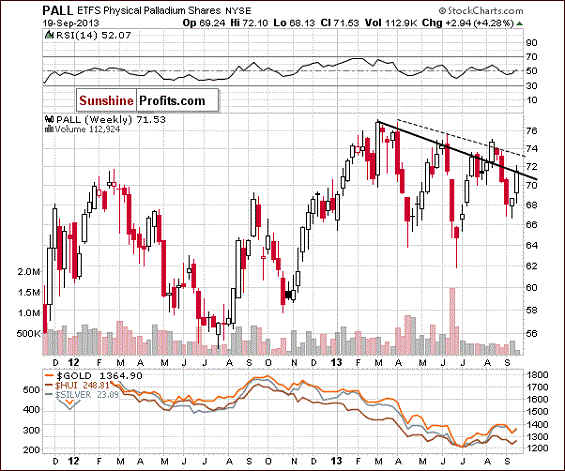
On the above chart, we see that palladium declined slightly below the 68 level; however, the metal has pulled back and we’ve seen a rally over the past several weeks, which took it to the previously-broken declining resistance line based on the 2013 top and the May peak (in terms of weekly closing prices).
There was no upward move above this line in the previous week; therefore the breakdown that we saw at the end of August was not invalidated. Additionally, the price of palladium decreased on Friday and closed the week well below the declining resistance line. On Monday, we saw further deterioration and the price dropped below the 70 level. In spite of yesterday’s small pullback, the breakdown was still not invalidated.
Summing up, the recent upward move in both metals was not as bullish as it seemed at first sight and the breakdown in palladium was not invalidated. The implications are still bearish and the bearish case for gold that we made in our previous essay seems to be confirmed by what we see in the silver and palladium markets. At the same time please keep in mind that the analogy to the 2008 decline is still in place and a small move higher should not surprise us (such as the one that we are seeing today). Please note that we mean only the medium term as far as the bearish outlook is concerned – we are still bullish on the entire precious metals sector over the very long term due to the positive fundamental situation. To make sure that you are notified once the new features are implemented, and get immediate access to our free thoughts on the market, including information not available publicly, we urge you to sign up for our free gold newsletter. Sign up today and you’ll also get free, 7-day access to the Premium Sections on our website, including valuable tools and charts dedicated to serious Precious Metals Investors and Traders along with our 14 best gold investment practices. It’s free and you may unsubscribe at any time.
Thank you for reading. Have a great and profitable week!
Przemyslaw Radomski, CFA
Founder, Editor-in-chief
Gold Price Prediction Website – SunshineProfits.com
* * * * *
About Sunshine Profits
Sunshine Profits enables anyone to forecast market changes with a level of accuracy that was once only available to closed-door institutions. It provides free trial access to its best investment tools (including lists of best gold stocks and silver stocks), proprietary gold & silver indicators, buy & sell signals, weekly newsletter, and more. Seeing is believing.
Disclaimer
All essays, research and information found above represent analyses and opinions of Przemyslaw Radomski, CFA and Sunshine Profits’ associates only. As such, it may prove wrong and be a subject to change without notice. Opinions and analyses were based on data available to authors of respective essays at the time of writing. Although the information provided above is based on careful research and sources that are believed to be accurate, Przemyslaw Radomski, CFA and his associates do not guarantee the accuracy or thoroughness of the data or information reported. The opinions published above are neither an offer nor a recommendation to purchase or sell any securities. Mr. Radomski is not a Registered Securities Advisor. By reading Przemyslaw Radomski’s, CFA reports you fully agree that he will not be held responsible or liable for any decisions you make regarding any information provided in these reports. Investing, trading and speculation in any financial markets may involve high risk of loss. Przemyslaw Radomski, CFA, Sunshine Profits’ employees and affiliates as well as members of their families may have a short or long position in any securities, including those mentioned in any of the reports or essays, and may make additional purchases and/or sales of those securities without notice.


TAPER-gate: The biggest news of the last week, and possibly the biggest economic news of the year, was the Fed’s decision not to scale back the rate of Quantitative Easing (Money-Printing, QE). The expectation was that they would lower it from $85 billion a month to $75 billion based on comments from Chairman Ben Bernanke back in May. Over the ensuing four months, interest rates have risen over one percent and stock markets have been on a roller-coaster ride as investors have attempted to read the tea leaves. However, only a very microscopic minority guessed that there would be no Tapering of QE. A lot of this reflects on the failure Fed’s communication policy. (Ironically, it is the presumptive nominee for the next Chairman, Janet Yellen, who is in charge of the Fed’s current communication policy!)
After TAPER-gate: Well, what now? The question of when the Fed will Taper will not be going away. Already, economists are handicapping the possibility of a Taper at the end of October or the middle of December. There are a few factors that strategists are looking at. First, will the U.S. unemployment rate fall enough? Ben Bernanke has kicked around a couple of figures about which he has hinted as being important to him (primarily 6.5% & 7.0% compared to the current rate of 7.2%). However, he has trouble with respect to abiding by the lines that he has drawn in the sand.
There is also the issue of a number of fiscal showdowns in the U.S. Congress. One is the Debt Ceiling debate. To a casual observer, this might appear to be a brawl over what looks like a mere procedural issue. However, about 70% of U.S. Federal spending is “automatic” and is not reviewed as long as the Debt Ceiling continues to rise every year. So, the Debt Ceiling debate is actually the main Federal Budget debate in the U.S.. Budgets are extremely important with respect to the health of the economy, so it would be irresponsible to downgrade the Debt Ceiling debate to a “Partisan Squabble.”
Secondly, there will be a lot of debate over the funding of Obamacare. Somehow, during the legislation of Obamacare, the narrative seemed to be that there would be no major additional cost, just a realignment as to how costs would be charged and administered. However, fees and taxes will have to go up to pay for it. That is going to consolidate a lot of political opposition. Obamacare sounds good when talking about the benefits. But, when voters begin to confront the costs, they get mad. And their political representatives hear about it.
Some are beginning to speculate that there may be a proposal where the funding of Obamacare is scaled back in exchange for agreeing to raise the Debt Ceiling. President Obama wants it all. But, will he be willing to compromise? If not, we could get a shutdown of the U.S. Federal government on October 17th (down to essential services only) which would hit the economy. In light of that, the Fed may not want to Taper at all until we are past these political showdowns regardless of how low the unemployment rate may fall in the interim.
While news of the political wrangling will keep the equity markets anchored, the incredible tailwind provided by continued QE may make this September-October stretch look a lot more tame than it has traditionally.
The opinions expressed in this report are the opinions of the author and readers should not assume they reflect the opinions or recommendations of Richardson GMP Limited or its affiliates. Assumptions, opinions and estimates constitute the author’s judgment as of the date of this material and are subject to change without notice. We do not warrant the completeness or accuracy of this material, and it should not be relied upon as such. Before acting on any recommendation, you should consider whether it is suitable for your particular circumstances and, if necessary, seek professional advice. Past performance is not indicative of future results.
Richardson GMP Limited, Member Canadian Investor Protection Fund.
Richardson is a trade-mark of James Richardson & Sons, Limited. GMP is a registered trade-mark of GMP Securities L.P. Both used under license by Richardson GMP Limited.

…..on Options Expiry as Hong Kong Prepares for Golden Week.
WHOLESALE gold held unchanged in London on Wednesday, moving around last week’s finish of $1325 per ounce as world stock markets and the US Dollar also reversed yesterday’s small moves.
Silver traded in a 15-cent range either side of $21.70 per ounce.
Major government bonds were flat. Crude oil and industrial commodities ticked higher.
“It will likely be a very quiet few days,” reckons brokerage INTL FCStone in a note, “at least until Friday, when we get some end-of-the-quarter book squaring.”
October gold options contracts on the US Comex expire today.
“We remain range bound,” agrees brokers Marex, “but the drop down towards 1300 yesterday and the subsequent good recovery will have deterred the bears for the time being.”
However, “speculation that the Feds will begin tapering as early as next month,” counters Commerzbank, “continues to pressure the yellow metal.”
London’s wholesale precious metals trading is likely to be subdued early next week, as trade group the London Bullion Market Association holds its annual conference from Sunday to Tuesday, this year in Rome.
China’s long Golden Week holidays are also likely to dent import demand from stockists, dealers report.
Ahead of Golden Week, the government of Hong Kong – a major tourist destination for mainland residents during these annual holidays – has banned “forced shopping” trips, says the South China Morning Post.
Cut-price flights and hotel rooms were previously subsidized by kick-backs from stores to tour operators who brought in large groups, the paper explains.
Almost one million mainland tourists went to Hong Kong in Golden Week 2012, theWall Street Journal reported last October, “up nearly 25%” from the prior year. But sales of watches and gold jewelry “actually dropped” compared with 2011.
Gold prices for Chinese consumers have now fallen 25% since Golden Week 2012.
“We’re not seeing too much physical demand around,” Bloomberg today quotes senior vice-president Afshin Nabavi at Swiss refiner MKS in Geneva.
Elsewhere the newswire reports that for iPhone manufacturer Apple Inc., “bringing together China and gold is a recipe for success” after the US company reportedly asked its suppliers last week to increase production of “gold-colored” plastic casings for the new 5S handset.
Forbes says the same of gold-colored iPhone sales in India – now widely expected to take second place to China in physical gold demand this year.
“An assistant of the Punjab chief minister called me and asked for five gold-colored iPhones,” the magazine quotes a distributor for Apple products in the affluent Indian region.
Across in Thailand, meantime, YLG Bullion International Co. – the largest gold importer into the world’s 6th largest gold-buying nation last year – says its gold inflows will double in 2013 thanks to the surge in demand caused by gold’s 25% price drop.
YLG is also one of seven Thai companies calling for the launch of a formal bullion-contract exchange, the Bangkok Post reports, aiming to “enhance Thailand as a regional gold trading hub.”
Adrian Ash
Gold price chart, no delay | Buy gold online
Adrian Ash is head of research at BullionVault, the secure, low-cost gold and silver market for private investors online, where you can fully allocated bullion already vaulted in your choice of London, New York, Singapore, Toronto or Zurich for just 0.5% commission.
(c) BullionVault 2013
Please Note: This article is to inform your thinking, not lead it. Only you can decide the best place for your money, and any decision you make will put your money at risk. Information or data included here may have already been overtaken by events – and must be verified elsewhere – should you choose to act on it.
Three major trends became apparent in the Global Competitiveness Report over the past 12 years – one obvious, two perhaps surprising.
1. Asia Rising
2. Europe’s debt crisis and economic decline
3. Brazil, Russia, India and China overrated
 The good news is that the United States’ long period of Worldwide competitive decline to the #7 position has suddenly turned around in 2013. Perhaps its like any Market, the time to capture a significant reversal is, as James Dines told Michael Campbell this weekend “You need to go opposite to the crowd to make money. It’s not easy to do because we are programmed to listen to the people around us, or be influenced by it.”
Certainly it would be hard to argue that the mass opinion of radio, television newspapers and the average man on the street isn’t that the US is a Debt ridden cripple with economic cancer compared to its glory days of past. Meanwhile some technological marvel with the Worldwide impact of the printing press, or steam engine could be setting up a huge future US economic Boom.
I don’t think the author is arguing for a massive new economic upside explosion, but he does make some interesting points in this article Is the United States the Global Economy’s Comeback Kid?

WE SAW EXPECTED DOWNSIDE FOLLOW-THROUGH ON MONDAY, BUT VOLUME DECLINED AND TODAY IS A POTENTIAL ‘TURNAROUND TUESDAY’. CAUTION FLAGS ARE STILL RAISED THAT A MORE SERIOUS SETBACK COULD BE UNFOLDING. AFTERALL, THE LAST TIME I LOOKED AT THE CALENDAR IT WAS STILL SEPTEMBER AND OCTOBER LOOMS AROUND THE CORNER. BUT, BEARS HAVE TO BE WATCHFUL THAT THE WHITE KNIGHT (BERNANKE) WILL COME TO THE BULLS RESCUE. THE BIG ISSUE IS WITH THE BANKS – THE REASON I BELIEVE TAPERING WAS NOT INSTITUTED LAST WEEK, I.E., THE BANKS ARE IN TROUBLE AND THE FACT THE FED HAS LOST CONTROL OF LONG INTEREST RATES. DON’T BE SURPRISED TO SEE TAPERING INCREASE FROM $85 BILLION TO $100 BILLION OR MORE TO KEEP EQUITY MARKETS FROM DECLINING AND TO KEEP LONG BOND PRICES FROM DECLINING FURTHER.
———————————————
The S&P 500 was down 8.07 at 1701.84 touching 1697.10 intraday. It traded at a new bull market high of 1729.86 on Thursday. Risk is down to the 50 day moving average at 1678.00. A bigger sell-off would find support at 1627, 1610 and then 1550. When and if we clear 1729.86, look for 1757.00 and even possibly 1807.00.
——————————————–
The TSX was down 120.31 at 12806.47. Resistance is at the 12889.26 peak from back on May 22. Above there we could theoretically see 13370.00. Should we break below 11759.04 (the June 24 low) look for 11,400.
——————————————–
The TSX Venture was down 6.78 at 946.10. Next resistance is 971.96 then 1017.59. A double-bottom formed comparing the 859.31 low from June 27 to the July 9 low of 873.05. Under those lows, look for support at 830.00 and 780.00 on the way down

METALS – AS I WARNED, LAST WEDNESDAY’S BIG UPSIDE ‘KEY REVERSAL’ COULD HAVE BEEN NOTHING MORE THAN JUST ANOTHER ‘DEAD CAT’ BOUNCE. IF, HOWEVER, IF WE CAN CLEAR THURSDAY’S HIGHS, E.G., 1374.77, WE COULD BE ‘COOKING WITH GAS’. WE JUST HAVE TO WAIT AND SEE. THE SAME APPLIES FOR THE MINING SHARES. THE NEXT BIG UPSIDE BARRIER ARE THE AUGUST 27 HIGHS. IF, HOWEVER, WE BREAK UNDER WEDNESDAY’S LOWS, E.G., 1295 IN SPOT GOLD, WATCH OUT BELOW, WE COULD BE HEADED TO 1000 -NOT THE DESIRE RESULT, UNLESS, OF COURSE, YOU ARE SHORT. AT THE MOMENT, THAT APPEARS TO BE THE MORE VIABLE STRATEGY. FOR THE MIINERS, WATHC THE PHLX XAU INDEX UNDER 88.29 OR 82.28.
———————————————
Spot Gold was down 1.76 at 1319.27. Gold touched 1295.15 intraday last Wednesday forming a ‘key reversal’ day to the upside, but ran into a stone wall at Thursday’s high of 1374.77. The recent high is 1432.38 from August 28. To date, the big, big low (as compared to the record high of 1922 from September, 2011) was formed on June 28 at 1186.40.
———————————————
Spot Silver was up .17 at 21.69. Last Wednesday’s low at 21.23 is still being tested with 20.61 and 18.31 next support. Downside risk is to 13.00 if these levels are violated. We need to clear 23.90 and 25.07 to begin talking about the resumption of the uptrend.

The 2013 Annual Forecast Model is now on-line. SUBSCRIBE NOW! It is a premium report.
If you call my office by Thursday of this week and leave your name and number, you will be entitled to receive a 50% discount on this valuable report. If you wish to order from the internet and pay full price, here is the link:
https://www.vrtrader.com/subscribe/index.asp
The Annual Forecast Model (The VR Forecaster Report) is published each and every year in early February and comprises Mark Leibovit’s proprietary cyclical forecast for the Dow Industrials and Gold. Don’t miss the opportunity to see this Report that projects market direction and/or important cyclical change points months in advance. We have called it our ‘Blueprint to the Future’. Unique to Mark Leibovit it has been published since the mid 1980s. Access to the report is provided via the website using the username and password provided to you.
About Mark Leibovit
Mark Leibovit is Chief Market Strategist and Publisher for the VRTrader.com -“Tools for the High Performance Trader”, the Leibovit VR Gold Letter and the author of ‘The Trader’s Book of Volume’ which was published in 2011 by McGraw-Hill. You may have recognized Mark as one of the ten “Elves” on Louis Rukeyser’s Wall Street Week television program where he served as a weekly consultant for 7 years and also as a regular Market Monitor guest for the past 30 years on PBS’ The Nightly Business Report. He is a popular speaker at investment conferences both in the U.S. and Canada and is often seen on PBS, BNN and FOX Business News. TIMER DIGEST Magazine has named him the #1 Gold Timer for the twelve-month period from 8/26/10 to 8/26/11 and the #2 for 2011 He was also named the #1 Intermediate Market Timer for the 10-year period ending in 2007. Mr. Leibovit was a member of the Chicago Board Options Exchange where he became a market maker in several stocks including Newmont Mining. Through the late 1980s he was Technical Research Director for Rodman & Renshaw and subsequently began publishing several financial newsletters. He holds a CIMA and AIF designation and is a member of the Market Technicians Association (MTA) and the CFA Institute.
——————————————–
What is a Leibovit Volume Reversal (VR)?
A Leibovit Volume Reversal ™ is a change from a Rally day to a Reaction day accompanied by a increase of volume or a change from a Reaction day to Rally day accompanied by an increase in volume.
Leibovit Volume Reversals ™ coming off intermediate lows or highs have greater significance in helping to define those lows or highs and important pivot points in the marketplace. MEANWHILE, THEY ARE GENERALLY TRADEABLE FOR UP TO TWO DAY MOVES IN THE DIRECTION OF THE VOLUME REVERSAL.
Use the following link to sign up:
http://www.metastock.com/products/thirdparty/?3PC-ADD-VRIS
Mark Leibovit – Metastock Webinar – April 30, 2012. Here’s your chance to learn more about the proprietary Leibovit Volume Reversal indicator and strategy.
Link below:
The Volume Reversal ™ is a registered trademark and can only be used or quoted after receiving express written permission from VRTrader.com and Mark Leibovit.

-
I know Mike is a very solid investor and respect his opinions very much. So if he says pay attention to this or that - I will.
~ Dale G.
-
I've started managing my own investments so view Michael's site as a one-stop shop from which to get information and perspectives.
~ Dave E.
-
Michael offers easy reading, honest, common sense information that anyone can use in a practical manner.
~ der_al.
-
A sane voice in a scrambled investment world.
~ Ed R.
Inside Edge Pro Contributors

Greg Weldon

Josef Schachter

Tyler Bollhorn

Ryan Irvine

Paul Beattie

Martin Straith

Patrick Ceresna

Mark Leibovit

James Thorne

Victor Adair