
Timing & trends
 Last week’s intense market action created a great limited risk trading opportunity…and may also have created an important Key Turn Date as markets surged on Wednesday but reversed hard Thursday/Friday. If gold and stocks take out last week’s lows we could see heavy selling.
….read more & view charts HERE

Dow New High, Forget QE Tapering Expect Expansion!
The Dow Jones stocks index closed at another all time high of 15,676, catching many if not most so called market analysts off guard as for the duration of the stock markets latest correction could be found to be singing the new secular or cyclical bear market has begun mantra, despite the fact that many of whom have been singing the same tune for the duration of the 5 year plus of the stocks bull market.
…..view 6 more chart and the commentary HERE
The FED Blinked. It’s been my expectations that if “tapering” actually began, it wouldn’t be long before the FED would be pressured to go back to QE mode as the economy starts to accelerate to the downside. Well they blinked and now have begun the process that should lead to a perception of going from in front of the curve to behind.
The gentleman noted in this Zerohedge article truly hit the nail on the head (and Lies-man of TOUT-TV remains one of chief mates on the ships of fools that litter that network).
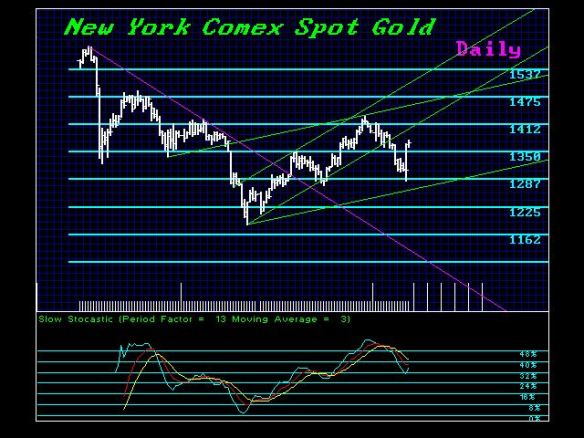
Gold meanwhile had a key reversal and while I would like to wave an “all-clear” flag I know the manipulators who were applying their trade just a couple of weeks ago won’t just simply go away. Interesting days ahead for the yellow metal.

Where have all the U.S. dollar bulls gone? We’re close to key support and while I don’t anticipate breaking below on the first couple of tests, the bears are sniffing some bull meat upcoming.
I said a few weeks ago that I felt the 3% yield on the 10-yr. T-Bond should be the high mark until the real crisis comes when the world finally concludes America no longer has real ability to pay its debts.
- Alderon Iron Ore
- Teranga Gold
- If it was me, I wouldn’t own and housing related equities.
- Currency war near?
- No more something for nothing forever.
And finally, shame, shame shame on all those who walked out the room
“we will be increasing in volatility the last week of September”
….more comments and charts HERE
House Votes to Defund Obamacare – Again
However, Congress must pass a CR to set federal funding levels by Oct. 1, or the government will partially close. No doubt our computer has been targeting the last week of September and then the weeks of Oct 7th/14th look key. House Republicans see the mandatory deadline as a final opportunity to cripple the 3-year-old Obamacare law.
….read more HERE
It’s a Matter of Confidence
Stocks are not rising because of “confidence” in the Fed, the central banks have themselves been buying stocks lacking confidence in public debt. Money has NO CHOICE but to go to stocks. Pension will go bust and stocks are becoming the ALTERNATIVE to government debt.
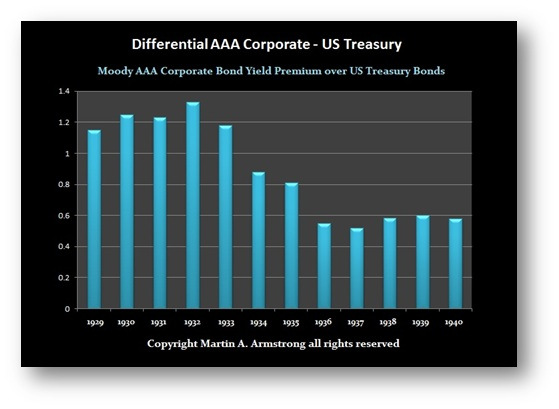
Even during the Great Depression, corporate bonds were in higher demand than government. Read the newspaper of 1929 and you will see the complete opposite interpretation of the same fundamentals from today.
There is a cycle to fundamental interpretations as well.
….read more HERE
Despite a dramatic increase in the Fed’s balance sheet, the Producer and Consumer Price Indexes are subdued
Robert Prechter created this chart for a speech he gave to the Market Technicians Association in April 2013, which is reprinted in the July-August Elliott Wave Theorist. He used the chart to address the often-voiced fear that runaway inflation is just around the corner because, via quantitative easing, the Federal Reserve has been manufacturing new banknotes and swapping them for the debts of others – a process that inflates the supply of dollars.
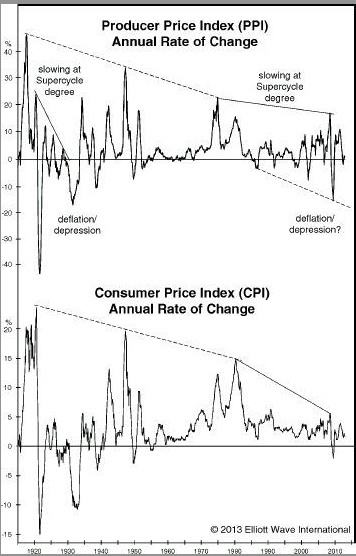
The Fed has been inflating the supply of dollars at a stunning 33% annual rate over the past five years. It plans to continue doing so at least through the end of this year and has kept open the possibility that it will do so indefinitely. This is the policy upon which those predicting runaway inflation are basing their arguments. With this dramatic a rise, it’s no wonder investors expect inflation and have aggressively positioned for it.
Look just about anywhere else, however, and you will see subtle evidence of deflationary pressures. Given knowledge only of the Fed’s inflating, many people would expect the Producer and Consumer Price Indexes to be rising at a rate of 33% annually. But, as you can see in [the chart], the PPI’s annual rate of change is stuck at zero and the CPI has been rising at only a 2% rate.
— The Elliott Wave Theorist, July-August 2013
Everyone else is talking about inflation, but deflation is the real threat they should be concerned with.
Elliott Wave International have created a report that spells out the dangers of deflation and you can have it on your screen with just a few clicks — free! See below for full details.
Learn Why Deflation Is the Biggest Threat to Your Money Right Now
Discover Robert Prechter’s views on the unfolding deflationary trend by reading the 90-page report, The Guide to Understanding Deflation. This guide will help you survive a major deflationary trend, and even equip you to prosper.
Plan and prepare for your financial future. Download Your Free 90-Page Deflation Survival Guide eBook >>


-
I know Mike is a very solid investor and respect his opinions very much. So if he says pay attention to this or that - I will.
~ Dale G.
-
I've started managing my own investments so view Michael's site as a one-stop shop from which to get information and perspectives.
~ Dave E.
-
Michael offers easy reading, honest, common sense information that anyone can use in a practical manner.
~ der_al.
-
A sane voice in a scrambled investment world.
~ Ed R.
Inside Edge Pro Contributors

Greg Weldon

Josef Schachter

Tyler Bollhorn

Ryan Irvine

Paul Beattie

Martin Straith

Patrick Ceresna

Mark Leibovit

James Thorne

Victor Adair