
Timing & trends
First: There are lots of reasons to be fully invested in the stock market right now. And that’s why it’s so important to keep an eye on all the bubbles. They’re everywhere. And we have plenty of reasons to fear any number of them bursting, especially this one…
No fewer than 165 stocks on the major exchanges hit new 52-week highs yesterday, which is all the more reason to take notes today… Shah’s been identifying bubbles for decades, ever since his hedge fund days. And now that he uncovers them for individual investors, his readers know firsthand that “bubble watching” is more than a wealth protection strategy.
There are lots of reasons to be fully invested in the stock market. And that’s why it’s so important right now to keep an eye on all the bubbles.
They’re everywhere. And we have plenty of reasons to fear any number of them bursting.
So let’s look at these bubbles now, while you still have time to prepare. And I’m not just talking “capital preservation” here…
You can make a killing when a bubble bursts, especially the one we’ll start with today.
It’s the biggest of the big bubbles. And it could start hissing at any moment.
The hissing will be loud, too…
How to Prepare for “The Mother of All Bubbles”
It may not be classified as a bubble, but it is. We know what bubble-bursting effects it has because it burst in 2008 and shook the life out of global financial markets.
I’m talking about “interconnectedness.”
Manifest and growing interconnectedness creates its own bubble. The bubble enlarges as masses of banks and financial institutions and private investors end up on the same side of the same bets. The bubble bursts when they want out, when they all head for the exit doors at the same time.
In 2008, the bubble, on the outside, stretched around mortgages, subprime and prime mortgages. But on the inside, the massively inflating mortgage bubble resulted from a desperate clamor by investors of all stripes. The hunt for yield took investors further and farther out on the risk spectrum.
Low interest rates were the conduits through which hot air filled the mortgage market balloon.
Why is that important now?
Because the same-as-before manipulation of interest rates by governments and central banks has forced investors into riskier and riskier assets in the hunt for yield across the global low-rate environment, again.
In order to maximize low-yielding investments in bonds, namely sovereign and corporate bonds, collectively far and away the largest asset class on the planet, investors leverage themselves by borrowing to increase exposure to magnify their returns. It is this debt surge that underlies the interconnectedness pumping up the interconnectedness bubble.
As long as interest rates are low and yield curves around the globe are fairly steep, which means short-term rates are a lot lower than long-term rates, the leverage that investors have employed in the form of short-term borrowings to pay for higher-yielding longer-term bonds will work in their favor.
But if short-term rates rise faster than long-term rates…
(chart via Barry Ritholtz – The Big Picture)
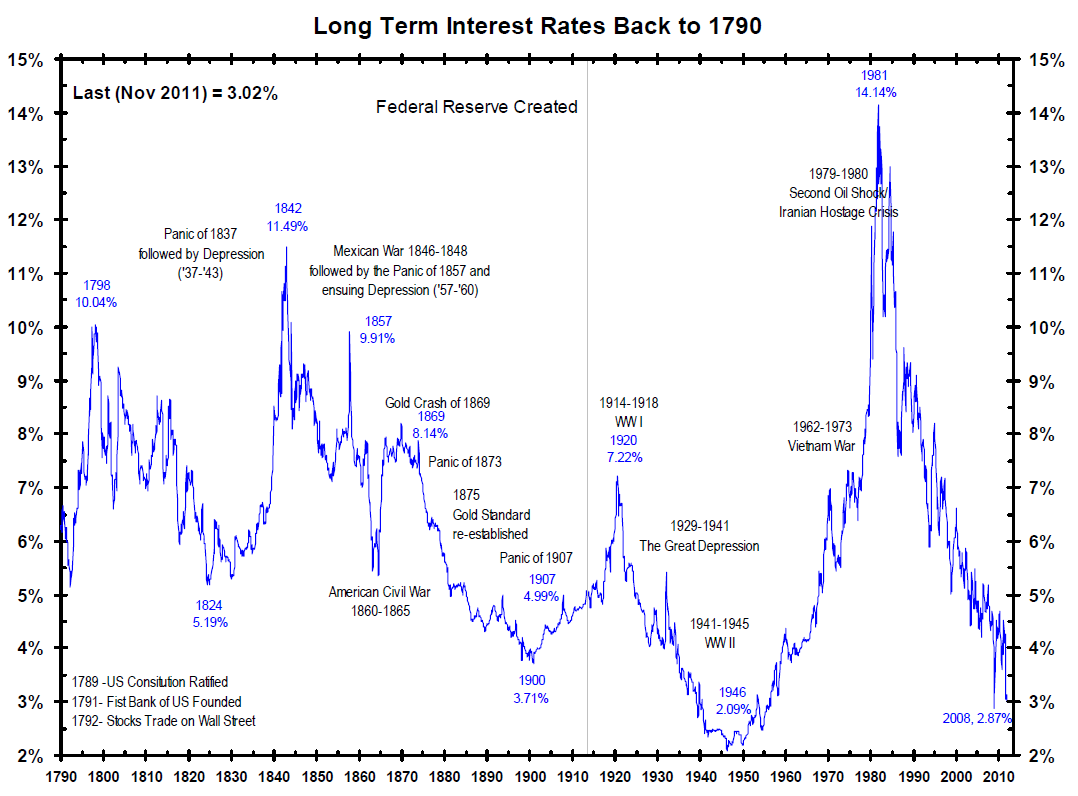
The “Hissing” Will Be Loud
It’s bad enough if long-term rates rise, knocking down the price of existing bonds that offer lower yields, such that investors holding those long-term bonds have mark-to-market capital losses on their books. Investors, like banks, have to contend with reserve ratios, and losses on their portfolios will cause them to have to raise capital or deleverage. Still, they don’t have to sell the bonds and actually take capital losses.
The Federal Reserve is the best example of this.
It is sitting on over $3 trillion in bonds and has an approximate loss on its portfolio of some $200 billion as rates have ticked higher. But it doesn’t have to mark-to-market its portfolio (like banks do), and it doesn’t have to sell its bonds, ever.
The hissing sound of the debt interconnectedness bubble deflating will start to be heard if short rates start to rise, and it will be heard loudly.
Mass panic could ensue if investors’ cost of carrying their inventory of relatively low-yielding longer-term bonds rises.
Because most institutional investors and all banks borrow short term on a huge scale, if short-term interest rates they have to pay start rising and they keep having to rollover and borrow more when their short-term borrowings mature in days, weeks, and months, they will start losing the “spread” on the investment they bet on. If at the same time long-term rates move up (causing capital losses), then the “trade” becomes increasingly unprofitable, and to unwind positions, investors will sell their long inventory of bonds before their capital losses mount.
Selling, on a massive scale, would create a global panic as leveraged investors everywhere rush for the exit doors.
It’s the global interconnected of the same debt bubble caused by low rates that worries central bankers and governments.
And rates are starting to rise.
But, so far, central banks have kept a lid on short rates. Long rates can rise, and although they are causing many problems already, a steady and measured rise in long rates can be absorbed by most economies without dire consequences.
However, if long rates jump precipitously or if short-term rates rise unexpectedly and central bankers can’t keep a lid on them, look out!
What to Watch
Investors have to watch the yield curve and know at what rates the long end of the curve and the short end of the curve are rising, both in absolute terms and relative to each other.
Rising rates will cause massive problems, economic disruptions, and losses everywhere, in some places and on some assets more than others. We’ll cover all of those scenarios in this series.
But as far as interconnectedness and the bubble brewing in global debt interconnectedness, investors can hedge their exposure to rising interest rates by buying inverse bond ETFs, by buying puts on debt-denominated ETFs, and by managing their own bond portfolios by deleveraging themselves and keeping portfolios short term in duration.
For investors seeking to profit from the debt interconnectedness bubble bursting, taking longer-term positions, meaning buying inverse ETF instruments and ETFs that will rise if bond prices fall, is much better than buying options, which if you don’t get the timing right will expire and have to be continually rolled over.
But don’t worry…
I’ll be covering this situation for you right here in Money Morning. And I’ll be suggesting specific positions you can take to either hedge yourself or play the bursting of these bubbles for pure profit.
Stay tuned…

“Gold rallied under the nonsense this will be inflationary”
Fed is Trapped – They’ve Injected Tremendous Volatility Into the System
The Fed said that it would continue buying bonds at an $85 billion monthly pace for now, expressing concerns that a sharp rise in borrowing costs in recent months could weigh on the economy. What the Fed is really saying is that behind-the-curtain everyone is screaming that interest rates will rise and that will blow out the deficit. Gold rallied under the nonsense this will be inflationary, when in fact the opposite is necessary to send the deficit soaring out of control. This is why Japan bought government bonds to help keep rates down.
….read more HERE
The Buying in of Long-Term to save banks 2007-2010, Has Now Placed a Time Bomb at the Door
Treasury Secretary Jack Lew made the following statement during remarks today before the Economic Club of Washington D.C.:
“[W]e are relying on investors from all over the world to continue to hold U.S. bonds. Every Thursday, we roll-over approximately $100 billion in U.S. bills. If U.S. bond holders decided that they wanted to be repaid rather than continuing to roll-over their investments, we could unexpectedly dissipate our entire cash balance.”
Wonder why the Fed is Boxed-In?
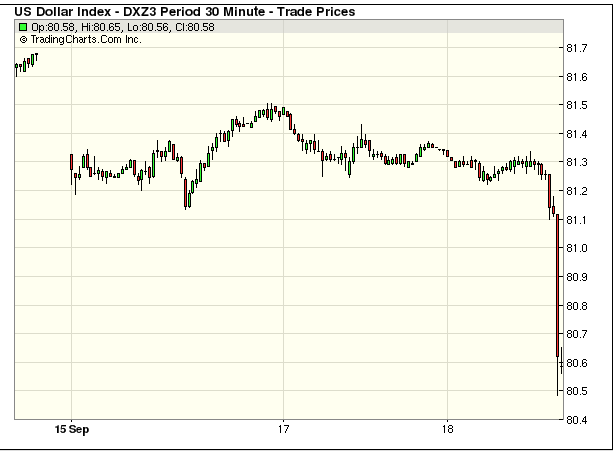
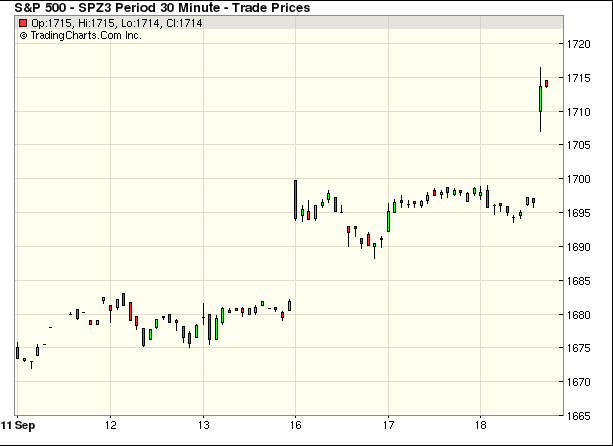
The Federal Reserve’s FOMC statement is out, and it’s a shocker!
The Fed is NOT TAPERING its massive $85 billion large-scale asset purchase program.
Almost no one expected this.
The Dow went from -40 to +63 in the blink of an eye.
The S&P 500 got as high as 1,718, which is an all-time intraday high. With general expectations focused on a Fed taper of $5-$15 billion, traders raced into stocks in the aftermath of the decision.
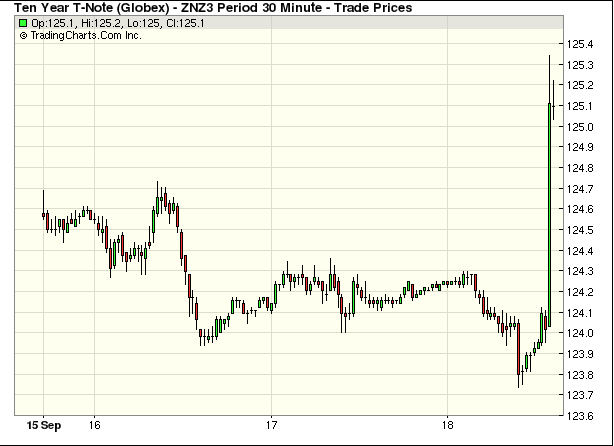
The U.S. dollar tanked, and gold spiked, bonds zoomed driving interest rates down.
The Fed also issued its economic projections. FOMC participants now expect GDP to come in between 2% and 2.3% this year, down from 2.3% to 2.6% last time, and the unemployment rate to come in at 7.1% to 7.3%, down one-tenth of a percent on both ends of the range. Three Fed officials expect the first rate hike to come in 2014, 12 expect it in 2015, and two in 2016. The central forecast for the 2016 rate path is around 1.75% to 2%.
P.M. Kitco Roundup: Gold Shoots Higher As FOMC Does Not Announce “Tapering”- HERE
Here’s the market action as of 11:55 Pacific Time:
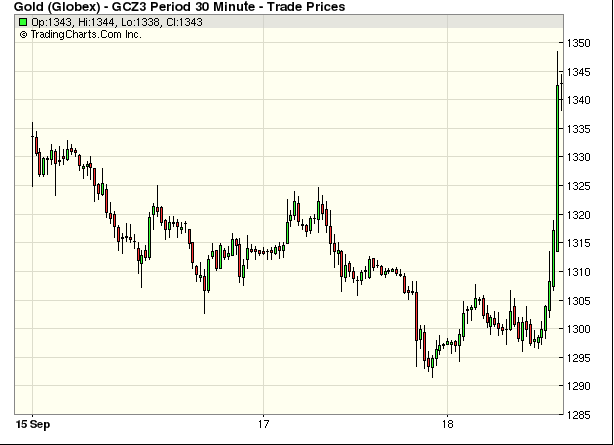

Today, gold in the global market extended losses into a third session and dropped below $1,300 an ounce, with investors expecting the U.S. Federal Reserve to announce a reduction in its bullion-friendly stimulus measures.
According to Reuters, the Fed is expected to begin its long retreat from ultra-easy monetary policy by announcing a small reduction in its $85 billion monthly bond purchases. Most economists expect the U.S. central bank to announce a $10 billion reduction. The FOMC meeting statement will be released today afternoon followed by Fed Chairman Ben Bernanke’s news conference.
Due to the volatility in prices, physical demand has failed to pick up rapidly in key consumers India and China. Expectations that prices could fall further once the Fed announces a cut in stimulus have also restrained purchases.
What impact did it have on gold in India? The yellow metal fell to its lowest level since mid-August and reached Rs 81,642 an ounce.
Speaking about the recent events, it’s worth mentioning that yesterday India increased the import duty on gold jewelry to 15% from 10% in a move to protect the domestic jewelry industry. The world’s top gold consumer left the import duty on bullion unchanged at 10%. By keeping the import tax on jewelry higher than that of bullion, price-conscious consumers would be forced to buy those manufactured within India.
At this point, it’s worth noting that there have been no fresh supplies into India since July 22 when the Reserve Bank of India issued tough new rules tying imports to export volumes.
While the tax hike is part of India’s efforts to curb gold imports, it is unlikely to have a significant impact since jewelry accounts for only a small portion (less than 10%) of the country’s gold imports.
And what has happened in the recent days with the rupee?
After Monday’s increase to its highest level since mid-August, yesterday the Indian currency gave up the gains as investors preferred to take profits on their long rupee positions ahead of the U.S. Federal Reserve’s two-day policy meeting outcome due to be released.
The outcome of the Fed’s meeting will be a key determinant of what the Reserve Bank of India chooses to do at its monetary policy review on Friday.
Having discussed this interesting piece of data, let’s take a closer look at the charts to find out what the current outlook for gold priced in rupees is.
The situation has deteriorated once again since my previous essay was published.
Quoting my previous essay on gold in India from September 13:
(…) the strong support zone is between Rs 81,369 and Rs 81,601, where the 61.8% Fibonacci retracement level based on the entire June-August rally intersects with the June top. Taking the above into account we see that there is still much room for further declines.
As we see on the above chart, gold bears didn’t give up in the recent days and reached the above mentioned price target today. If this strong support zone encourages buyers to act we will likely see a pullback in the following days. In this case, gold priced in rupees may come back to at least Rs 85,000. However, if the Fed’s statement triggers another decline in gold in the global market we should prepare for lower values. Taking into account this negative scenario, the next strong support zone is around the August low at Rs 77,770. Slightly below there is also the 76.4% Fibonacci retracement level, which reinforces this area.
Once we know the current situation in gold priced in rupees, let’s take a look at the INR/USD chart and find out whether the relationship between gold and the INR/USD exchange rate still exists or not.
On the above chart we see that the situation has improved in the recent days. However, this improvement didn’t last long.
Quoting my previous essay on gold in India from September 13:
(…) a consolidation has formed in the recent days. (…) If the buyers do not give up and push the price above the Wednesday’s high, the INR/USD exchange rate will likely climb to at least the 61.8% Fibonacci retracement level. Please note that this area is also supported by the 38.2% Fibonacci retracement level based on the entire May-August decline.
Although, the buyers pushed the price higher the rupee didn’t reach the above mentioned price target. The combination of gold bulls weakness and the 160 level stopped the rally and the rupee against the dollar dropped to the consolidation range.
Summing up, taking all the above facts into account, the question is: has the recent drop in the rupee against the dollar had any positive impact on gold? Not really. Just as I indicated previously it seems that gold stopped responding to the rupee price moves. The Tuesday’s decline didn’t trigger an upward move in gold. In other words, the recent negative correlation didn’t work once again. From today’s point of view it’s hard to estimate whether this tendency changed. That’s why it is important to watch how gold reacts to price moves in the rupee against the dollar which we are likely to see in the not-too-distant future.
If you’d like to stay up-to-date with our latest free commentaries regarding gold, silver, crude oil and related markets, please sign up today.
Thank you.
Nadia Simmons
Sunshine Profits‘ Contributing Author
Gold Trading Tools and Analysis – SunshineProfits.com
* * * * *
Disclaimer
All essays, research and information found above represent analyses and opinions of Nadia Simmons and Sunshine Profits’ associates only. As such, it may prove wrong and be a subject to change without notice. Opinions and analyses were based on data available to authors of respective essays at the time of writing. Although the information provided above is based on careful research and sources that are believed to be accurate, Nadia Simmons and his associates do not guarantee the accuracy or thoroughness of the data or information reported. The opinions published above are neither an offer nor a recommendation to purchase or sell any securities. Nadia Simmons is not a Registered Securities Advisor. By reading Nadia Simmons’ reports you fully agree that he will not be held responsible or liable for any decisions you make regarding any information provided in these reports. Investing, trading and speculation in any financial markets may involve high risk of loss. Nadia Simmons, Sunshine Profits’ employees and affiliates as well as members of their families may have a short or long position in any securities, including those mentioned in any of the reports or essays, and may make additional purchases and/or sales of those securities without notice
Is the Stock Bubble About to Burst?
Ben Bernanke has created the mother of all bubbles.
Today, the S&P 500 is sitting a full 30% above its 200-weekly moving average. We have NEVER been this overextended above this line at any point in the last 20 years.
Indeed, if you compare where the S&P 500 is relative to this line, we’re even MORE overbought that we were going into the 2007 peak at the top of the housing bubble.
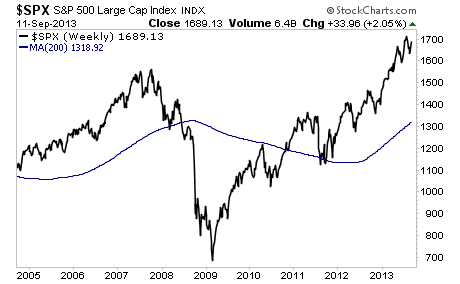
We all know how bubbles end: BADLY.
This time will be no different. The last time a major bubble of these proportions burst, we fell to break through this line in a matter of weeks.
We then plunged into one of the worst market Crashes of all time.
By today’s metrics, this would mean the S&P 500 falling to 1,300 then eventually plummeting to new lows.
This is not doom and gloom. This is a fact. The Fed has created an even bigger bubble than the 2007 one.
The time to prepare for this is not once the collapse begins, but NOW, while stocks are still rallying. Stocks take their time moving up, but when they crash it happens VERY quickly.
Yours in Profits,
Graham Summers
With the above in mind, I’ve already urged my Private Wealth Advisory clients to start prepping. We’ve opened six targetted trades to profit from the stock bubble bursting.
We’ve also taken care to prepare our finances and our loved ones for what’s coming, by following simple easy to follow steps concerning our savings, portfolios, and personal security via my Protect Your Family, Protect Your Savings & Protect Your Portfolio reports.
I’ve helped thousands of investors manage their risk and profit from market collapses. During the EU Crisis we locked in 72 straight winning trades and not one loser, including gains of 18%, 28% and more.
In fact, we’re currently on another winning streak having locked in FOURTEEN winning trades in the last two months, including gains of 10%, 11%, 21% and 25%.
All for the the small price of $299: the annual cost of a Private Wealth Advisory subscription.
To take action to prepare for what’s coming… and start taking steps to insure that when this bubble bursts you don’t lose your shirt.

-
I know Mike is a very solid investor and respect his opinions very much. So if he says pay attention to this or that - I will.
~ Dale G.
-
I've started managing my own investments so view Michael's site as a one-stop shop from which to get information and perspectives.
~ Dave E.
-
Michael offers easy reading, honest, common sense information that anyone can use in a practical manner.
~ der_al.
-
A sane voice in a scrambled investment world.
~ Ed R.
Inside Edge Pro Contributors

Greg Weldon

Josef Schachter

Tyler Bollhorn

Ryan Irvine

Paul Beattie

Martin Straith

Patrick Ceresna

Mark Leibovit

James Thorne

Victor Adair