
Timing & trends
Seasonality refers to particular time frames when stocks/sectors/indices are subjected to and influenced by recurring tendencies that produce patterns that are apparent in the investment valuation. Tendencies can range from weather events (temperature in winter vs. summer, probability of inclement conditions, etc.) to calendar events (quarterly reporting expectations, announcements, etc.). The key is that the tendency is recurring and provides a sustainable probability of performing in a manner consistent to previous results.
Identified below are the periods of seasonal strength for each market segment, as identified by Brooke Thackray. Each bar will indicate a buy and sell date based upon the optimal holding period for each market sector/index.
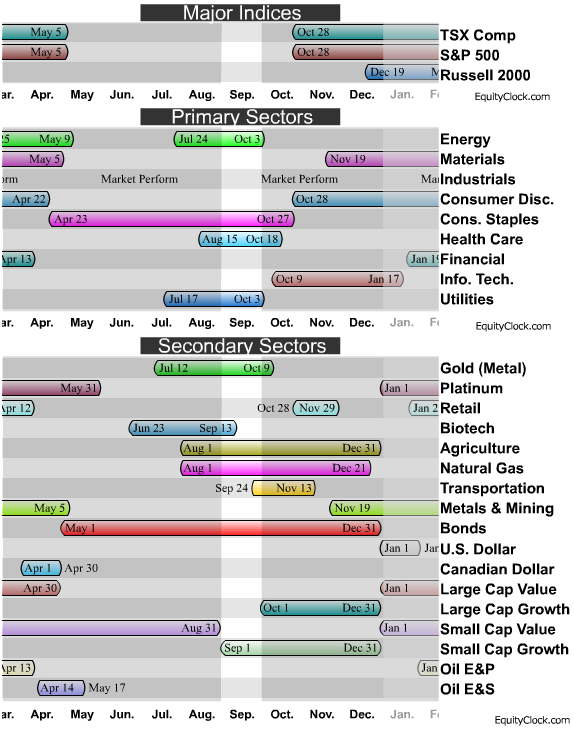
A seasonality study preferably uses at least 10 years of data. Most of our studies use 10-20 years of data, however, data may not always be available for periods greater than 10 years in length. Studies using less than ten years of data can be used, but they tend to be less reliable. Results of shorter term studies have a higher chance of being skewed by a single data point.
AN EXAMPLE OF INDIVIDUAL MARKET CHART BELOW. MORE INDIVIDUAL MARKET CHARTS HERE:
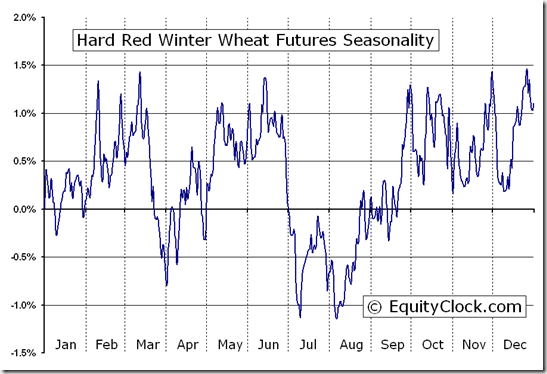
The above chart represents the seasonality for Gold Futures (GC) Continuous Contract for the past 20 years.
- Date range: January 1, 1990 to December 31, 2009
- Type: Commodity Futures – US
- Symbol: GC
Gold Futures Continuous Contract Seasonality
Analysis has revealed that with a buy date of September 13 and a sell date of May 23, investors have benefited from a total return of 183.61% over the last 10 years. This scenario has shown positive results in 9 of those periods.
Conversely, the best return over the maximum number of positive periods reveals a buy date of September 16 and a sell date of May 20, producing a total return over the same 10-year range of 159.82% with positive results in 10 of those periods.
The buy and hold return for the past 10 years was 125.11%.
**Results shown are compounded
FOR ALL SEASONAL MARKET CHARTS FROM FOREX, INDICES, COMMODITIES AND MORE GO HERE
Equity Clock is a division of the Tech Talk Financial Network, a market analysis company that provides technical, fundamental and seasonality analysis on a daily basis via TimingTheMarkets.com andEquityClock.com. Equity Clock’s mission is to identify periods of reoccurring strength among individual equities in the market using methodologies presented by some of the top analysts in the industry, including that of Don Vialoux, author of TimingTheMarkets.com.
Feel free to use any of the content or seasonality studies (charts, timelines, or otherwise) presented as long as a link-back to this site at EquityClock.com is provided.
For further information on indicators used in reports presented on this site, please visit our reference page.

 Faber views China’s huge credit bubble, one that had been growing rapidly since 2008, as the next global financial crisis hot spot.
“The inflation in China is much higher than it seems. Credit growth in China will slow down. It is very much depends on whether they’re going into hard landing or soft landing, but this will inevitably lead to economic slowdown in emerging markets,” he said.
He sees the colossal credit bubble in China that had been expanding rapidly since 2008 as the next biggest risk to global economic growth.
….read it all HERE
Gold has not been a very good Investment over longer periods of time
We have to be aware that over longer periods of time, gold has not been a very good investment, since it does not generate new businesses, it does not generate dividends or cash flow. I would suggest some money ought to be in gold, as a replacement for having money on deposits with banks, for the risks in the banking system.
Protecting Yourself in the Coming Economic Collapse
Ed Note: Marc begins talking about Protecting Yourself in the Coming Economic Collapse @ the 3:38 mark in this 9:12 video

 Financial circles in Hong Kong are buzzing today on the new Goldman Sachs projection that gold may drop below $1,000 an ounce.
And in merely suggesting such a death sentence for the metal, Goldman’s pronouncement pushed the paper price of gold contracts down $20+.
Many technical indicators underscore Goldman’s views. There’s very little floor for gold prices below $1,200, signaling that gold could gap down quickly.
….read it all HERE
August Retail sales in the US came in at 0.2%, below the expected 0.5% and lower than an upward revised July of 0.4%. The US dollar index was under pressure on the news.
Drew Zimmerman
Investment & Commodities/Futures Advisor
604-664-2842 – Direct
604 664 2900 – Main
604 664 2666 – Fax
800 810 7022 – Toll Free
 I can, without a shadow of a doubt, declare that the technology paradigm shift whose precipice we now teeter, is by far and large the most significant event of the last 8 years. Now, considering the events of the last 8 years, that’s saying an awful lot. So what makes this event so much more important than the event of the last 13 years?
It’s the advent of truly usable Contextual Computing!
The prospects for this tech are outrageous. I have already started putting my mind into intense problem solving mode, and the medical, real estate and hospitality industries are on tap to witness some dramatic changes in the way business is done.
….read & view it all HERE

-
I know Mike is a very solid investor and respect his opinions very much. So if he says pay attention to this or that - I will.
~ Dale G.
-
I've started managing my own investments so view Michael's site as a one-stop shop from which to get information and perspectives.
~ Dave E.
-
Michael offers easy reading, honest, common sense information that anyone can use in a practical manner.
~ der_al.
-
A sane voice in a scrambled investment world.
~ Ed R.
Inside Edge Pro Contributors

Greg Weldon

Josef Schachter

Tyler Bollhorn

Ryan Irvine

Paul Beattie

Martin Straith

Patrick Ceresna

Mark Leibovit

James Thorne

Victor Adair