…..read & view 8 more charts HERE

“Oil is absolutely certain to become incredibly short in supply and very high priced. The imported oil is not your enemy, it’s your friend. Every barrel that you use up that comes from somebody else is a barrel of your precious oil which you’re going to need to feed your people and maintain your civilization. And what responsible people do with a Confucian ethos is suffer now to benefit themselves and their families and their countrymen later. The way to do that is to go very slow in producing domestic oil and not mind at all if we pay prices that look ruinous for foreign oil.
It’s going to get way worse later …
The oil in the ground that you’re not producing is a national treasure … It’s not at all clear that there’s any substitute [for hydrocarbons]. When the hydrocarbons are gone, I don’t think the chemists are going to be able to just mix up a vat and create more hydrocarbons. It’s conceivable that they could, I suppose, but it’s not the way to bet. We should spend no attention to these silly economists and these silly politicians that tell us to become energy independent.
Let me pose a question for you. It’s 1930. Oil in the United States is in glut. We have cartels to get the price up to $0.50 a barrel. Everywhere we drill we find more oil in our own country; everywhere we drill in Arabia we find even more.
What would the correct policy of the United States have been in that time? Well, the correct policy would have been to issue $150 billion of very long-term bonds and cart 150 billion barrels of Middle Eastern oil into the United States and throw it into our salt caverns and leave it there untouched until the current age.
It’s easy to see that in retrospect, but who do you see who ever points this out? Zero. We have a brain-block on this issue. We should behave now to do on purpose what we did on accident then.” – Charlie Munger
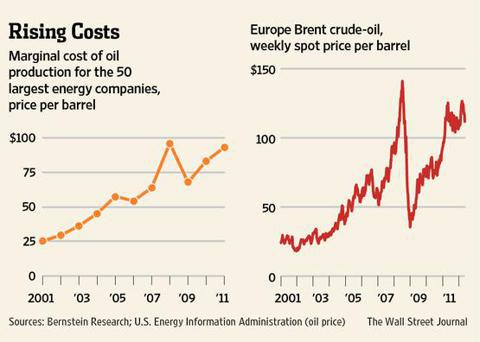
According to Bernstein Research, that marginal cost of production influenced by tight, deepwater and oil sands production, is now in excess of $90 per barrel.

Canada’s much-watched housing market is sending out mixed signals these days — even for analysts.
A spate of fresh data and yet one more market-cooling tweak from Ottawa last week has put one of the most important sectors in the Canadian economy, and the most important asset-source for most Canadians, on a kind of death watch.
That’s because while some of the data, such as home prices and starts, is pointing to the soothing “soft landing” that homeowners, economists, banks and politicians are fingers-crossed hoping for, others, like land purchases and building permits suggest the real message is: the crash is coming.
Last week, Statistics Canada reported that building permits in the residential sector fell 12.9 per cent in June, and permits for multi-unit dwellings — mostly condos — sank even further by 18.8 per cent.
Even more frightening, research conducted by RealNet Canada found that in some of the bigger markets — Toronto, Vancouver and Calgary — residential land investments for future home building has already crashed through the floor, plunging 51, 52 and 30 per cent respectively.
Muddying the picture is that a new temperature reading of the housing market from the Canadian Real Estate Association (CREA) being released on Thursday is likely to show that home sales are doing just dandy and likely rose significantly in July, along with average home prices.
But David Madani of Capital Economics says it is the calm before the storm.
Or as he put it in a note to clients — “homebuilders are having a Wile E. Coyote moment” as when the perpetually ill-starred cartoon character realizes he has overshot the cliff and looks down to see nothing but air under his feet.
“It’s astonishing to me that people are not picking up on this. If you see volumes crash and prices still rising, you shouldn’t be thinking everything is fine, you should see that as a warning sign,” he says.
“Here in Toronto, if you look at new home sales, we’re at near-record lows. If you think about the implication this has for home building, new construction and all the jobs that go along with that, this is quite startling.”
Some of that is yesterday’s news.
Housing sales have recently begun trending upwards again — even in Toronto and Vancouver — after almost a year’s slump brought on by Ottawa’s decision to apply the brakes on mortgages last July.
Bank of Montreal chief economist Doug Porter predicts next week’s report from CREA will show a 10 per cent surge in home sales from a year ago. He bases that on already reported data from big centres such as Toronto, Vancouver, Calgary and Edmonton, which all had boffo months, although there was a drawdown in Montreal and Ottawa.
Depending on whether you are an optimist or pessimist, this is either evidence of a soft or no landing, or a red flashing light.
The government’s decision last week to put a limit on the issuing of mortgaged-backed securities is an indication that Ottawa views this development as anything but reassuring.
“Arguably this is the second last thing anyone wanted to see in the housing sector, a re-acceleration,” Porter said. “That last thing people wanted to see was a hard landing.”
Good news like strong home sales is potentially bad, says Porter, on the theory that Canadians are already drunk on housing, so imbibing more means the inevitable hangover will be all that much worse.
Benjamin Tal, CIBC’s housing expert and deputy chief economist, wouldn’t go as far as Madani in predicting a price correction of as much as 25 per cent, but he agrees the time has come for caution.
“If I was a speculator, I would not be buying,” he says. “The days of flipping houses and speculating on increasing prices are clearly coming to a close. We are in the ninth inning of this boom.”
It’s been quite a ride. From January 2006 to June 2013, average home prices have risen from about $256,000 to almost $389,000, despite very low inflation and a little hiccup called the Great Recession. And, household debt from buying mortgages has ballooned to record levels above 160 per cent of disposable income.
The ride must end, agrees Tal, the only issue being is will it crash or simply coast.
So far, the consensus is on a slow coast, although the very real possibility of a hard crash has caused the Bank of Canada to put housing at the top of the list of domestic risks for the economy.
While housing constitutes only about seven per cent of the economy, the number underscores its impact.
Like a domino, if it topples, it triggers a chain reaction. Construction jobs are lost, household net worth diminishes, confidence drops and consumers start cutting back on other spending. On top of that, with families already highly indebted, defaults will almost certainly increase and lenders, such as banks, could find themselves taking enormous losses, dropping equity values, leading to tighter credit and slower growth. And on it goes in what economists call a re-inforcing negative feed-back loop.
“If we were indeed to have a serious setback in housing it would have pretty wide implications on the economy,” says BMO’s Porter.
The consensus view is still that the market will slowly decelerate rather than brake hard, if only because the economy continues to grow, employment is holding up and most critically with interest rates at super-low levels, borrowing is cheap.
But even Tal, who is in the soft-landing camp, acknowledges the danger. The housing market could stand to take a breather, he says.
That may be a good thing, given the exposure young people face in trying to buy even a starter home in cities like Toronto and Vancouver.
“I think the rental market will be stronger (going forward),” he predicts.
“We in Canada, especially in big cities, are fixated on buying a house the moment you graduate from university or get married. That’s not the case in many other cities in the world, there young people don’t think it a crime to rent for a time.”
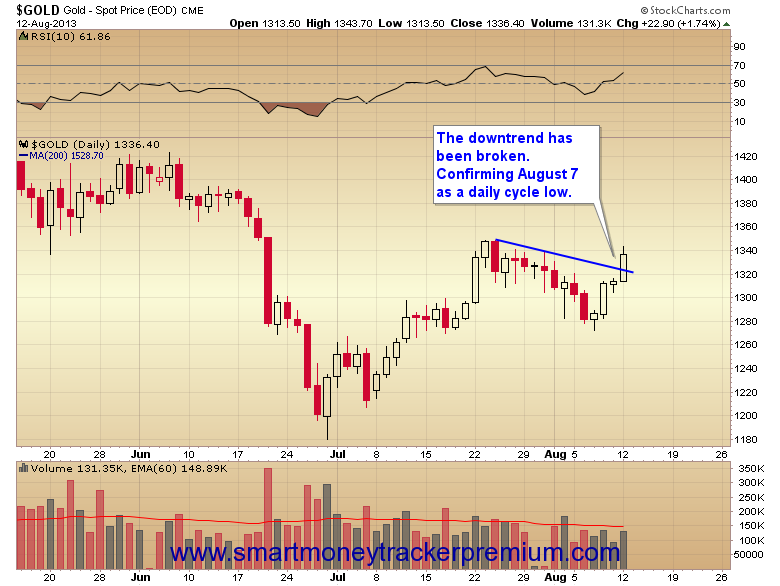
First off let’s go over the key cyclical points from today’s action.
Today gold broke above the cycle downtrend line, thus confirming August 7 as a daily cycle low.
It’s still sum… sum… summertime.
Still lazy hazy. Still crazy. And still not much action in the financial markets.
The Dow sold off a little on Friday. Gold went nowhere.
You’ve already heard our guess: Investors are marking time… waiting… procrastinating… maybe even thinking things over. The serious action won’t begin until summer ends. Then investors will return to their desks… and PANIC.
Panics are rare. Crashes are rare. And we’re not going predict something with small odds. Most likely, it won’t happen.
But sometimes you’re better off expecting something that never comes to pass. Because the importance of an event is a feature not just of its frequency… but also of its gravity.
You might, for example, feel like sending out photos of your crotch… or taking up with a beautiful young woman (a soul mate!) from Buenos Aires.
Can any dear reader honestly say he’s never considered doing such a thing? The odds of getting caught may be slim. It’s still better to think there’s a rat hiding behind every bush.
Because if you get nabbed, it can be a major bummer. Especially if you’re running for elective office. The newspapers might get ahold of it and make a big deal of it.
And think about this: You only die once. On any given day, the odds of dying are probably pretty low. Still, you never know. And when you do die, it’s a real game changer. So clean the porn off your computer now, just in case.
The Straight and Narrow
There are times for “out of the box” thinking and times to stay in the box. Most of the time, you’re better off in the box, keeping to the straight and narrow. That’s where most of life takes place.
And most of the time, the markets stay in the box too. No panics. No crashes. No bubbles.
BUT (and this is an all-caps “BUT”) as you get older, the odds of dying on any particular day increase. We checked the Social Security tables. A person born in 1948 has about 20 years to live – on average. But a person born in 1913 has barely 740 days to look forward to.
(So, too, do the odds of dying increase if you have a habit of drinking and driving – at the same time.)
And by the way, this market has a long history of behavioral problems. It’s addicted to easy credit. It hit bottom in 2000… and probably would have straightened up eventually. But the feds came in with more junk credit. In 2008 the market went into rehab. But the feds went to work on it again. They gave it even more credit on even easier terms.
At the time, investors, businessmen and householders all seemed to want to do the prudent thing – to cut back on their expenses and clean up their balance sheets. The feds put in place their zero interest rate policy in order to encourage them to take more risks.
Mom and Pop Dive In
The pros saw what was happening in 2009 and 2010. They knew the feds were ready to do “whatever it takes” to boost stock prices.
Stocks had fallen hard in the deleveraging crisis. The pros saw that (1) stocks weren’t expensive, and (2) the feds were determined to get prices up. So the pros bought.
Mom and Pop investors were slow to join the party… as always. They were burnt in 2000… and again in 2008. They were wary… cautious…
But now they’re back, says MarketWatch:
Data shows that the ordinary retail public – Mom and Pop – are back on Wall Street, and how! According to the Investment Company Institute, the Great American Public has poured $92 billion into the stock market via stock mutual funds since the start of the year.
To put that in context, in the first seven months of last year – when the market was much lower – they withdrew $180 billion. The last time the investing public jumped into the Wall Street pool with both feet like this was in 2007. And they are investing even more this time around. In the first seven months of 2007 they invested $85 billion into stock funds.
Mom and Pop are great parents. They go to Little League games. They vote. They separate their trash and wear their seatbelts.
But good investors they ain’t. The idea is to buy low and sell high. Poor old Mom and Pop can’t seem to get it right. They buy high and sell low.
Dalbar, an outfit that tracks investment performance, calculates that $100,000 invested 20 years ago would have grown to $484,000 if you had just left it in the S&P 500. But the typical investor… Mom and Pop… waited too long to buy and then sold out when stocks went down. At the end of 2012, they had only $230,000.
And now that stocks have been run up – by the Fed’s easy money policies – for five years, Mom and Pop can’t help themselves. They’re back in the stock market… ready to be skinned again.
Watch out below!
Regards,
Bill
From the Desk of Chris Hunter
The S&P 500 is up 20% for the year. That makes it the tenth strongest start to a year ever.
The only stronger years were in 1933, 1987, 1975, 1997, 1954, 1989, 1995, 1929, 1955.
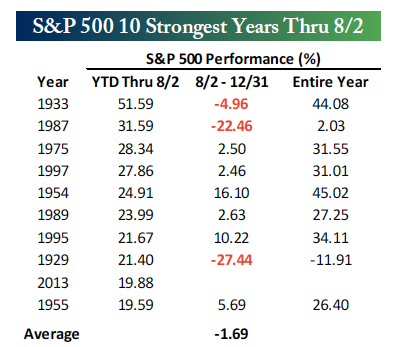
In only three years – 1933, 1987 and 1929 – did the market see losses for the 8/2 to 12/31 period.
And on all but on occasion – in 1929 – the market saw gains for the calendar year.
Of course, the market didn’t have the tailwind of a $3.5 trillion Fed balance sheet in these previous nine bull runs.
The S&P 500 has shown a roughly 90% correlation since the March 2009 low with increases in the Fed bond buying. That’s more than the correlation between stocks and earnings – which have historically determined prices… and which will someday determine prices again.
In a world where the end of Fed bond buying is now being openly discussed, a market that has moved dollar for dollar with Fed policy is vulnerable to say the least.
There’s no guarantee that 2013 will see a repeat of 1929 and 1987. But as Bill says, “The importance of an event is not a just feature of its frequency… but also of its gravity.”
Keep some cash onboard. It may come in handy soon.
The mantra that gold is the only inflationary hedge to use should have a closer look. Here is one – Ed.
My first article is based our just-released Market Overview (monthly reports). It focuses on gold as an anti-inflation hedge, and why it is precisely a hedge against something else. In the article below I will focus on John Paulson’s recent comments on gold by discussing the link between base money and gold. In short, significant increases in base money can be good reasons to be bullish, but not necessarily as bullish as Paulson argues.
John Paulson is betting in favor of gold based on his inflationary explanation of the current situation. He is consistent is his belief in the inflationary scenario when he states that the housing market is not far away from the bottom. He even goes so far to say that buying a home is one of the best investments one can make. (Let us not forget that Paulson correctly predicted the peak in the housing market and became a billionaire by short selling subprime mortgages in 2007). So where is the consistency? What does being bullish about gold have to do with being bullish about the real estate market? The answer is: if you believe in strong inflationary forces, you have to believe they should prevail macroeconomically, and you cannot separate various markets. If money printing should lead to inflation, you should see inflation everywhere, because it is a universal phenomenon; an upward march of prices. Of course, some markets are more affected than others. One price can increase by 10%, another by 25%, other by merely 4%. Nevertheless, once inflation takes a hold there are no doubts about it, since rising prices are noticeable virtually everywhere. Therefore, it would seem contradictory to argue on the one hand that high inflation is coming, and at the same time state that the housing market should still plummet. In other words, if you believe in hyperinflation, you should believe in a runaway boom, a flight into real assets, any assets useful to the public despite any possible debt shackles (since the real value of debt shrinks in the high inflation storm).
This of course does not imply that gold always has to move in the same direction as real estate. But, if the argument for buying gold is based on hyperinflationary conclusions, then one must accept the consequences and argue that other real markets also have to boom. That is the nature of high universal inflation: everything gets more expensive (except for money and past contracts, which lose their value). Therefore, if one posits that gold will rise because very high inflation is around the corner, one could just as well say that real assets are going to rise due to the upcoming inflation.
Actually the same goes with interest returns, including government bonds. If high inflation is on its way, one should see investors demanding inflationary compensation. In other words, interest returns on current investments should take into consideration the inflationary wave that is supposed to swipe the currency market. If you believe in hyperinflation, observe current interest returns and all commodity markets. If you do not see an upswing in both cases, nobody’s really expecting high inflation to happen. Therefore, you should not make the case for gold based on hyperinflation argument.
In the environment of very high levels of inflation (tens of percent) gold will rise as other real values. What is the case with single-digit inflationary scenario? Is gold really the inflation-hedge as it is touted? People believe so, and they are right when it comes to high inflation scenarios, but if we focus on smaller doses of inflation there is little correlation between the inflation rate and the gold price. Actually, as stated above gold is an anti-inflation instrument only when biginflation is on its way. Very big. The last 40 years tell us that gold has its own cycle, in fact unrelated to levels of inflation. Take a look at this graph:
For the last 40 years the dollar was constantly losing its value (right scale) sometimes faster, sometimes slower. Yet gold appears to have its own way of reacting to this steady decline in the dollar’s purchasing power. Take as an example the case of the period between 1982 to 2002 when the dollar lost half of its value. During the same period gold did not gain 100% to compensate for inflation. It did not increase and did not even stay at the same level. In fact it lost its value. It was one of the worst inflation-hedges one could pick. It did not save your capital from inflationary policies. Worse, because it was inferior to the dollar putting your green paper currency in socks was a better choice than buying gold.
Two decades is not a short run. We do not take the highest gold price from the 1980s to prove the point. During those 20 years gold was losing its value faster than the dollar. Then things changed. For the next ten years the dollar lost its value, but there was a significant shift in the gold market. During that period of time, as we well know, gold gained tremendously. Even though the time period is not very long it can clearly confirm one thing: gold has its own separate market. Its value may be related to the inflation rate, but it is not a primary reason for major shifts in the value of gold. Simply put, there is more–much more. Historically gold is not a good inflation hedge (or precisely it can be in only certain circumstances).
The key to proper understanding of the gold market and more importantly – making a correct investment choice in the gold market – is getting rid of this popular notion about the yellow metals and admitting that gold will not necessarily save you from the inflation monster. Yet it can save you from something else: the endangered dollar system.
As mentioned earlier, the above is a part of the first Market Overview report that we have just published. The full version includes detailed discussion of the anti-inflationary investing vs. anti-system investing (when is gold exactly an inflation hedge?), physical gold production, mining costs, and more. We are generally fans of the try-before-you-buy policy, so we have already provided two parts of this month’s Market Overview this and last week. We are also posting this month’s Overview later than usually so that if you sign up for the monthly subscription, you’ll be able to read 2 monthly Market Overview reports in this period. The price for one month is $14.95, but we decided to lower it for the first month to $9.95. So, instead of one for $14.95 you get two for $9.95 – that’s a 67% discount for a premium publication. We’re not saying that you have to sign up but we highly recommend that you do and given the discount, it would be a waste not to take advantage of it. You can sign up here.
Thank you.
Matt Machaj, PhD
Sunshine Profits‘ Contributing Author
Sunshine Profits’ Gold & Silver Market Overview
He is a free market advocate, believes in personal liberty, responsibility, and believes that social power is a better alternative than government power. Personally he believes that intelligence is the most powerful thing in the universe and beyond. He is no fan of conspiracy theories, but likes to study conspiracy practices.
* * * * *
Disclaimer
All essays, research and information found above represent analyses and opinions of Matt Machaj, PhD and Sunshine Profits’ associates only. As such, it may prove wrong and be a subject to change without notice. Opinions and analyses were based on data available to authors of respective essays at the time of writing. Although the information provided above is based on careful research and sources that are believed to be accurate, Matt Machaj, PhD and his associates do not guarantee the accuracy or thoroughness of the data or information reported. The opinions published above are neither an offer nor a recommendation to purchase or sell any securities. Matt Machaj, PhD is not a Registered Securities Advisor. By reading Matt Machaj’s, PhD reports you fully agree that he will not be held responsible or liable for any decisions you make regarding any information provided in these reports. Investing, trading and speculation in any financial markets may involve high risk of loss. Matt Machaj, PhD, Sunshine Profits’ employees and affiliates as well as members of their families may have a short or long position in any securities, including those mentioned in any of the reports or essays, and may make additional purchases and/or sales of those securities without notice.

I know Mike is a very solid investor and respect his opinions very much. So if he says pay attention to this or that - I will.
~ Dale G.
I've started managing my own investments so view Michael's site as a one-stop shop from which to get information and perspectives.
~ Dave E.
Michael offers easy reading, honest, common sense information that anyone can use in a practical manner.
~ der_al.
A sane voice in a scrambled investment world.
~ Ed R.

Greg Weldon

Josef Schachter

Tyler Bollhorn

Ryan Irvine

Paul Beattie

Martin Straith

Patrick Ceresna

Mark Leibovit

James Thorne

Victor Adair