
Timing & trends
TRANSITION
-
We are getting there on the big Rounded Top for Global Equities and the equivalent bottom for the Precious Metals Sector.
-
Lower-grade bonds are well over the Top and facing a Jagged Cliff.
-
Depending upon the character of the trading day, central bankers seem to be
jousting at windmills or hoisting petards.
-
In April we noted that the potential reversal in the credit markets in May from bullish to bearish would “pre-empt” the big decision by the Fed to end the bond buying spree. Bad news.
-
The hit to global credit markets was fast and hard. The rise in yields was natural, but the Fed had to be seen as “in charge” so Bernanke mumbled something about “tapering”.
-
The initial bond panic exhausted itself and a week into the rebound Bernanke hinted that the taper was a possibility, but at some other time.
-
Good news.
-
Bernanke’s prepared remarks for the “testimonial” thing included that “The Fed is
buying $85 billion a month.” Questionable news.
-
As with “austerity, “tapering” will not be voluntary policy.
STOCKS
This page has considered that the rebound out of the mini-panic in lower-grade bonds would run through July. This has accomplished a new high for the S&P, but the negative divergence on RSI Momentum is now a caution.
Help from the rebounding junk-bond market is effectively over. It seems to have reached its best yesterday and is working on an Outside Reversal today.
The next drop spells “history” for the lower-grade bond market–around the world.
Showing great enthusiasm, banks (BKX) continued their rally and have clocked 78.15 on the Weekly RSI. This is the highest RSI since the halcyon days of 1997. Financials have been hot.
Not so hot were the base metal miners (SPTMN) that became very oversold in late June. Enough to prompt a rally and the index has stair-stepped from 662 to 744. It can continue through August.
Overall, stock market action has been working on the end of a four-year bull market. Continue to sell the rallies.
PRECIOUS METALS
Gold has bottomed relative to a number of important items. The following chart shows gold relative to the stock market and lists the condition of other significant comparisons.
The importance is that the gold sector is completing a bear market in real terms as orthodox investment sectors are completing a secular bull market, also in real terms.
The bear since 2011 has virtually taken out the inflation bulls. That was the old paradigm.
The bottom in Precious Metals has been a difficult process and we have been buying the bad days.
Gold stocks can continue the revival through August when they could briefly become vulnerable to the re-discovery of liquidity problems.
After that, we are looking forward to a cyclical bull market, in real terms, that could run for a couple of years.
This will be the new paradigm, last seen in the 1930s.
Gold Stocks Beginning To Outperform The S&P

This was one of the items that would confirm the end of the bear market in Precious Metals
-
The action became remarkably oversold
-
This indicator has reversed.
-
Others that are in a similar reversal:
o Gold Stocks/Gold (Tested reversal)
o Gold/Crude ( A week behind)
o Gold/Base Metals ( Almost there)
o Gold/Grains ( Made the turn)
o Gold/CRB (Basing)
BOB HOYE, INSTITUTIONAL ADVISORS
E-MAIL bobhoye@institutionaladvisors.com
WEBSITE: www.institutionaladvisors.com


After the Federal Reserve ramped up Quantitative Easing (money-printing) to $85 billion back in December, the lack of impact that this has had on U.S. employment is surprisingly limited.
Obviously QE should be beneficial to improving employment, but I think the financial press is beginning to lose sight of the sheer magnitude of QE and the lack of results.
$85 billion a month is about $4 billion for every trading day. Or, about $1 billion during every hour and a half of trading. And, this is still not enough to fix sluggish employment.
In July, the U.S. created 162,000 net new jobs. In historical recoveries, this number is normally around 300,000 a month, and that is without QE, and with normal interest rates in place!
Instead of re-examining the effectiveness of QE, it is more likely that the Federal Reserve will maintain QE in the face of anemic jobs growth. Or, even ramp it up higher.
Eventually a good portion of QE will represent a pure “monetization” of the U.S. Federal debt (much of the money created by QE will never be withdrawn from the economy). This puts the long-term value of the U.S. dollar at risk and continues to increase the potential for commodities denominated in U.S. dollars – gold, oil, etc.
The opinions expressed in this report are the opinions of the author and readers should not assume they reflect the opinions or recommendations of Richardson GMP Limited or its affiliates. Assumptions, opinions and estimates constitute the author’s judgment as of the date of this material and are subject to change without notice. We do not warrant the completeness or accuracy of this material, and it should not be relied upon as such. Before acting on any recommendation, you should consider whether it is suitable for your particular circumstances and, if necessary, seek professional advice. Past performance is not indicative of future results.
Richardson GMP Limited, Member Canadian Investor Protection Fund.
Richardson is a trade-mark of James Richardson & Sons, Limited. GMP is a registered trade-mark of GMP Securities L.P. Both used under license by Richardson GMP Limited.
On its wednesday report, the Fed remained committed to its present bond buying program. The FOMC cited two risks to its “modest” growth outlook: rising mortgage rates and stubbornly low inflation. The Fed’s statement noted that “the Committee recognizes that inflation persistently below its 2 percent objective could pose risks to economic performance, but it anticipates that inflation will move back toward its objective over the medium term.” The Treasury Inflation Protected ETF (TIP) jumped on the statement, firming up recent gains since the low charted in June. Inflation expectations, as gauged by the ratio between the Treasury Inflation Protected ETF (TIP) and iShares Barclays 7-10 year Treasury Bond Fund (IEF), have been trending lower all year, resulting in a rare divergence with equity markets.
The recent rebound in inflation expectations is conducive to strength in the price of Gold, which benefits from a period of seasonal strength between the end of July through to October. Gold finished the session with minor losses, reluctant to trade away from its 50-day moving average line.
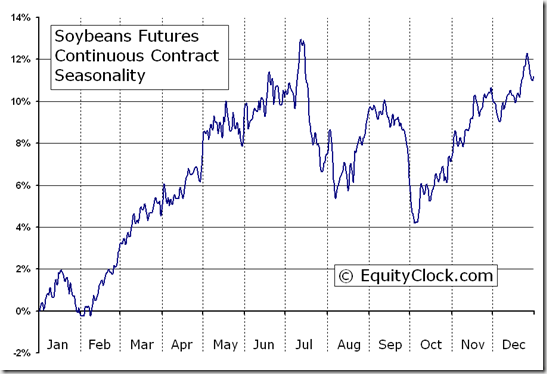
The above chart represents the seasonality for Gold Futures (GC) Continuous Contract for the past 20 years.
- Date range: January 1, 1990 to December 31, 2009
- Type: Commodity Futures – US
- Symbol: GC
Gold Futures Continuous Contract Seasonality
Analysis has revealed that with a buy date of September 13 and a sell date of May 23, investors have benefited from a total return of 183.61% over the last 10 years. This scenario has shown positive results in 9 of those periods.
Conversely, the best return over the maximum number of positive periods reveals a buy date of September 16 and a sell date of May 20, producing a total return over the same 10-year range of 159.82% with positive results in 10 of those periods.
The buy and hold return for the past 10 years was 125.11%.
**Results shown are compounded
How to Invest
UBS E-TRACS CMCI Gold Total Return ETN (Public, NYSE:UBG) – Info – UBS E-TRACS CMCI Gold Total Return is designed to track the performance of the UBS Bloomberg CMCI Gold Total Return, less investor fees. The CMCI Gold TR measures the collateralized returns from a basket of gold futures contracts. The commodity futures contracts are diversified across five constant maturities from three months up to three years. Expense Ratio: 0.30%
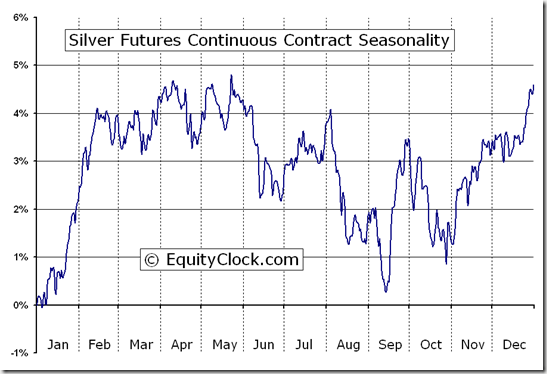
The above chart represents the seasonality for Silver Futures (SI) Continuous Contract for the past 20 years.
- Date range: January 1, 1990 to December 31, 2009
- Type: Commodity Futures – US
- Symbol: SI
Silver Futures Continuous Contract Seasonality
Analysis has revealed that with a buy date of September 16 and a sell date of April 11, investors have benefited from a total return of 314.85% over the last 10 years. This scenario has shown positive results in 7 of those periods.
Conversely, the best return over the maximum number of positive periods reveals a buy date of September 14 and a sell date of September 23, producing a total return over the same 10-year range of 55.36% with positive results in 10 of those periods.
The buy and hold return for the past 10 years was 105.43%.
**Results shown are compounded
How to Invest
UBS E-TRACS CMCI Silver Total Return ETN (Public, NYSE:USV) – Info – UBS E-TRACS CMCI Silver Total Return is designed to track the performance of the UBS Bloomberg CMCI Silver Total Return, less investor fees. The CMCI Silver TR measures the collateralized returns from a basket of silver futures contracts. The commodity futures contracts are diversified across five constant maturities from three months up to three years. Expense Ratio: 0.40%
About Equity Clock
Equity Clock is a division of the Tech Talk Financial Network, a market analysis company that provides technical, fundamental and seasonality analysis on a daily basis via TimingTheMarkets.com andEquityClock.com. Equity Clock’s mission is to identify periods of reoccurring strength among individual equities in the market using methodologies presented by some of the top analysts in the industry, including that of Don Vialoux, author of TimingTheMarkets.com.
Feel free to use any of the content or seasonality studies (charts, timelines, or otherwise) presented as long as a link-back to this site at EquityClock.com is provided.
For further information on indicators used in reports presented on this site, please visit our reference page.

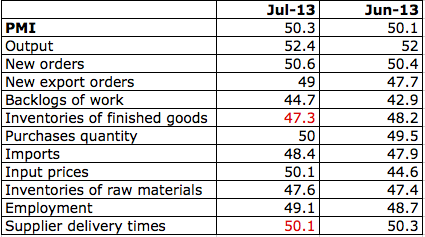
Official Chinese manufacturing PMI climbed to 50.3 in July.
This beat expectations for a decline to 49.8, from 50.1 the previous month.
This will come as a relief to markets as concerns mount over China’s economic slowdown.
By Randall Palmer
OTTAWA (Reuters) – The Canadian economy grew by 0.2 percent in May from April, according to Statistics Canada data on Wednesday, below forecasts and dampening expectations for the second quarter.

-
I know Mike is a very solid investor and respect his opinions very much. So if he says pay attention to this or that - I will.
~ Dale G.
-
I've started managing my own investments so view Michael's site as a one-stop shop from which to get information and perspectives.
~ Dave E.
-
Michael offers easy reading, honest, common sense information that anyone can use in a practical manner.
~ der_al.
-
A sane voice in a scrambled investment world.
~ Ed R.
Inside Edge Pro Contributors

Greg Weldon

Josef Schachter

Tyler Bollhorn

Ryan Irvine

Paul Beattie

Martin Straith

Patrick Ceresna

Mark Leibovit

James Thorne

Victor Adair