Timing & trends

The Six Most Important Economic Data Points To Watch This Week


  • In the wake of our Note on the importance of PMI data, I thought it would be beneficial to point out what I think the six most important data points to be released this week and why 


MONDAY July 29th


With so much of American’s wealth tied up in their homes, today’s release of pending home sales (both month-over-month and year-over year) will be an important indicator of the relative health of the housing market in the US. 

Screen Shot 2013-07-29 at 6.39.55 AM

The fall in the monthly consensus number (-.1% from a previous monthly increase of 6.7%) is believed to be due to increasing mortgage rates in the US. Such a precipitous drop shows how sensitive consumers are to higher rates. The double digit gains on a YOY basis are due to the low rate environment manifested through the Federal Reserve’s near-zero interest rate policy and this is the number analysts are more focused on as it is more indicative of a trend.

Though the housing market in the US has quite a hill to climb to regain its valuations pre-Great Recession (see chart below of the Case-Shiller 20 City Home Price Index), the recent strength in these (and other) housing market numbers has some cautiously optimistic. 

Screen Shot 2013-07-29 at 6.41.23 AM

TUESDAY July 30

The Federal Open Market Committee (FOMC) begins its two day meeting today to debate the state of the US economy and hence, the direction of monetary policy, inflation, and prices. It’s no secret that the FOMC is split amongst the hawks who want to hasten an end to QE and raise rates and the doves, Chairman Bernanke among them, who want to keep rates in the US low for “an extended period”. The results of the two day meeting will be announced on Thursday. The chart below looks much more deflationary than inflationary and this is at the core of the debate at the FOMC. Short-term interest rates are expected to remain unchanged. 

Screen Shot 2013-07-29 at 6.43.49 AM


WEDNESDAY July 31


Two items of economic data of note today, specifically Q2 GDP and the June Chicago Purchasing Managers Index.

I discussed my affinity for PMI data in a Note last week, and with the US PMI data recently showing strength, the Chicago number will be watched to see if this trend can continue. 

Screen Shot 2013-07-29 at 9.31.54 AM

June’s number registered 51.6, down from the previous month, but still indicative of an expanding industrial base. The current forecast number is 54.

As for GDP, 

Screen Shot 2013-07-29 at 9.32.58 AM

the forecast looks somewhat less rosy as overall the US economy continues to “tread water”. The US economy grew at a rate of 1.8% in Q1 and the economy is forecast to grow by 1.2% in Q2 in the wake of recent downward revisions.

THURSDAY August 1


Today, the ISM Manufacturing Index is released and, like the PMI data before it, is forecast to show growth of 51.5 versus 50.9 in June. The ISM index is compiled by discussing a host of factors with purchasing managers from over 300 manufacturing firms in the US. According to Bloomberg, topics discussed include: the general direction of production, new orders, order backlogs, inventories, customer inventories, employment, supplier deliveries, exports, imports, and prices. 

Screen Shot 2013-07-29 at 9.34.56 AM

As a reminder, any reading above 50 is positive and a sign of increasing confidence within the manufacturing sector of the economy.

FRIDAY August 2nd


If the Rose Bowl is the “Grand Daddy” of College Football games, then today’s release of the monthly Initial Jobless Claims is the Grand Daddy of US economic data.

While I have reservations about this number and the unemployment rate in general including how the underemployed are accounted for and the “type”, or quality of job created, the impact that this number has on the financial markets cannot be ignored. I’ve said in the past I put more credence in past month’s claims numbers as they’ve been revised to portray a “truer” employment picture despite the flaws in how this number is calculated.

The unemployment rate is forecast at 7.5% down slightly from 7.6% and the non-farm payrolls are expected to increase by 175,000 down from 195,000 the previous month.

It is generally believed that a jobs number greater than 125,000 net new jobs per month is required to stay ahead of population growth and demographic changes in the US. This, however, is the subject of some debate. While the unemployment rate is still high by historic and structural standards, the job creation in the US economy, coupled with nascent strength in the housing market and manufacturing sector, have many believing in continued strength in the US in the second half of 2013 continuing into 2014.

The key will be the direction of interest rates and the health of the US consumer, as we have indicated before. 

Screen Shot 2013-07-29 at 9.36.25 AM


Screen Shot 2013-07-29 at 9.36.34 AM


The material herein is for informational purposes only and is not intended to and does not constitute the rendering of investment advice or the solicitation of an offer to buy securities. The foregoing discussion contains forward-looking statements within the meaning of the Private Securities Litigation Reform Act of 1995 (The Act). In particular when used in the preceding discussion the words “plan,” confident that, believe, scheduled, expect, or intend to, and similar conditional expressions are intended to identify forward-looking statements subject to the safe harbor created by the ACT. Such statements are subject to certain risks and uncertainties and actual resultscoulddiffermateriallyfromthoseexpressedinanyoftheforwardlookingstatements. Suchrisksanduncertaintiesinclude,butarenotlimitedtofutureevents and financial performance of the company which are inherently uncertain and actual events and / or results may differ materially. In addition we may review investments that are not registered in the U.S. We cannot attest to nor certify the correctness of any information in this note. Please consult your financial advisor and perform your own due diligence before considering any companies mentioned in this informational bulletin. We own no shares in any companies mentioned. 


MORNING NOTES 7/29/2013 


Michael Campbell Interviews Lance Roberts, portfolio manager and founder of Houston TX based StreetTalks Advisors whose practice focuses on capital preservation and conservative risk/reward investing. Lance is also the Chief Editor of the X-Report, a weekly subscriber based-newsletter that covers economic, political and market topics as they relate to the management portfolios.

A daily financial blog, audio and video’s also keep members informed of the day’s events and how it impacts your money.

Michael begins by asking Lance about the influx of liquidity coming from the Federal Reserve. 

{mp3}mtjuly2727hour1{/mp3}


The Greatest Gold Rush

As a general rule, the most successful man in life is the man who has the best information

Here’s four facts I want you to have on your screen before we get going:

  1. Junior resource companies, not major mining companies, own the worlds future mines. Juniors already own, and find more of, what the world’s larger mining companies need to replace reserves and grow their asset base.
  2. Juniors are the ones most adept at finding these future mines.
  3. The gold mining industry needs to discover 90 million ounces of gold every year just to stay even.
  4. The junior exploration sector is presently in the midst of one of the worst financing environments ever experienced by the sector.

Discovery

Despite increased exploration expenditures, a record US$8b in 2011, gold ounce discovery is not keeping up to the rate needed to replace mined ounces. The Metals Economic Group estimates that the 99 significant discoveries (defined as greater than 2 mil oz) found between 1997 and 2011 replaced only 56 percent of the gold mined during that same period.

Costs

Gold ounce discovery is not keeping up, CAPEX and OPEX costs are escalating…

image001

In 2001 and 2002 miners were producing gold for sub-$180 cash costs – the operational cost of the mine divided by the ounces of image003
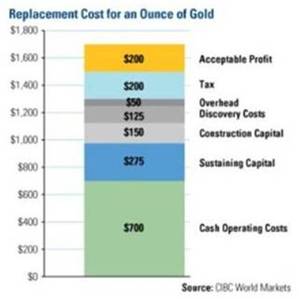
production. By 2005 cash costs had risen 45 percent to US$250. Data from GFMS shows world gold production costs for the first half of 2009 averaged $457/oz. Average cash costs in 2011 were US$657.  A complete breakdown of costs, an all-in cost figure, courtesy of CIBC, shows today’s average cash operating costs pegged at $700 an ounce.

Financing

Below is a chart I found over at The Charleston Voice website – it is the HUI expressed as a percentage of the gold price. By comparing the AMEX Gold Bugs Index (HUI) with the price of gold since 1998 they get a ratio that shows whether money flow is positive or negative for the mining sector. It shows quite clearly that money flows into miners is now very negative.

image005

A Junior exploration company’s place in the food chain is to acquire and explore properties. Their job is to make the discoveries that the mid-tiers and majors takeover and turn into mines.

If exploration could only replace half the mined gold with record expenditures in 2011 and funding for exploration dropped by $9b from June 2011 to June 2012, and dropped drastically again from then till now, what’s in store for the future gold supply with even way less money for exploration today?

Historically, ownership of junior resource companies involved in the search for and development of precious metal deposits have offered the best leverage to rising metal prices – and they will again. Once the bullions all bought and allocated, once the market is setting gold’s price, once everyone knows mining is not going to replace even a small portion of future demand what’s going to happen?

Exactly – the shares in companies with advanced gold and silver projects are going to become very precious indeed.

Companies being considered for investment purposes should have all the following key attributes:

  • Established track record
  • Experienced and competent management teams
  • Established mineral resources
  • Projects in safe and stable jurisdictions of the world
  • Strategically located properties – existing infrastructure
  • Significant upside potential

But

Only you can decide the level of risk you can tolerate and how much patience you have to sit while developments, the story, plays out. It’s my opinion that a good entry point into the junior market would be a nearer term producer. Because these companies are well advanced along the development path a lot of the guesswork about grade, size, costs and metallurgy have been taken out of the equation for us.

These close to production companies have managed to reduce risk and give investors a much higher level of confidence that they will be going mining by achieving certain milestone studies:


  • Preliminary Economic Assessment (PEA) or scoping studies are done to examine potential mining scenarios and economic parameters – A PEA or scoping study is an important milestone for a mineral project, it’s the first step in a company’s economic and technical examination of a proposed mine
  • Preliminary feasibility studies or pre-feasibility studies (PFS) are more detailed than PEA’s and are used to determine whether or not to proceed with a detailed feasibility study. They are also used as a reality check to determine areas within the project that require more attention
  • Feasibility studies (FS) will determine definitively whether or not to proceed with the project. A feasibility study or bankable feasibility provides budget figures for the project and will be the basis for raising capital to build the mine


It’s easier to be patient when you can see the physical progress towards mining, you can see every step being taken down the development path to a mine and profitability. These later development stage companies are not going to be looking for a gold or silver deposit, you won’t be sitting on the edge of your chair waiting for good, or not, assay results. No, this stage company is going to be digging up, in very short order, what’s so much in demand and selling dear – gold and silver. And they will be the first companies to have their share prices move when the freight train rush to buy gold and silver shares slams into the TSX.V.

Fact – junior resource companies, not majors, own the worlds future mines.

Fact – a precious metal company that can get into extremely profitable production today is going to be something very special.

Fact – cash flow is king, any undervalued assets will be ripe for the plucking by those with cash – it’s called merger and acquisition and for those with the cash today everything is for, and on, sale.

It’s this authors opinion that a company heading towards profitable production today is going to be a very good purchase to tuck away in your portfolio.

Northern Vertex Mining Corp. TSX.V – NEE, with its Moss gold/silver project in NW Arizona, is something special. Who out there wouldn’t appreciate owning a piece of a top shelf management team with a strong shareholder base, low share count and the ability to raise money even under difficult market conditions?

But it gets better, add in 70 percent ownership of the Moss gold/silver project:

  • IRR of 118% at $1,500 Au
  • IRR of 88% at $1,300 Au
  • Cash cost of $490 (capital/average annual oz AuEq production $633/oz)
  • Low capital costs – $26 m to build phase II, phased development approach being utilized to reduce pre-development project risk. Pilot Plant Phase I production targeted for Q2 2013. Commercial Operations  Phase II production targeted for Q3 2014
  • High grade, 1.29 gpt AuEq, M+I
  • Low strip ratio, 1.6:1
  • Phase I & II five year mine life, 5000tpd, 42,000 ozs AuEq recovered per year
  • Excellent exploration potential exists to add to life of mine, the 5 year mine life is for Phase I & II only. Phase III could add an additional 5 to 7 years of mine life

Screen Shot 2013-07-26 at 7.26.35 AM

There are two truly unique things about Northern Vertex and its Moss Project; firstly the ability – because of low all in costs per mined ounce – to convert ounces in the ground into CASH when other projects are being put on the shelf, and secondly the timing of production. When you think of project cost escalations, delays and outright project cancellation, the onslaught of resource nationalization, global out-of-control monetary policy and the coming supply/demand imbalance for gold and silver you have to realize Moss’s production timeline couldn’t be better or more opportune for investors.

Conclusion

Northern Vertex is truly an unknown story that is moving at light speed, on time and on budget. What they have accomplished in just over two years speaks well of this experienced committed management team and bodes well for investors future with NEE.

The world’s gold vaults are being emptied, ahead of the herd investors have already started accumulating the best junior gold stocks – the greatest gold rush of them all has quietly started.

The stealthy start of the ‘Greatest Gold Rush’ and at least one quality junior, soon to be miner of gold and silver, should be on all our radar screens. Are they on yours?

If not, maybe they should be.

Richard (Rick) Mills

Richard is the owner of Aheadoftheherd.com and invests in the junior resource/bio-tech sectors. His articles have been published on over 400 websites, including:

WallStreetJournal, USAToday, NationalPost, Lewrockwell, MontrealGazette, VancouverSun, CBSnews, HuffingtonPost, Londonthenews, Wealthwire, CalgaryHerald, Forbes, Dallasnews, SGTreport, Vantagewire, Indiatimes, ninemsn, ibtimes, businessweek.com, moneytalks and the Association of Mining Analysts.

If you’re interested in learning more about the junior resource and bio-med sectors, and quality individual company’s within these sectors, please come and visit us atwww.aheadoftheherd.com

If you are interested in advertising on Richard’s site please contact him for more information,rick@aheadoftheherd.com

***

Legal Notice / Disclaimer

This document is not and should not be construed as an offer to sell or the solicitation of an offer to purchase or subscribe for any investment.

Richard Mills has based this document on information obtained from sources he believes to be reliable but which has not been independently verified.

Richard Mills makes no guarantee, representation or warranty and accepts no responsibility or liability as to its accuracy or completeness. Expressions of opinion are those of Richard Mills only and are subject to change without notice. Richard Mills assumes no warranty, liability or guarantee for the current relevance, correctness or completeness of any information provided within this Report and will not be held liable for the consequence of reliance upon any opinion or statement contained herein or any omission.

Furthermore, I, Richard Mills, assume no liability for any direct or indirect loss or damage or, in particular, for lost profit, which you may incur as a result of the use and existence of the information provided within this Report.

Richard does not own shares of Northern Vertex Mining Corp. TSX.V – NEE

Northern Vertex TSX.V – NEE is a paid advertiser on Richard’s site, aheadofthe


A few reasons to cover the gold shorts

The U.S. Comex gold futures (COMEX:GCU13) surged 3.33% on Monday, the highest percentage change since June 29, 2012. On Wednesday morning in Asia, the gold futures rose further and traded above $1,340. The Dollar Index fell about 0.8% this week to 81.945 on Tuesday. The S&P 500 index was flat in the past two days while the Euro Stoxx 50 Index rose 0.25%.

A Floor to China’s Growth

The gold market has been adjusting to the expectations of the Fed’s tapering. A Bloomberg poll shows that 50% of those surveyed expects that the U.S. Fed will reduce its bond purchases to $65 billion a month in September. The market also takes comfort from the news that the Chinese government will put a floor of its GDP growth at 7% because China needs to become a moderately wealthy society by 2020. The July flash China PMI came in weaker at 47.7 compared to an expected 48.2. China has also started to liberalize its interest rates by removing the lower limit of the financial institutions’ lending rates. The next important step in China’s structural reforms will be the liberalization of the deposit rates.

Support for Gold Prices

The surge in gold has been accompanied by a weaker U.S. dollar. In June, the existing home sales in the U.S. fell to 5.08 million on an annualized basis compared to the median forecast of 5.26 million and 5.14 million in May. On July 22, the gold futures closed above its 50-day moving average for the first time in eight months. Physical demand has been robust in Asia as evidenced by the persistent premiums. The dwindling Comex gold inventory has raised concerns of default by the Comex. Gold traders are increasingly covering their shorts as physical gold delivery is getting a little harder each day. The CFTC data shows that during the week of July 16, the net short positions in gold by speculators fell 10.82% to 121,305 contracts while the net combined positions surged a whopping 47.72%. On the negative front, India has further restricted gold imports by requiring the importers to set aside 20% at the customs warehouses for re-exports. The gold will be made available to jewelers and bullion dealers only. The All India Gems and Jewellery Trade Federation expects the gold imports to drop 63% in the second half of this year, further pressuring gold prices.

Gold scrap supply to drop up to 25% as sales decline

…..read it all HERE


About the Author

AustinKiddle-resize-100x100Austin Kiddle

Austin Kiddle is a director of the London-based gold broker Sharps Pixley Ltd.


Did Gold Start to Respond to the U.S. Dollar Price Moves?

Yesterday, gold climbed up to over $1,347 per ounce after the U.S. dollar slipped against other currencies. The American currency dropped to a one-month low slightly below 82 after extending a broad decline for a third session.  Investors are probably wondering if it will drop any further.

The recent price action suggests that market players are still long the dollar, which could weigh on the greenback, said Hiroshi Maeba, head of FX trading Japan for UBS in Tokyo.

What if he is right?  Will the buyers manage to push the USD Index higher? What impact could such action have on the gold’s chart? Could it trigger a correction?

Today, gold slipped as investors took profits after a sharp four-day rally which pushed prices up to a one-month top in the previous session. Can the yellow metal climb higher in the near term? Is the final top already in? Can we find any guidance in the charts?

In today’s essay we examine the US Dollar Index once again and the gold chart from the perspective of the Australian dollar to see if there’s anything on the horizon that could drive gold prices higher or lower shortly. We’ll start with the USD Index very long-term chart to put this gold chart into perspective (charts courtesy by http://stockcharts.com.)

radomski july242013 1

As we wrote in our essay on gold, stocks and the dollar on July 22,2013:

The situation in the long-term chart hasn’t changed recently. The breakout above the declining support/resistance line (currently close to 79) was still not invalidated.

From this perspective the situation remains bullish.

Now, let’s zoom in on our picture of the USD Index and see the medium-term chart.

radomski july242013 2

When we take a look at the above chart we can see that the USD Index has declined once again. Despite this fact, the recent declines haven’t taken the index below 81, so the medium-term uptrend is not threatened. The reason for this is that the medium-term support line hasn‘t been broken, in fact, it hasn’t even been reached.

From this perspective, the situation remains bullish, and we can expect the dollar to strengthen further in the coming weeks.

Now, let’s check to see if the short-time outlook is also bullish.

radomski july242013 3

It is. From the short-term perspective, we see that earlier this week, the U. S. dollar dropped slightly below the 61.8% Fibonacci retracement level based on the June – July rally. It also declined to slightly above 82 on an intra-day basis on Tuesday. The move below this level is not confirmed, however.

Moreover, when we factor in the Fibonacci price retracement based on the entire February – July rally, we see that the USD Index moved to the 50% Fibonacci retracement level which is at the 82 level. In fact, the existence of this level might explain why dollar moved slightly below the short-term 61.8% retracement.

All in all, from the price perspective, it still seems that a rally will follow.

The most important factor on the above chart supporting the bullish case is the cyclical turning point which is in play right now. It’s quite possible that we will see its impact on the dollar this week, and this can lead to a bigger pullback. This provides us with strong bullish implications from this perspective.

Combining both perspectives – a move to the upside is still likely to be seen. If the buyers manage to push the USD Index higher, we might see an increase to the level of the June top or even to the rising resistance line based on the May high and June peak before another pause is seen. Taking a look at the long-term charts, however, we see that the next significant resistance is currently close to 86 (86.4) – the declining red line in the chart.

Consequently, from the short-term perspective, we see that the recent decline still seems to be a counter-trend bounce. When we factor in the cyclical turning point we could see another rally soon. Taking a look at medium- and long-term charts, both outlooks for the dollar remain bullish. This is a bearish piece of information for metals and miners.

To make the U.S. dollar perspective complete, let’s analyze the impact of the American currency upon the precious metals sector. Let’s take a look at the Correlation Matrix (namely: gold correlations and silver correlations).

radomski july242013 4

We have seen negative correlation between the metals and the USD Index. Taking the short-term, bullish outlook for the USD Index into account, the implications for gold, silver, and the mining stocks are clearly bearish at this time.

Once we know the current situation in the U.S currency and its impact upon the metals, let’s turn to our final chart. Today, we would like to present you an interesting chart which may provides important clues about further gold’s price movements: the chart of gold from the perspective of the Australian dollar.

Click HERE or on chart for larger image

5

On the above chart, we see that the price of gold in Australian dollars has moved up and almost reached the declining resistance line. At this point, it’s worth mentioning the previous local top. We saw a pullback to this resistance line in June, but the buyers didn’t manage to push gold above it. This resulted in strong declines which took the price all the way down to the April bottom area. If we see similar price action here, gold priced in Australian dollars will likely decline once again. Such a triple-bottom, in this case, would likely mean a breakdown below the previous lows in the price of gold seen from our regular USD perspective, similar to what was seen in June.

Summing up, the situation in the USD Index is particularly interesting this week. Prices are close to the final Fibonacci retracement level and right at the cyclical turning point (and following a sharp decline). A rally seems quite likely in the cards for the short term, and this will probably have a very negative impact on the precious metals.

Thank you for reading. Have a great and profitable week!

Przemyslaw Radomski, CFA

Founder, Editor-in-chief

Gold Investment & Silver Investment Website – SunshineProfits.com

* * * * *

Disclaimer

All essays, research and information found above represent analyses and opinions of Przemyslaw Radomski, CFA and Sunshine Profits’ associates only. As such, it may prove wrong and be a subject to change without notice. Opinions and analyses were based on data available to authors of respective essays at the time of writing. Although the information provided above is based on careful research and sources that are believed to be accurate, Przemyslaw Radomski, CFA and his associates do not guarantee the accuracy or thoroughness of the data or information reported. The opinions published above are neither an offer nor a recommendation to purchase or sell any securities. Mr. Radomski is not a Registered Securities Advisor. By reading Przemyslaw Radomski’s, CFA reports you fully agree that he will not be held responsible or liable for any decisions you make regarding any information provided in these reports. Investing, trading and speculation in any financial markets may involve high risk of loss. Przemyslaw Radomski, CFA, Sunshine Profits’ employees and affiliates as well as members of their families may have a short or long position in any securities, including those mentioned in any of the reports or essays, and may make additional purchases and/or sales of those securities without notice.