
Timing & trends
STOCKS: There wasn’t a lot of news to account for the rally on Tuesday. Some are suggesting that earnings will be better than expected. There was a release of funds to Greece and Chinese inflation was in line.
It’s kind of hard to imagine investors saying, “Hey Chinese inflation is not too bad. Let’s buy”. I think this is all part of a rise from a very oversold condition as we’ve been pointing out for the past couple of weeks.
GOLD: Gold was up $12. This still doesn’t break the pattern of declining tops that has dominated the yellow metal for so long.
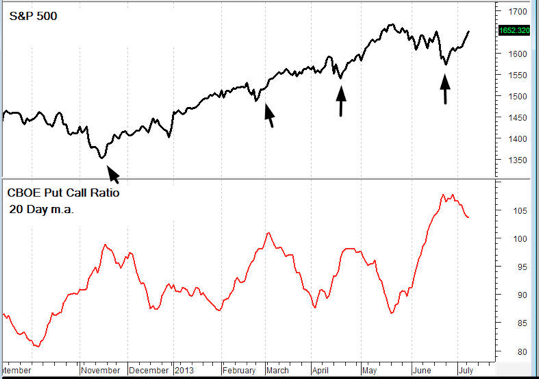
CHART: I hate to keep showing essentially the same charts, but right now the message is pretty convincing and we need to remember it. There is a lot of bearishness right now. The current 20 day moving average of the CBOE put call ratio is still above the levels of the last three trading bottoms. This tells us that the rally has further to go on the upside. This message is much more important than Chinese inflation.
NEWS AND FUNDAMENTALS: There were no important economic releases on Tuesday. On Wednesday we get the release of the FOMC minutes and a speech by Bernanke.
Michael Campbell’s interview of Timer’s Digest #1 Market Timer Stephen Todd about the markets on July 6th Money Talks. Michael starts out at the 3:25 mark asking Stephen about his perspective on the overall Stock Market, followed by Gold, Silver, Currencies, Interest rates and more:
{mp3}mtjuly6hour1{/mp3}
RANKED # 1 BY TIMER DIGEST
Timer Digest of Greenwich, CT monitors and ranks over 100 of the nation’s best known stock market advisory services.
Once per year in January, Timer Digest publishes the rankings of all services monitored for multiple time frames.
For the years 2003, 2004 and 2005, The Todd Market Forecast was rated # 1 for the preceding ten years. For the year 2006, we slipped to # 3 and in 2007, we were ranked # 5.
Our bond timing was rated # 1 for the years 1997, 2007 and 2008.
Gold timing was rated # 1 for 1997 and # 2 for 2006. Late word! We were rated # 1 for 2011.
We were # 1 in long term stock market timing for the years 1998 and 2004 and # 4 in 2010.
To subscribe go to Contact Us.

- For decades, the American “paper gold” market (the COMEX) has been the primary market for determining the POYG (price of your gold).
- Most analysts in the gold community believe that demand for physical gold will somehow overwhelm the COMEX, and “liberate” the POYG. They predict vastly higher prices are coming, when that happens.
- I disagree. I believe paper gold markets will continue to be the primary price setting mechanism for gold, but Asian paper gold markets will be where most of the action is.
- Like the COMEX, the Shanghai futures exchange (SHFE) is a paper gold market. Yesterday marked the beginning of extended trading hours (night trading) for the SHFE, and volume was superb.
- The average trading volume during the day is about 90,000 contracts. The first night session saw more than 220,000 contracts change hands.
- Slowly, Shanghai’s paper gold market should begin to rival the COMEX. That’s excellent news for bullish gold investors in the West!
- Public investors in Asia are generally “pro-gold”, while Westerners are generally “pro-fiat”. Institutional paper gold investors in Asia are more reluctant to sell into price declines than their Western counterparts, and they can be eager buyers of size!
- Also, when analysing the gold price, the market actions of Japanese investors should not be overlooked. “Assets held by Mitsubishi UFJ’s gold ETF reached 24.58 billion yen ($243 million) on July 5, compared with 25.86 billion yen at the end of last year, Hoshi said. About half of the assets are held by individual investors, with the rest owned by financial institutions, pension funds and corporations and foreigners, Hoshi said. Trading value in Mitsubishi UFJ Trust’s gold ETF on the Tokyo Stock Exchange amounted to 7.23 billion yen in May, becoming the most-traded commodity fund listed in Japan, according to data compiled by the bank.”–Bloomberg News, July 9, 2013.
- The rise of Eastern paper gold markets will be a process, rather than a one-time event, so patience is required. Japan’s paper gold markets are still very small, but they are gaining popularity. The trend is definitely your friend.
- “SPDR Gold Trust, the world’s largest gold ETF, said its holdings fell 1.56 percent to 946.96 tonnes on Monday – the lowest since February 2009.” –Reuters News, July 9, 2013.
- SPDR is a Western gold ETF. In the big picture, the West continues to bail out of gold, and the East is an eager buyer of all that is offered.
- The banks are also substantial buyers, as shown by recent COT reports. To view the latest one, please click here now .
- You can see that the commercial traders’ long position is growing nicely. The gold community is not alone; powerful banks and many types of Asian entities are buyers now.
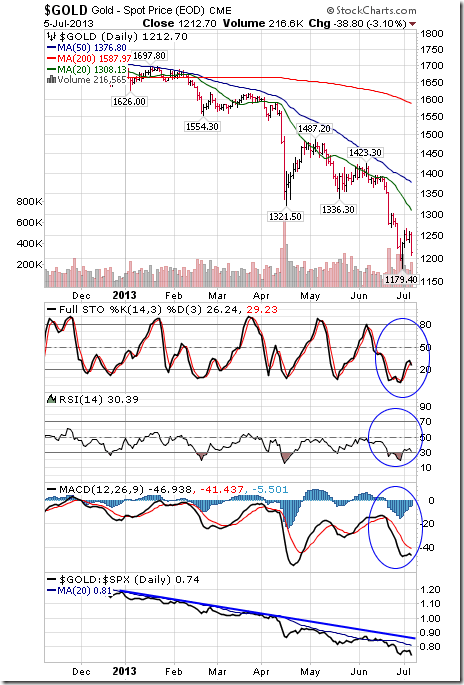
- Please click here now . That’s the hourly bars chart for gold. It shows the trading on the COMEX.
- It will be interesting to see if the SHFE night session traders can put a bit of a scare into COMEX pit traders this week.
- Regardless, my suggestion to both Eastern and Western gold traders is to be a light seller in the $1255 – $1275 range, and a buyer at $1175 – $1225.
- Please click here now . That’s the daily gold chart. No significant rally has occurred yet, but a number of bank analysts have suggested the decline is nearly finished.
- Note the position of my stokeillator. A buy signal is in play, and I don’t like to bet against it. Longer term investors should book some profits in the $1280 – $1320 zone, if the price gets there. Hold the rest as a core position.
- Chinese inflation is apparently on the rise again, as are Chinese gold imports from Hong Kong.
- Please click here now . You are looking at the GDX daily chart. It’s an appalling picture, but I’m a buyer anyways. From a tactical standpoint, I recommend adding short positions or put options with every purchase of gold stock, to maintain some semblance of emotional sanity.
- One reason that I’m now focused on gold stocks more than bullion, is because I believe that gold stocks outperform in an inflationary environment. Since 2008, deflation has been the main investment theme, but I think there is a transition to inflation, in play now.
- Also, there’s a lot of talk about owning gold bullion as a “growth with safety”play. I believe in “safety first”, not “safety after I’ve blown up in gold stocks”. Gold bullion is arguably the safest asset in the world, so it should be the first item on every investor’s buy list, not one that is bought in hindsight, after a portfolio wipeout occurs. It’s too late to transition to bullion from gold stocks now, and it’s the wrong play, in my professional opinion.
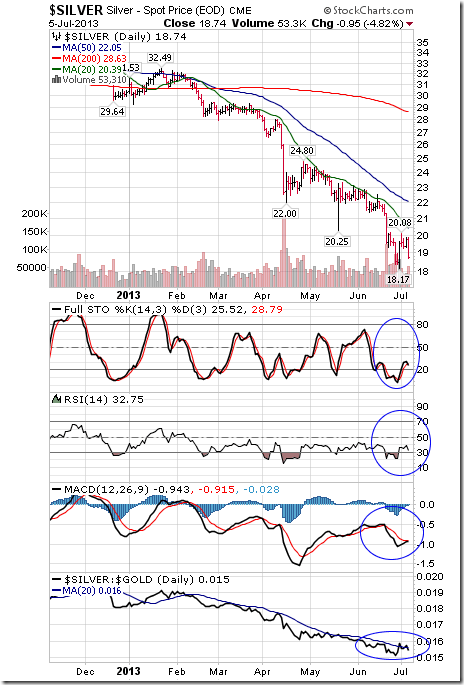
- Silver investors should click here now . That’s the daily chart for silver. I prefer to own silver stocks, rather than bullion. Buyers of silver stocks should already own silver bullion, as your “safety first” play. The red supply line on this chart is a pesky one. The stokeillator is flashing a buy signal, but the silver price still can’t break above that annoying trend line. Patience is the virtue that is required here.
- Please click here now . That’s the daily chart of SIL-NYSE, which is a silver stocks ETF. I own it, and I want to own a lot more of it. Will you join me today, in a small way, and show the East… how the West was really won? Hi, ho, silver!
Jul 9, 2013
Stewart Thomson
Graceland Updates
website: www.gracelandupdates.com
email for questions: stewart@gracelandupdates.com
email to request the free reports: freereports@gracelandupdates.com
 “Mark Twain said the definition of a gold mine is ‘a hole in the ground with a liar standing at the top of the hole’ because there’s just so many of them. Somebody once did a study and I think he determined that more money has been lost in gold mining shares than any other industry in America including airlines and railroads at one time.” – Jim Rogers 12:04 pm July 8th/2013
Here are Jim’s comments on Gold in the last 24hours:
Jim Rogers Destroys The Last Argument Of The Gold Bugs
Jim Rogers correctly predicted gold would fall to $1,200; now he thinks it could go as low as $900
Gold correction is over, suggests Deutsche Bank, but Jim Rogers disagrees
Gold Mining Stocks: Many Other Easy Ways For People To Buy Gold
Jim Rogers Warns “We’re All Going To Suffer From This Crazy, Crazy Money Printing”
“We’re getting to that point where either one of two things are going to happen; either central banks are going to stop all this [money printing], or the market is going to force them to stop it. It looks like we may be having a juncture of both… where the Fed is getting worried… and at the same time, the market is jumping in and saying, ‘Yes, it’s insane what you’re doing, and this has to end.’ And if it’s not ending now, it’s going to end sometime in the next year, because this cannot go on – it’s too insane.“
“There are a lot of leveraged players who are now being forced to sell [gold]. Usually when you have this kind of forced liquidation, you’re getting closer to a bottom, maybe not the final bottom, but certainly close to a bottom.”
The U.S. employment report on Friday helped to give a boost to world equity markets and most sectors. However, the employment report also brought concerns including higher interest rates, higher energy prices (crude oil, heating oil, gasoline) and a higher U.S. Dollar. Short term strength is not sustainable, particularly in front of mixed second quarter earnings reports and mixed third quarter guidance. Preferred strategy is to take advantage of short term strength in equity markets to take trading profits.
Selected sectors with favourable seasonality in the summer time need to be watched for entry points if they show signs of base building. Potential sectors include gold, energy and biotech. All already are showing positive strength relative to the S&P 500 Index.
Gold fell $19.40 per ounce (1.23%) last week. Trend remains down. Gold remains below its 20, 50 and 200 day moving averages. Strength relative to the S&P 500 Index remained at 0.0 out of 3.0. Short term momentum indicators are trying to recover from oversold levels.
100 oz. Gold Futures Continuous Contract Seasonality
Analysis has revealed that with a buy date of September 13 and a sell date of May 23, investors have benefited from a total return of 128.74% over the last 4 years. This scenario has shown positive results in 4 of those periods.
The buy and hold return for the past 4 years was 87.94%.
Silver lost another $0.82 (4.19%) last week. Trend remains up. Silver remains below its 20, 50 and 200 day moving averages. Strength relative to the S&P 500 Index and Gold remains negative. Technical score remains at 0.0 out of 3.0. Short term momentum indicators are trying to recover from oversold levels.
Silver Futures Continuous Contract Seasonality
Analysis has revealed that with a buy date of September 16 and a sell date of May 11, investors have benefited from a total return of 251.41% over the last 4 years. This scenario has shown positive results in 4 of those periods.
The buy and hold return for the past 4 years was 79.27%.
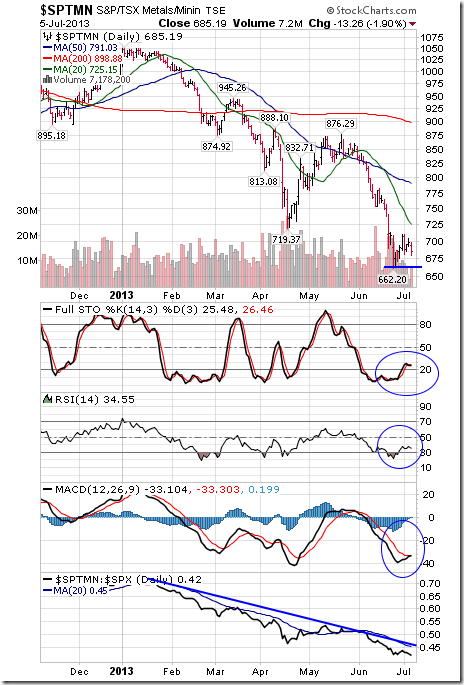
The TSX Metals & Mining Index fell another 20.37 points (2.89%) last week. Trend remains down. The Index remains below its 20, 50 and 200 day moving averages. Strength relative to the S&P 500 Index remains negative. Technical score remains at 0.0 out of 3.0. Short term momentum indicators are trying to recover from oversold levels.
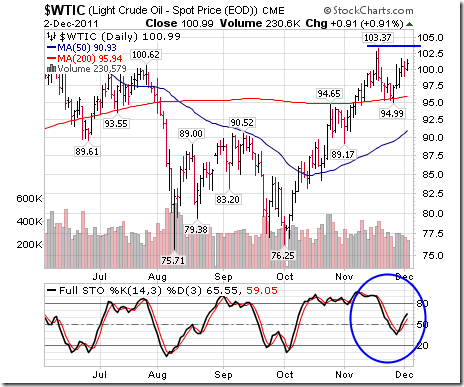
Crude Oil gained $6.63 per barrel (6.86%) last week despite strength in the U.S. Dollar. Intermediate uptrend was confirmed on a move above $100.42 to reach a 15 month high. Crude remains above its 20, 50 and 200 day moving averages. Strength relative to the S&P 500 Index remains positive. Technical score remains at 3.0 out of 3.0. Short term momentum indicators are overbought, but have yet to show signs of peaking.
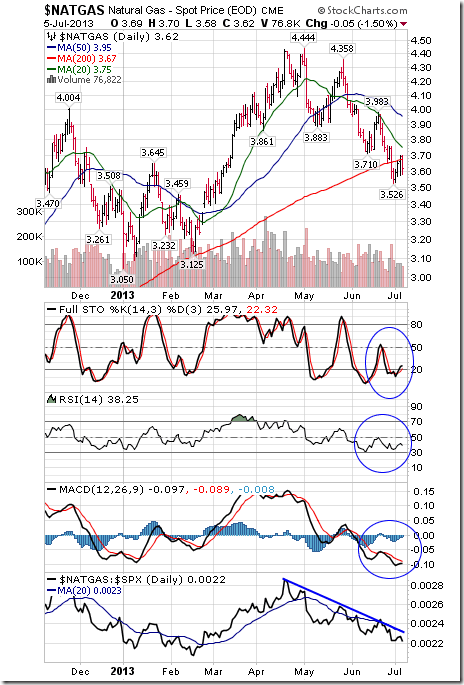
Natural Gas added $0.04 (1.12%) last week. Trend remains down. Gas remains below its 20, 50 and 200 day moving averages. Strength relative to the S&P 500 Index remains negative. Technical score remains at 0.0 out of 3.0. Short term momentum indicators are oversold.
…….so many more charts and commentary at Don Vialoux’s Timing the Market HERE
……seasonality at EquityClock including the Stock Market Outlook for July 8th HERE

INSTITUTIONAL ADVISORS
SATURDAY, JULY 6, 2013
BOB HOYE PUBLISHED BY INSTITUTIONAL ADVISORS
The following is part of Pivotal Events that was published for our subscribers June 27, 2013.
Signs Of The Times
“Detroit Recovery Plan Threatens Muni-market Underpinnings”
“Plan to suspend payments on $2 billion of Detroit’s debt threatens basic tenet of the $3.7 trillion municipal market: that states and cities will raise taxes as high as needed to avoid default.”
– Bloomberg, June 16
The problem with too many cities and counties is that unions have been using monopolistic powers to rip off the taxpayer. City Hall will reduce the numbers of firefighters and police in order to keep extortionate pension plans going. The ordinary citizen is expected to service such demands without enjoying the benefits. Or should they be called privileges or prerogatives?
The ordinary citizen will discover the power of “No!” along with pending default.
“Lauren has boosted prices for her wedding-planning services by about 25% since 2009 as the economic expansion puts Americans in the mood for bigger parties and fancier locations.”
– Bloomberg, June 17
We have used it before:
Like civilizations, bull markets are born stoic and die epicurean.
“China’s worst cash crunch in at least seven years is an indicator of shadow lending gone awry.”
– Bloomberg, June 18
“A more prudent approach would have been to wait for tangible signs that the economy was strengthening.” St. Louis Fed on the story about “tapering” the buying program.
– Bloomberg, June 21
*****
Perspective
Once again policymakers are caught between a crock and hard place. How do they continue the image of “being in control” when Mother Nature imposed a mini-panic? They talk about “Taper”.
The mini-panic appeared almost everywhere, including China.
Did the Fed research department know what can happen to a speculative surge in credit markets in the not-so-merry month of May?
It is doubtful that something as simple as old market-lore is grasped by the suits at the top. The establishment still really believes that the Fed is in charge.
Back in the 60s and 70s a bust follow a boom and on the recession the story would be that the Fed induced the recession to bring inflation down. That meant CPI inflation, not inflation in financial assets.
Absolute nonsense.
The 3 to 4-year business cycle has been well-documented back to the 1500s. It comes and goes as it pleases. When it is on the up interventionists look good and, inevitably, when it is down they look bad.
Variation on the shorter term also includes the cycle for share certificates and credit instruments. And when it is time for a significant change it is signaled by the credit markets.
By the last week in May we described the sell-off in bonds as the “Crack of Doom”. Monday’s Disorderly Credit Markets noted that initial slump had become measurably
overdone. A period of relief would follow.
This seems on the path from excitement in April, reversal in May to heavy liquidation in the fall.
In the 1998 (LTCM) example, the main sell-off in lower-grade bonds began in that fateful August.
In the 1997 “Asian Crisis” liquidity problems in Thailand appeared on July 1st. As it rippled out around the world New York corporate bond traders believed the official line that the problem was “contained” and stayed long.
It hit the US corporate market like a freight train in that September.
Global credit markets have recorded a profound change and it has caught most traders, investors and central banks offside. Probably to an unprecedented degree.
The action could be volatile over the next six weeks or so, but as summer progresses more and more investors will become aware of the consequences of reckless policymaking. Not to overlook the implacable nature of the credit cycle.
Stock Markets
Senior indexes in New York were the last to be included in the big Rounding Top pattern. The S&P set its high at 1687 on May 22nd and the “test” made it to 1664 and then took out the previous low. Taking out 1560 will extend the downtrend. This could take a number of weeks.
Action in the senior indexes seems to be completing a cyclical bull market.
China and Hong Kong set tops early in the year and have been hit very hard over the past four weeks.
This seems to be extending their cyclical bear.
Over in the traditional cyclicals, Base Metal Miners (SPTMN) have extended the bear market that began in early 2011 at 1600. The last key low was 719 set in April. Monday’s low was 662 with the Weekly RSI down to 27. This seems low enough to prompt a brief rally.
Financial markets have been perilous with central bankers pushing radical “stimulus” that seems to hook up when the market wants to go up. This financial historian is awe-struck by the audacity of policymakers. The audacity lies in imagining that there is such a thing as a national economy and that, because it is national, it can be managed.
Then after decades of accommodation, markets brewed up into a series of bubbles. The private sector has a long history of accomplishing great speculations on its own and created a Great Bubble that climaxed in 2007.
After all of the theorizing and editorials about Fed policy when it was time another 1929, or 1873 it was accomplished in 2007. A typical crash was also accomplished. The first business expansion out of the crash has been typically week. This has been accompanied by a favourable credit cycle that exhausted itself in May.
What has aggressive to belligerent central banking accomplished? It has not materially changed the path of financial history from a Great Bubble to a Great Contraction. What is has done is exaggerate speculative furies when Mother Nature allowed it. She also decides what will become the focus of speculation.
Since last fall this has been in credit instruments and the action became excessive in April and reversed – dramatically – in May.
Typically, this pattern for the curve (charts follow) and spreads sets up forced liquidation in the fall. This will include most classes of stocks.
Based upon the brief recovery in the credit markets the improvement in the general stock market could run well into July.
Link to June 28, 2013 ‘Bob and Phil Show’ on TalkDigitalNetwork.com:
http://talkdigitalnetwork.com/2013/06/doldrum-alert/
BOB HOYE, INSTITUTIONAL ADVISORS
E-MAIL bhoye.institutionaladvisors@telus.net
WEBSITE: www.institutionaladvisors.com
Treasury Yield Curve
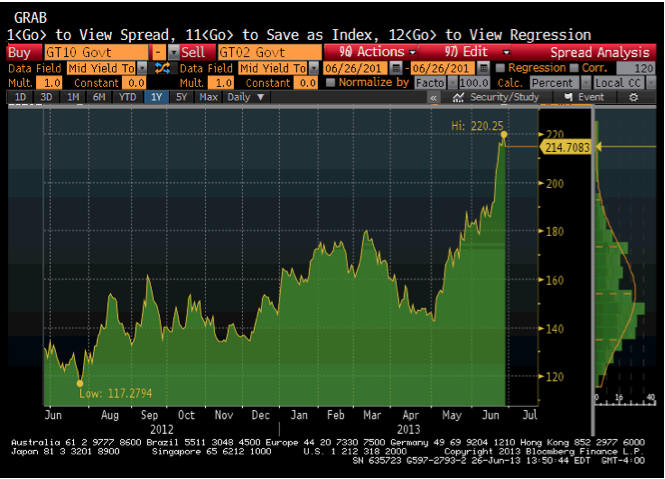
- Typically intense speculation in credit markets ends with a reversal in the curve to steepening.
- In May-June 2007 the curve was likely to reverse to steepening, and it did.
- Something similar was likely for this time this year.
- The breakout was accomplished at 180 bps at the end of May.
- The move since is impressive.
- In ordinary business conditions, a steepening curve enhances banking spreads.
- In the face of speculative financial markets the reversal is a “Sell” signal for commercial banks.
- Central banks are not traded on any market.
- Pity.
Treasury Yield Curve
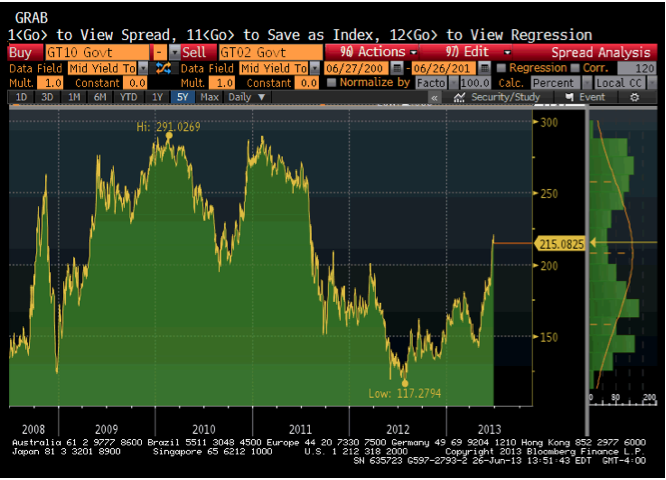
- Shows the action in 2008.
- The “breakout” occurred in that fateful June.
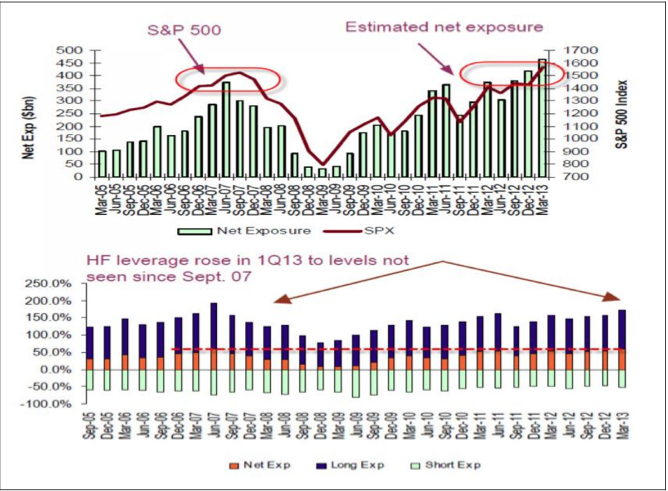
Hedge Fund Leverage
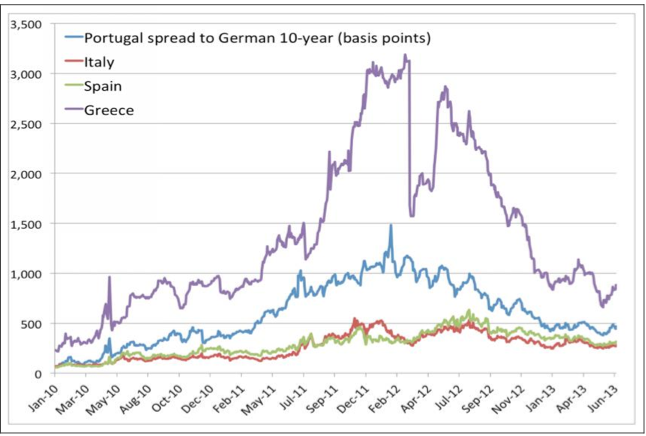
European Bond Spreads
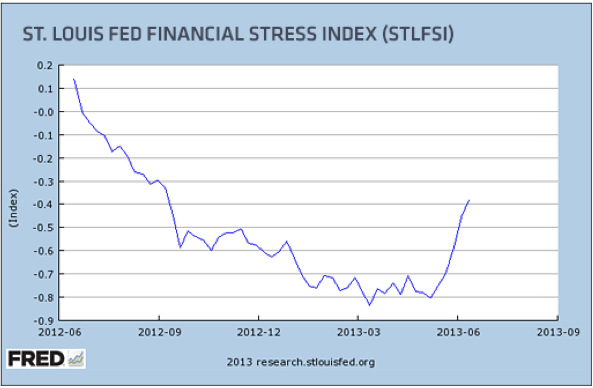
Stress Index

-
I know Mike is a very solid investor and respect his opinions very much. So if he says pay attention to this or that - I will.
~ Dale G.
-
I've started managing my own investments so view Michael's site as a one-stop shop from which to get information and perspectives.
~ Dave E.
-
Michael offers easy reading, honest, common sense information that anyone can use in a practical manner.
~ der_al.
-
A sane voice in a scrambled investment world.
~ Ed R.
Inside Edge Pro Contributors

Greg Weldon

Josef Schachter

Tyler Bollhorn

Ryan Irvine

Paul Beattie

Martin Straith

Patrick Ceresna

Mark Leibovit

James Thorne

Victor Adair