Timing & trends

Fed Official States: Bond Rally Over/Kaput /Fini

“This is the end of a 30-year rally”

Screen shot 2013-06-06 at 11.21.19 PMIn a speech to Toronto reporters tuesday,  Federal Reserve Bank of Dallas President Richard Fisher did something surprising when he actually declared a market rally over! 

His agressive warnings continued when he stated that the current Fed’s $85-billion-a-month bond buying program risks:

“debasement” of the dollar 

high inflation

“the ruination of our economy and lifestyle”

As for describing the effectiveness of the Fed’s program, Fisher pulled no punches:

the Fed is at best pushing on a string and at worst building up kindling for speculation and eventually, a massive shipboard fire of inflation” 

Fisher has repeatedly said the Fed’s current QE3 quantitative easing has done little to boost the economy and could do it harm. Fisher is not alone in his opposition to the Fed’s QE3 bond-buying program either. It is gaining some other opponents recently within the Fed:

Last week the very highly regarded Paul Volcker, former Fed chairman from 1979 to 1987, sounded a warning on QE3, saying that central banks are often too late in removing stimulus.

San Francisco Fed President John Williams said he is open to cutting the central bank’s bond-buying program over coming months. He joined two other regional Fed presidents – the Philadelphia Fed’s Charles Plosser and the Richmond Fed’s Jeffrey Lacker – who have also called for phasing out the Fed’s monthly purchases of mortgage-backed securities .

While Fed chairman Ben Bernanke has said he’s open to the idea of reducing bond purchases, he first needs to see additional signs of a stronger economy. One indicator of that health will come out this Friday when the federal government releases its May employment and unemployment data.

Ed Note: Fisher is not a voting member of the Fed’s policy-making committee this year.


$10,000 Gold & Worthy Reads

I normally find the calls for $5,000, $10,000 and higher gold mostly pipe dreams but this interview paints a very sound and reasonable case for $10,000. If he’s only a quarter right ($2,500), I won’t hold the rest against him-lol

Read

While I was away and spending most of my time on my knees praying and begging for forgiveness from my wife, family, friends and readers, I did see some worthy articles worth posting here:

And Eric Coffin encouraged me to offer my readers a free copy of a special report he issued. You can obtain it here

Ed Note: Peter’s book can be bought by clicking on the image:

Unknown


WHAT THE HECK IS GOING ON….

……ILLUSTRATED BY THESE 51 REMARKABLE CHARTS:

Jeff Gundlach Answers what in the World is going on in this Fantastic New Presentation.

“Something happened in the middle of May,” said investing god Jeff Gundlach as he began his latest webcast on the state of the global markets and the economy.

He was referring to how global interest rates quietly rallied and how the Japanese stock market fell spectacularly.

He notes that the magnitude of the interest rate rally isn’t unusual.  Having said that, Gundlach believes rates will stay low thanks to a “put” by the Federal Reserve. Should rates rise, Gundlach believes the Fed would actually expand quantitative easing. This is because high interest rates would put too much pressure on the economy, and it would cause Federal interest expenses to become too onerous.

“I certainly think the Fed is going to reduce quantitative easing,” he said. But he attributes the reduction to the shrinking Federal deficit.

“I’m starting to like long-term Treasuries,” said Gundlach as he predicted the 10-year Treasury yield would end the year at 1.7%.

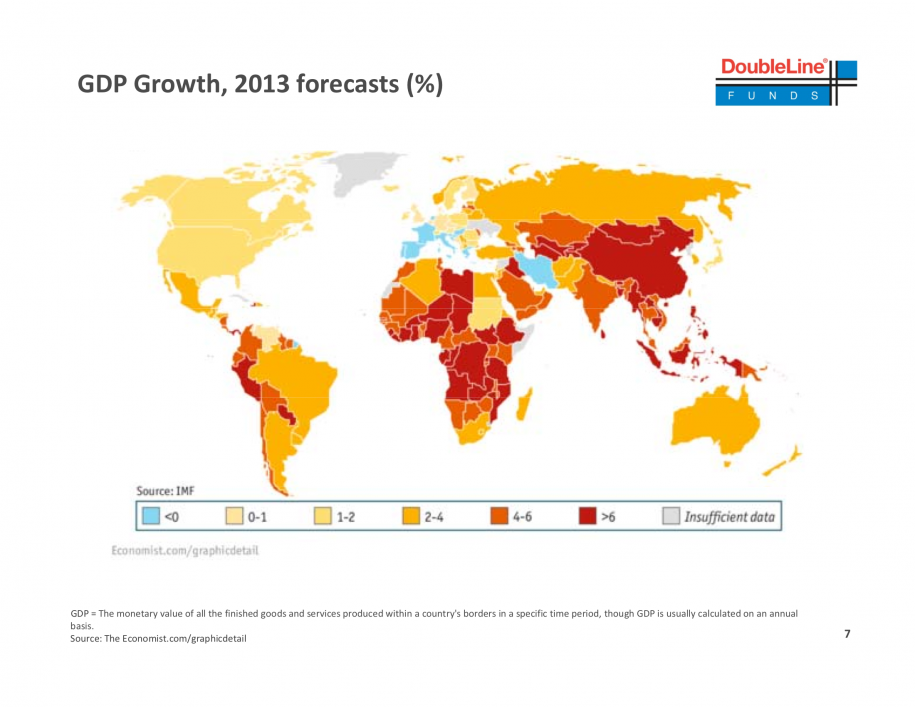
All of Gundlach’s theses are based on the fact that the global economy remains weak, GDP growth forecasts continue to come down, and unemployment remains high and lop-sided.

He communicates all of this in his eye-opening, hand-picked collection of charts on growth, employment, inflation, stocks, bonds, and other critical global macro indicators.

Anyone who is serious about investing must consider his charts. And for anyone who’s just curious, these charts will give you a peek into how Gundlach thinks.

slide-01.jpg

…..click on the link below to view 50 more remarkable charts:

http://www.businessinsider.com/jeff-gundlach-june-webcast-presentation-2013-6#more-on-markets-51
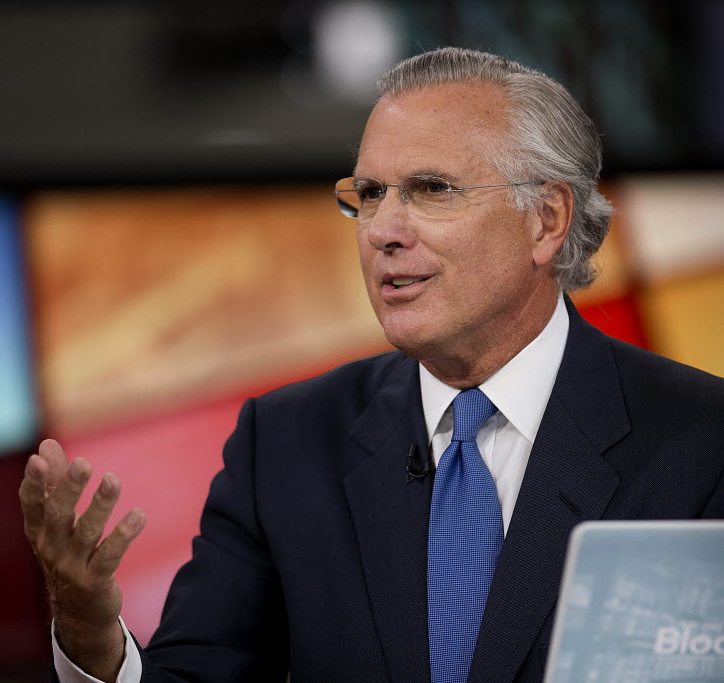
Why Do People Fear the Hindenburg Omen?

Not a track record to be proud of:Screen shot 2013-06-04 at 10.07.37 AM

The Hindenburg Omen may be a cool sounding technical indicator, but determining its reliability is a whole other story.

Tom McClellan, whose McClellan Oscillator is among the technical indicators used to trigger a Hindenburg Omen signal, said the Omen is a great “warning,” since it successfully warned of every major declining since 1984. But as the chart shows, it’s not a great “sell” signal, since it has also flashed warnings, more often than not, especially at times when the market continued higher.

While the Omen foreshadowed significant drops in 1987 and prior to the 2008 financial crisis, it has proven to be a false alarm more often than not. Significant stock-market declines have followed the indicator just 25% of the time. For instance, the technical signal flashed in August 2010, when the Dow was trading in the low 10000s. It has since rallied more than 5000 points in less than three years.

Oppenheimer chief market technician Carter Braxton Worth believes the S&P 500 is headed for a 6-9% pullback, but not because the Hindenburg Omen says so. Worth says Hindenburg is too “mechanical” an indicator to rely on. “You become a slave to the data,” he said. “I’m not going to suspend my judgment and wait and wait until I get a reading.”

Worth has been expecting the S&P 500 to sell off to the 1535-1585 level given the “unnatural, complacent nature of the trading over the last six months.”

And McClellan is also bearish over the next several months. He expects “lots and lots of damage the rest of the summer leading to a bottom which no one will believe in September.”

If that scenario plays out, should the Hindenburg Omen be blamed for the decline? We’ll let you be the judge of that.

….morer articles from MoneyBeat:

Gold’s Glittering Dilemma

The Dow’s Ridiculous Tuesday Streak, by the Numbers

Goldman Sachs: Keep the Faith on Treasurys


  1. The gold bears may have gotten themselves into a bit of hot water.  Please click here now.  Double-click to enlarge. 
  2. That’s the daily chart for DUST-NYSE, which is a triple-leveraged bet against gold stocks.  There’s a massive double top pattern in play now, featuring an important RSI non-confirmation.  The technical target of that top formation is $30. 
  3. Please click here now.  Double-click to enlarge.  That’s the weekly DUST chart, which portrays the big picture.  It looks like a technical “train wreck”;almost every technical indicator and oscillator on this chart is flashing a substantial sell signal.
  4. The meltdown on the DUST charts should be good news for gold stock investors, and I think it is.  Please click here now.  Double-click to enlarge.
  5. That’s the GDX weekly chart, and it looks superb.  Note the red downtrend line, where the price is now.  A move above that line could usher in a lot of momentum players.
  6. Those traders are likely already noticing the powerful buy signals being generated on key technical indicators. 
  7. GDX could make a run towards HSR (horizontal support and resistance) near $38.68, and that could cause immense pain to the leveraged bears. 
  8. The domino effect of ongoing short covering could create a violent rally in gold stocks, much bigger than what has occurred so far. 
  9. I’m especially impressed with the GDX weekly chart volume, which exceeded 100 million shares in each of the last two trading weeks.
  10. Some gold market investors wonder if technical analysis still works.  Are algorithm trading programs run by the banks simply “painting” the charts?
  11. Well, I don’t think anything has changed in recent years.  Charting has always been imperfect, and I don’t see it as any better or worse now, than in the past. 
  12. The larger HSR zones are most likely to be used by the biggest market players, while the “small potatoes” chart patterns have always been a bit of a crapshoot.
  13. So far, junior stocks are leading this rally, but most analysts are nervous, due to the enormous drawdowns that this sector has experienced.
  14.  I’m not too concerned, so I’ve been a solid buyer of GDJX and other junior-related plays, deep into my “personal surprise” zone. 
  15. The most wealth is likely built when brave investors place buys at prices they “know” are totally impossible.  Buying your personal surprise zone is like using contrary opinion analysis, but I believe it’s a much more powerful tool.
  16. Please click here now. You are looking at the GDXJ weekly chart.  The volume isn’t as strong as on the senior and intermediate stocks, but it’s still very good, especially with most investors and analysts too afraid to buy.
  17. GDXJ is up about 20% already, from the recent lows at $10.40.  That’s a huge move; annualized, junior gold stocks are rallying at a rate of about 200%. 
  18. After that kind of upside performance, you should be prepared to experience some very vicious down days, but there’s no question that the weekly GDXJ chart suggests that much bigger gains are coming.
  19. I think GDXJ can rally to about $16.73, before any of the weekly chart indicators turn negative.  That is roughly a 60% move from the low. 
  20.  Most investors in the gold community probably paid a lot more than $16.73 for GDXJ and their individual holdings, on a percentage basis, but remember that your entry prices are recaptured one price tick at a time.  All upside price movement must be viewed as good news, because it is!
  21. Traders that bought into the recent lows should try to book some light profits now.  Hold some larger “swing” positions, in anticipation of a much bigger rally.
  22. Please click here now.  That’s the hourly bars gold chart, and you can see that gold has been grinding higher over the past couple of weeks.  Take a good look at the six green arrows that I’ve highlighted on that chart.  Those are minor bouts of short covering, and I think they are like tremors before a major earthquake.  A short covering “super-rally” could literally wipe most bears right off the gold map. 
  23. All golden eyes should be focused on this Friday’s jobs report.  Almost all the recent economic reports have been weak.  The Japanese experiment with high-powered QE has been a total disaster.  Their stock market has collapsed, because so many Japanese companies do not benefit from a lower Yen.  The collapse in the Japanese bond market has cut off their funding.
  24.  Please click here now. Double-click to enlarge.  That’s the weekly EWJ-NYSE chart, a Japanese stock market proxy fund.  Technically, it’s horrific.  Rather than ending, the decline may be only just starting.  Instead of an economic boom, Japanese QE may create cost push inflation that spreads around the world.  Is the Japanese stock market crash a precursor to a US market wipeout, and a gold stocks “super rally”?  It could happen, and the only question may be, are you positioned to profit, if it does?

Special Offer For Website Readers:  Send me an Email tofreereports4@gracelandupdates.com and I’ll send you my free “Natural Gas & Oil, What Now?” report.  Which of these 2 key fuels should investors focus on now?  I’ll show you how I’m playing both of them!

Thanks!   

Cheers

   St  

Stewart Thomson

Graceland Updates

Note: We are privacy oriented.  We accept cheques.  And credit cards thru PayPal only on our website.  For your protection.  We don’t see your credit card information.  Only PayPal does.  They pay us.  Minus their fee.  PayPal is a highly reputable company.  Owned by Ebay.  With about 160 million accounts worldwide.   

Written between 4am-7am.  5-6 issues per week.  Emailed at aprox 9am daily.

www.gracelandupdates.com

www.gracelandjuniors.com

www.gutrader.com

Email: stewart@gracelandupdates.com

Orstewart@gutrader.com


Rate Sheet (us funds):

Lifetime: $799

2yr:  $269  (over 500 issues)

1yr:  $169    (over 250 issues)

6 mths: $99 (over 125 issues)


To pay by cheque, make cheque payable to “Stewart Thomson”  

Mail to:

Stewart Thomson / 1276 Lakeview Drive / Oakville, Ontario L6H 2M8 Canada


Stewart Thomson is a retired Merrill Lynch broker. Stewart writes the Graceland Updates daily between 4am-7am. They are sent out around 8am-9am. The newsletter is attractively priced and the format is a unique numbered point form.  Giving clarity of each point and saving valuable reading time.

Risks, Disclaimers, Legal
Stewart Thomson is no longer an investment advisor. The information provided by Stewart and Graceland Updates is for general information purposes only. Before taking any action on any investment, it is imperative that you consult with multiple properly licensed, experienced and qualifed investment advisors and get numerous opinions before taking any action. Your minimum risk on any investment in the world is: 100% loss of all your money. You may be taking or preparing to take leveraged positions in investments and not know it, exposing yourself to unlimited risks. This is highly concerning if you are an investor in any derivatives products. There is an approx $700 trillion OTC Derivatives Iceberg with a tiny portion written off officially. The bottom line:  

Are You Prepared?