
Timing & trends

»» Bonds sold off, and yields jumped across regions. Equity markets handled the volatility reasonably well, except Japan’s Nikkei and stocks that trade as “bond proxies.”
»» Margin Mania: One of the few objective, quantitative measures of investor sentiment rose to an all-time high. What does its trajectory usually mean for the stock market? (page 3)
»» Global Roundup: Overview of changes to EU budget deficit rules, including challenges facing France; updates on Canada, Japan, and China. (pages 3-4)
For the complete report as well as Daily Updates CLICK HERE.

“Our intermediate term systems are on a buy signal”
Todd Market Forecast for Monday June 3, 2013
Available Mon- Friday after 6:00 P.M. Eastern, 3:00 Pacific.
DOW + 138 on 450 net declines
NASDAQ COMP + 9 on 250 net advances
SHORT TERM TREND Bearish
INTERMEDIATE TERM TREND Bullish
Editor’s note. We E mailed the June newsletter earlier today. If you did not receive it, let us know.
STOCKS: The reason given for the buying on Monday was a weak manufacturing number. This, it is opined, will keep the Fed printing money. I have always believed that this is so wrong. The market would rather have a weak economy than a strong one because it keeps the Fed easy.
Actually, I think it rallied because of the very short term oversold condition which was the reason for our System 2 buy signal, but it was a poor quality uptrend because there were more declining issues than advancing ones.
GOLD: Gold had a good day. Up over $18. We’re still positive on this market, but the rally off the lows has been a bit labored.
CHART: We were non stop bullish for months because breadth was out performing the popular averages. That is no longer the case. The advance decline was negative today in spite of a rally by most indices. That shows that most stocks are not participating. We also like the fact that no one is talking about this internal weakness.

TORONTO EXCHANGE: Toronto was down another 41.
S&P\TSX Venture Comp: The Venture Comp was higher by 7.
BONDS: Bonds had a modest rebound.
THE REST: The dollar dropped. Silver, copper and crude oil had decent bounces.
BOTTOM LINE:
Our intermediate term systems are on a buy signal.
System 2 traders We bought the E-mini S&P 500 at 1633.00. We Bought the SSO at 79.63. Sell at the close on Tuesday.
System 7 traders We are in cash. Stay there on Tuesday.
Stock investors We are long Intel from 21.61 Let’s move the stop to 22.50.
NEWS AND FUNDAMENTALS:
The ISM Mfg. Index came in at 49.0, less than the expected 51.0. Any reading less than 50.0 indicates a contraction in manufacturing. Construction spending rose 0.4%. The expectation was for a rise of 1.0%. On Tuesday we get the trade deficit.
We’re on a sell for bonds as of May 10.
We’re on a sell for the dollar and a buy for the euro as of May 20.
We’re on a buy for gold as of May 20.
We’re on a sell for silver as of May 15.
We’re on a sell for crude oil as of May 29.
We’re on a buy for copper as of May 3.
We’re on a buy for the Toronto Stock exchange TSX as of April 24.
We are on a sell for the S&P\TSX Venture Comp. as of Jan. 29.
 INDICATOR PARAMETERS
Monetary conditions (+2 means the Fed is actively dropping rates; +1 means a bias toward easing. 0 means neutral, -1 means a bias toward tightening, -2 means actively raising rates). RSI (30 or below is oversold, 80 or above is overbought). McClellan Oscillator ( minus 100 is oversold. Plus 100 is overbought). Composite Gauge (5 or below is negative, 13 or above is positive). Composite Gauge five day m.a. (8.0 or below is overbought. 13.0 or above is oversold). CBOE Put Call Ratio ( Below .80 is a negative. Above 1.00 is a positive). Volatility Index, VIX (low teens bearish, high twenties bullish), VIX % single day change. + 5 or greater bullish. -5 or less, bearish. VIX % change 5 day m.a. +3.0 or above bullish, -3.0 or below, bearish. Advances minus declines three day m.a.( +500 is bearish. – 500 is bullish). Supply Demand 5 day m.a. (.45 or below is a positive. .80 or above is a negative).
No guarantees are made. Traders can and do lose money. The publisher may take positions in recommended securities.
Produced by McIver Wealth Management Consulting Group
Mark Jasayko, CFA,MBA, Portfolio Manager with McIver Wealth Management of Richardson GMP in Vancouver.


“The world has ended as we have come to know it. What was previously believed to be impossible – has occurred. Despite the ever omnipotent hand of the Federal Reserve the market has corrected 2 weeks in a row which is an occurrence not previously seen since October of 2012.
While it may be hard to believe, after a 16% advance since the beginning of this year, the market has declined by a crushing 38.42 points or 2.3% from the closing peak. It is clearly a washout of epic proportions that have sent investors wheeling to the sidelines to seek safety.”
Obviously, I jest a bit about the magnitude of the decline but this was the general sentiment from the media on Friday. “How could this have happened? What caused it? Who’s to blame?”
This sentiment, of course, is exactly as I suspected accordingly to an article I wrote last week wherein I stated:
“Regardless, at some point, and it is only a function of time, reality and fantasy will collide. The reversion of the current extremes will happen devastatingly fast. When this occurs the media will question how such a thing could of happened? Questions will be asked why no one saw it coming. Fingers will be pointed and blame will be laid.”
So, has the correction really started? Has the point arrived to where, regardless of Federal Reserve interventions, the market can simply not go any higher? Or, is this just a pause that we should be reallocating assets into?
That is the focus of the newsletter this week. However, it is important to remember that despite my best efforts and analysis, we are only guessing at the future.
Catalysts And Analysis
I spent much of last week discussing various aspects of market analysis from fundamental to technical. (See Suggested Reading above) The bottom line is that just about the only thing driving the markets higher currently are the ongoing liquidity operations of the Federal Reserve.
As I stated in “3 Reasons For Higher Market Highs”:
“The most obvious driver of stocks currently is the Federal Reserve’s ongoing balance sheet expansion program which pushes liquidity directly into the financial markets. As the chart shows below there is an extremely high correlation, since 2009, between the expansion of the Fed balance sheet and the financial markets.”

……read more by downloading the 17 page .pdf analysis HERE
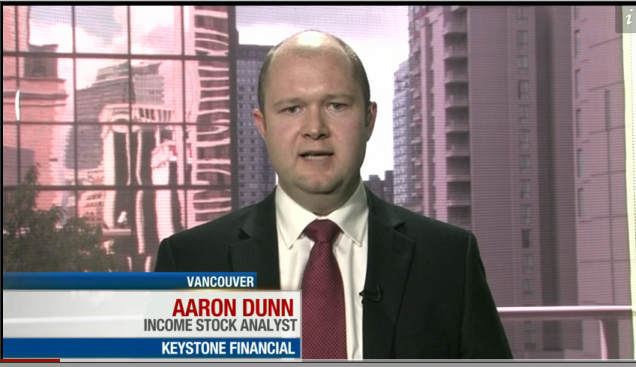
Western Infrastructure Investment a Pocket of Strength
Please Note: KeyStone’s Senior Income/Dividend Stock Analyst, Aaron Dunn appeared on BNN today. Click on the image or HERE to view the interview or see below.
This Friday, mining and energy stocks led the way to a lower session on the Toronto stock market as demand concerns dented commodity prices. The S&P/TSX composite index fell 96.14 points to 12,650.42.
Statistics Canada reported that Canada’s economy rebounded strongly from a half-year of sub-par growth, posting an above-consensus 2.5% advance in the first three months of the year and setting the country on a stronger recovery path.
The report from Statistics Canada also revised the economy’s speed from 0.6 to 0.9% for the fourth quarter of 2012, and from 0.7 to 0.8% in the third quarter of last year. The first quarter was the best three-month gross domestic product performance since 2011, and the 0.2 per cent month-to-month advance for March — the last month of the quarter — provided a solid launch to the rest of the year.
Pundits were also not so quick to give Canada’s economy the thumbs up however, pointing out that much of the growth was based on an exceptionally strong exports performance, and in particular from natural resources. With declining commodity prices, the pace of gains in both total exports and output in the mining, oil and gas extraction sector are both not likely to be sustained.
Canada’s economy is in a difficult transition period, from one supported by a strong housing sector and consumer spending, to one that must rely on exports and business investment.
Stock Pickers Market – March’s Focus BUY jumps another 20% this week, up 70% in 2-months!
As such, it will remain a stock pickers market. With the S&P TSX trading at a 3 year average high of 19.1 times earnings, broader Canadian equities should not be considered cheap. We are keeping a keen eye on certain segments of the economy for near, mid and long-term growth opportunities as we believe only pockets of the Canadian economy are positioned for growth.
As such, index buying (or passive Canadian ETFs) in Canada in the near to mid-term does not appear overly attractive. Generally, the S&P/TSX Composite is flawed for index-tracking — it’s overweight in resource and financial stocks and leaves Canadian far too dependent on these sectors for investment returns.
One “pocket of strength” we have already benefitted from this year and expect to continue to see strong long-term potential in is infrastructure investment both made and planned for Northeastern BC and Northwestern Alberta. The most notable regions in these areas include the Horn River, Montney, and Peach River Arch areas, which are three of the fastest growing liquid rich natural gas basins in North America.
Active in these areas are some of the country’s largest energy infrastructure and production companies, including, Enbridge, TransCanada, AltaGas, Pembina Pipelines, Cenovus, Spectra, Nexen, Encana, and Penn West. With the recent exception of Nexen, all of these companies are publicly-traded and report both historic and planned capital investments.
The three major pipeline projects planned for the area include Enbridge’s $6.0 billion Northern Gateway Pipeline, TransCanada’s $5.0 billion Prince Rupert Gas Transmission line (expected to be in service 2018) and TransCanada’s $4.0 billion Coastal GasLink (expected to be in service by the end of the decade). Although the Northern Gateway pipeline has been highly contentious, we believe that TransCanada’s projects have a far higher likelihood of approval considering that gas infrastructure projects have not received the same public scrutiny as Oil Sands related projects.
This past week our March 2013 Top Focus BUY from this sector, jumped another 20% and has now generated our clients a return of almost 70% in only 2 months. Despite the rise, we just reiterated our BUY recommendation after they released outstanding Q1 2013 financial results. Not only does this stock trade at around 5 times earnings, but it remains well positioned to continue to benefit and grow from the resource and infrastructure development expected to occur in Northern BC over the next 5 years.
To find out more about this exciting company and several others, go to our website www.keystocks.com and become a client of KeyStone’s small-cap and dividend growth stock research.
We are currently evaluating another relatively cheap energy infrastructure service stock with exposure to this region which may be our next Top Focus BUY.

-
I know Mike is a very solid investor and respect his opinions very much. So if he says pay attention to this or that - I will.
~ Dale G.
-
I've started managing my own investments so view Michael's site as a one-stop shop from which to get information and perspectives.
~ Dave E.
-
Michael offers easy reading, honest, common sense information that anyone can use in a practical manner.
~ der_al.
-
A sane voice in a scrambled investment world.
~ Ed R.
Inside Edge Pro Contributors

Greg Weldon

Josef Schachter

Tyler Bollhorn

Ryan Irvine

Paul Beattie

Martin Straith

Patrick Ceresna

Mark Leibovit

James Thorne

Victor Adair