
Timing & trends
In 10 yrs Rogers Fund gained 4200% vs the S&P 500 gaining 50%. His subsequent track record argues powerfully he is someone worth listening to. Yesterday Rogers told Money Morning he believes this is a badly needed – even healthy – price correction. And that will set the stage for a new bull market in gold – and a run to record prices that are sure to come in an era of cheap-money policies by the world’s central banks.
Amazingly Jim Rogers is Micheals Money Talks Guest this weekend April 27th, so be sure to tune in to CKNW or listen on the Money Talks Website to hear what he has to tell you and Michael Saturday!
…..for the moment, read what he had to tell Money Morning about Gold yesterday HERE
Weekly Gold Chart Below:


 The support on the June Gold is 1403 both intraday and on the close. A break of that area will begin to warn of further weakness. Keep in mind, that even going sideways into next week is a weak bullish trend that would forewarn of a serious change to the downside thereafter.The shocking aspect of the metals has been the total lack of a bounce. The old gold rule of trading – What will not go up – goes down!
….read much more HERE

- Many economists believe the price of gold has fallen because institutional investors have become more interested in owning the general stock market.
- May is a time when institutional investors often sell stocks. Please click here now . An ominous head & shoulders top pattern appears to be forming on the Dow.
- “If you look at the economic growth story, it’s just not really there” –David Bloom, head of FOREX for HSBC, April 23, 2013.
- Gold imports in India are surging. “Imports have been phenomenal since April 15. Banks are getting the lion’s share in this profit,” -Daman Prakash Rathod, MNC Bullion, Chennai, India.
- The banks have an “interesting habit” of making the largest profits in most markets, most of the time. Since gold crashed, dealer spreads have increased dramatically, benefitting the bullion bank dealers.
- Last year, gold bottomed in May. Will it bottom there again, this year?
- I want you to take a look at the daily gold chart, through the eyes of a bear. Please click here now . The gold bears believe there is a flag pattern in play, and prices of $1100, and lower, are coming very quickly.
- I view the market more as a fight, than an “investment”, so I like to know what’s in the mind of my opponent. There is a bearish flag pattern in play, at least on that chart, but that doesn’t necessarily mean the bears will make any profits from their analysis.
- Why would that be? Well, please click here now . That’s another view of the daily gold chart, highlighting the action of my “Stokeillator” (14,7,7 Stochastics series).
- The Stokeillator gave a very clear sell signal several days in advance of this gold crash. It’s beginning to turn up, and a crossover buy signal seems imminent.
- Most investors want to avoid pain. Traders can use my Stokeillator to do that, but longer term investors can also use my sell signals to simply grit your teeth, and get ready for a bit of a rough ride.
- The current position of the Stokeillator suggests, at bare minimum, that a pause in the bearish price action is very near.
- In the bigger picture, I’ve always asked subscribers to act as “investing marines”. That entails looking at the long term weekly and monthly charts, and defining key HSR (horizontal support and resistance) areas.
- When the gold price arrives (whether gently or in a wild crash is irrelevant to the marine) at one of these key HSR zones, the marine goes into action, and buys gold in a pyramid formation.
- Please click here now . You are looking at the weekly gold chart. Since the August 2011 highs near $1923, my view is that only 2 long term buying opportunities have occurred.
- The first occurred almost immediately after that August top, at $1577. Numerous rallies occurred from that key HSR zone.
- I maintain a “3 strikes and you’re out” HSR-area rule, for gold. It’s critical to buy the first time that price arrives at an HSR zone. Put the fear demon aside, and just buy. Analyse the situation later, but make sure you do some immediate buying, even if it is just a little bit.
- When gold crashed, it happened after the fourth touching of the HSR at $1577. Gold struck out, and so did investors who called the bottom there.
- Focus on buying an asset that is timeless, without hesitation, analysis, or procrastination. If you try to predict a parabola for gold, long after HSR is first touched, you are more likely to strike out than hit a home run.
- I have some minor concern that the violence of the crash into massive HSR in the $1432 area may be enough to send gold down to the next zone of key HSR, at $1266.
- That’s not far below the current $1320 area lows, so it’s very important that investors don’t panic. Instead, prepare to start buying at $1266, if gold goes there.
- For investors who can’t fight their personal fear of lower prices, put options are the best solution.
- The key fundamental question right now is, “what demand factor can overwhelm the ETF selling?” Well, if gold were to decline to the $1200 area, Indian scrap sales, which are already dropping, could cease altogether.
- What about the short term? Please click here now . I think a test of the $1400 area is coming, but not yet. First, I think gold will retest the highs near $1435. This chart also provides a closer look at the supposed “bear flag” pattern. I don’t see a flag at all. I see a bottoming process, fuelled by dwindling Indian scrap sales and central bank purchases. You should be ready to buy at $1266, but $1470 is the more likely price objective, in the immediate term!
Apr 23, 2013
Stewart Thomson
Graceland Updates
website: www.gracelandupdates.com
email for questions: stewart@gracelandupdates.com
email to request the free reports: freereports@gracelandupdates.com
| Tuesday Apr 23, 2013 Special Offer for 321Gold readers: Send an email to freereports@gracelandupdates.comand I’ll send you my free “GDX & GDXJ Rise From The Ashes” report. Learn why I’m an aggressive buyer of gold stock here, and how to use put options to protect your positions! |
Market Psychology changes from bullish to bearish…to bullish…whether it’s Gold or AAPL or Nat Gas…or any other market…our job as traders/investors is to try to CLEARLY SEE if a market is in bullish mode or bearish mode and trade accordingly…we want to avoid the confusion that comes from trading a market the way we think it OUGHT TO BE rather than the way it is.
Record volume and a huge price break may signal a downside capitulation in gold:
We saw all-time high (ATH) volume of ~750,000 contracts in Comex gold futures on Monday April 15 as prices fell more than $160. The previous ATH record daily volume was ~ 500,000 contracts made on Nov 28/2012…also a big down day. Last week’s volume was also an ATH weekly record.
On April 16 gold prices made a 2 ½ year low…down ~$610 (over 30%) from the September 2011 ATH of $1930 (hitting several downside targets – Greg Weldon.) In 5 trading days (Apr 10 to 16) gold dropped ~$268 or ~17%. The record high volume and dramatic price break may signal a downside capitulation…and indeed the gold price has rebounded over $100 from the April 16 lows.
Gold Shares/Indices:
American Barrick touched levels ($17.50) not seen since the depths of the 2008 wipeout. ABX was $42.00 just last September…it had several ATHs above $55 in 2011.
The broader gold share indices (GDX, HUI) held up better than ABX but the ratio of the gold share indices to gold dropped to a new 12 year low last week…the momentum of the decline in gold share indices relative to gold has accelerated sharply since October of last year. On this blog and on Moneytalks radio I have repeatedly cautioned against buying gold shares because they were CHEAP…when a market is going down you have no idea how far down DOWN IS!
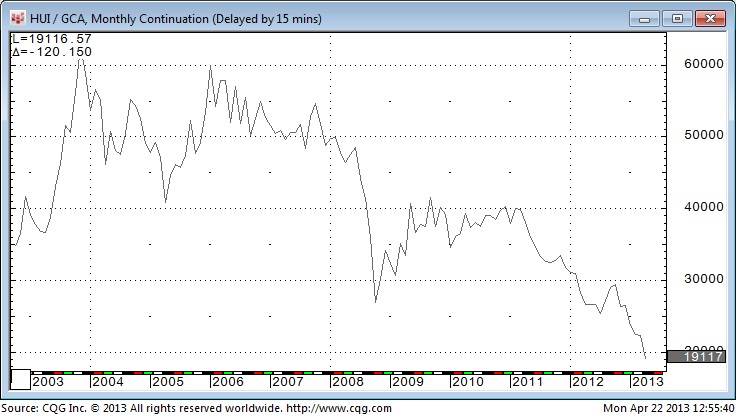
….continue reading HERE
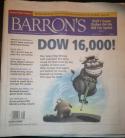
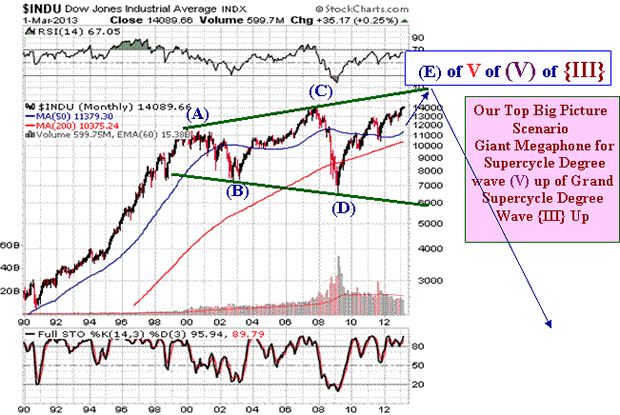
U.S. Stock Market – We’re starting to see the excess that is needed before a major top can be put in. As more of these types of headlines and predictions of higher and higher take hold, the more likely we can see “the” top (but not before).

-
I know Mike is a very solid investor and respect his opinions very much. So if he says pay attention to this or that - I will.
~ Dale G.
-
I've started managing my own investments so view Michael's site as a one-stop shop from which to get information and perspectives.
~ Dave E.
-
Michael offers easy reading, honest, common sense information that anyone can use in a practical manner.
~ der_al.
-
A sane voice in a scrambled investment world.
~ Ed R.
Inside Edge Pro Contributors

Greg Weldon

Josef Schachter

Tyler Bollhorn

Ryan Irvine

Paul Beattie

Martin Straith

Patrick Ceresna

Mark Leibovit

James Thorne

Victor Adair