Timing & trends

Is It Time To Buy Gold? The Update

Gold has historically been considered a hedge for inflation, dollar devaluation and economic stress.  Since the end of the last recession gold has been an asset class of choice by those expecting hyperinflation due to the ongoing activities by Central Banks worldwide.  As for us , and our clients, gold is a commodity that should be owned when it is rising and sold when it isn’t.  For us the best hedge against inflation is making sure that invested savings grow at a rate sufficient to maintain the purchasing power parity of those savings in the future.  We can discuss the difference between inflation, hyperinflation and the effect of owning physical gold in a fiat currency world but that is another article entirely.

It seems like 18 months ago…wait, it was a 18 months ago, that we wrote in our weekly missive that gold had peaked after a parabolic spike stating: 

Screen shot 2013-02-23 at 8.20.38 AM

Then in March of 2012, as the media began predicting the end of gold as an asset class, I wrote “Death of the Gold Bull Market” updating our August analysis wherein we discussed the consolidation process for gold before the next move higher could occur.   Well, here we are today with gold pushing the lower bounds of that consolidation range and still entrenched in this long, and drawn out, 18-month consolidation process.  So,the obvious question becomes, is it time to “buy?”

Gold-buysignal-022013

The first chart shows the weekly “buy” and “sell” signals.  During the last recession gold had experienced a very similar parabolic price spike going into the first quarter of 2008.  This spike in gold prices resolved itself over the remainder of the 2008 with a correction of 30% during the financial crisis.  That consolidation process then gave way to the next major leg of the secular gold bull market.  That surge was fueled by fears of hyperinflation due to successive rounds of liquidity injections by the Fed and soaring national debt levels.  

As the Fed pondered the idea of entering into QE2 in the summer of 2011, combined with the fears of a debt default due to the “debt ceiling debate” at the time, gold again went into a parabolic price spike.  While an actual default on U.S. debt was never actually a concern, as witnessed by the sharp drop in 10-year interest rates at the time, the fears of such an event sent gold prices spiraling higher (along with underground bunker, gun, ammo and dried food sales.)  Currently, the fears over the debt ceiling, along with potential default on our debt, are of little concern to the financial markets.  The chart shows that gold remains range bound within the confines of $1500 to $1700 per ounce. 

As shown in the chart below – the current “sell off” in gold has much to do with the rally in the U.S. dollar, particularly as Japan has entered into an effective “currency war” by forcing yen valuations lower.  Over the past decade the movements in the dollar have had a high inverse correlation with gold.

Gold-USD-022013

Since gold is generally a “fear” trade it is not surprising to see gold prices under pressure given the overwhelming bullish sentiment recently about the economy and the markets.  However, it is likely that such optimism will be dampened by reality as the impact of the global recession weighs on the U.S. economy as I discussed recently

This begs the question as to what will most likely cause the next rally in gold?

Catalysts For The Next Gold Surge

The following are the catalysts that could certainly send investors scurrying back into gold.

A Resurgence In The Eurozone Crisis – It has been incredibly quite in the Eurozone since last summer when Draghi made his “do whatever is necessary speech.”  However, while the crisis has seemingly been quelled there has actually been very little done to fix the issues that had previously sunk the Eurozone into its crisis.  As we have discussed previously in much more detail – Germany is the lynchpin for Europe and with a large majority of the German population against further bailouts, the economy slipping into a recession and Angela Merkel up for re-election this year, it is likely that the things could potentially come to a head once again.  A resurgence of the debt crisis could well fuel fears of a breakdown in the global financial system pushing gold prices higher. 

Stock Market Declines By 20%

The stock market will have another correction sometime this year with my best guess being sometime this summer – if not sooner.  The markets are currently extremely overbought and complacency is exceptionally high.  These are the catalysts necessary for a meaningful short term correction of 10-20% just as we have seen over the past three summers. While the market has been pushing higher with the expansion of the Fed’s balance sheet, of which there is an 85% correlation, the economic underpinnings remain very weak.  Therefore, any reduction in the liquidity injections, of hints from the Fed that QE programs will wind down, could send investors scurrying out the markets and into gold for a “safe haven” play.

Economy Slows To Near Recession

The fear of a recessionary economy, or worse, is a “gold bugs” best friend.  There have been plenty of stories about how the economy is going to ultimately collapse and the dollar will fall to zero because of the rising debt and deficit spending of the government.  While economic growth is most definitely impacted by the high debts – the “End of America” is not coming anytime soon.  

However, as stated above, it is the “fear” of these events that drive individuals into buying gold as a hedge against the demise of the economy and the collapse of the U.S. currency.  The economy is already running at a very weak pace and any impact from a misstep in fiscal policy, or an early withdrawal of monetary policy, could well push the economy close to, or into, a recession.  In such an event gold will be viewed as a hedge against economic ruin.

Time to buy gold now?

As stated above, for us, owning gold is really more of an issue of technical analysis versus some fundamental underpinning or “emotional fear” of economic collapse.  Therefore, the question of whether to buy gold now, or wait, is simply of function of what the overall market thinks about it.  Prices really tell us all we need to know about a chunk of inert metal.   For the gold bugs, let me clear, I am not dismissing the potential for economic crisis in the future that could send prices soaring.  However, between now and that future event, there is the possibility of a large price decline that I care not to participate in. 

Therefore, from a technical standpoint, gold is getting to a place where a potential trading opportunity may occur.  Historically speaking, when the price of gold has gotten more than 4% below the average price (inverted to display a positive number to display better) it has been consistent with a near term bottom in gold prices.  With gold now 6.7% below is 13-week moving average – the risk/reward opportunity appears to be favorable for at least a short term trade.  However, what investors should not be doing at this point is panic selling into this slide.  With gold on a very serious “sell” signal counter-trend rallies should be used to reduce excessive weightings in gold until the overall trend becomes positive.

Gold-Deviation-022013.PNG

The second chart shows gold prices on a weekly basis going back to 2000 compared with 2- and 3-standard deviations from the 34-week moving average.

Gold-Deviation-022113


How Close to the Final Bottom in Gold Are We?

7 POTENT REASONS WHY IT’S…..

Time to Buy Precious Metals Now

Since the end of December we’ve been writing about the coming bottom in precious metals. Our forecast for 2013 was to see a low in Q1 and then continued consolidation until the end of the summer in which Gold could be in good position to break $1800. That forecast remains largely intact, although it appears the mining stocks will bottom quite a bit lower than we thought two months ago and even five months ago. Three weeks ago we noted that a potential final bottom was on the way. After beating around the bush we are ready to say that now is the time to begin buying and we’ll show you why.

Technicals

In our article three weeks ago we noted this major trendline support for the gold stocks. The market is about 6% from this major trendline which also coincides with the 62% retracement of the 2008 to 2011 cyclical bull.

feb21huitl

Let’s zoom in on the short-term for GDX as we prefer it to the HUI above. We already know the major support trendline (for the sector) is nearby. The sector is approaching that support in an extreme oversold condition. GDX has shed 31% in the past five months and 18% in just 21 days. Moreover, note the three open gaps and how they’ve occurred following an already substantial decline. Hence, these gaps are a reflection of emotion which leads to panic. If we see a final gap then it is likely to be an exhaustion gap which would signal a reversal is imminent.

feb21gdxgapsdeclines

For Gold & Silver I show weekly candle charts as they give us an idea of the bigger picture. That picture is one of long consolidation after significant gains following the 2008 low. Recall the price action from 2009 to the 2011 peaks. Gold gained from $950 in the summer of 2009 to a peak of $1923 in the summer of 2011. In the same period Silver went from $13 to $49. Folks, these are massive moves that take time to be digested. By time we mean quarters to years, not weeks or months. As we sometimes try to decipher every wiggle, it’s easy to forget that point. Turning back to the present, pay attention to how the metals close this week and the next few weeks. There is major support at these levels and we expect to see the metals hold the ranges denoted on the chart.

feb21gsweekly

Let’s throw in the S&P 500 for a little intermarket analysis. We have the gold stocks extremely oversold and Gold and Silver at major support while conventional equities are nearing major resistance. Which side seems to be a better buy right now? Moreover, note how each subsequent advance is getting weaker as well as shorter. Mainstream pundits like to laud this as a great bull market. The S&P rebounded 105% in the first two plus but in the 22 months since it is up only 8.8%. This is hardly a resemblance of a new secular bull market. Go look at 1942 to 1946 and 1982-1986 to see how secular bull markets actually begin. The S&P 500 has a cyclical bear market in between now and the start of the next secular bull.

feb21spx

Sentiment

Jason Goepfert the brilliant creator of sentimentrader.com, notes that Gold’s public opinion is at its second lowest reading in a decade. Gold has declined in price since this data was updated. Perhaps it could reach the lowest in 10 years?

feb21goldpo

Meanwhile, in other sentiment news, Dan Norcini notes that hedge fund short positions in Gold are at a 5-year high and Bloomberg noted that bets on higher Gold prices fell to the lowest since 2008.

I stumbled upon this chart which I think is from Option Strategist. It shows the weighted put-call ratio for GDX. It’s at a 27-month high.

feb20gdxpc

Another from sentimentrader.com is data from the Rydex Precious Metals Fund. This is a fund focused on mining stocks. Assets in the fund have declined 50% in just the past four months! From Q1 2011 to Q2 2012, assets gradually declined. Recent action shows panic and capitulation. Relative to all sectors, this fund’s assets are inches away from reaching a minimum of a six-year low.

feb21rydexpms

Conclusion

The technicals show the precious metals complex as extremely oversold and nearing strong support. This coincides with extremely negative sentiment which is bullish from a contrary perspective. Anecdotally speaking, I am amazed at the explosion of negative press in just the past few days. I can’t remember anything like it since I began following this market in 2002. Some stocks may have already bottomed while the HUI/GDX could have one nasty day left. We have begun to layer into a few positions and will continue to next week. If you have cash, now is the time to use it on both the metals and the stocks. If you’d be interested in professional guidance in uncovering the producers and explorers poised for big gains then we invite you to learn more about our service.   

Good Luck!

Jordan Roy-Byrne, CMT
Jordan@TheDailyGold.com

ALSO ON THE DAILY GOLD


The Wal-Mart Indicator: We’re Heading for a Stagflationary Disaster

walmart wide-6606128d6a5697583d7d27bed8a04a3a51c34b1e-s6-c10In the second half of 2012, the media, Federal Reserve, and various Governmental economic bean counters engaged in what we call Great Global Rigging of 2012 in an effort to make the US economy look better to help the Obama campaign re-election bid.

Now that the election is over, the ugly economic realities have begun to creep out from where they were swept under the rug. And while the official economic data is bad (a negative GDP in the fourth quarter of 2012), it’s nothing compared to what real-time indicators are showing:

Wal-Mart Stores Inc. (WMT) had the worst sales start to a month in seven years as payroll-tax increases hit shoppers already battling a slow economy, according to internal e-mails obtained by Bloomberg News.

“In case you haven’t seen a sales report these days, February MTD sales are a total disaster,” Jerry Murray, Wal- Mart’s vice president of finance and logistics, said in a Feb. 12 e-mail to other executives, referring to month-to-date sales. “The worst start to a month I have seen in my ~7 years with the company.”

Wal-Mart and discounters such as Family Dollar Stores Inc (FDO). are bracing for a rise in the payroll tax to take a bigger bite from the paychecks of shoppers already dealing with elevated unemployment. The world’s largest retailer’s struggles come after executives expected a strong start to February because of the Super Bowl, milder weather and paycheck cycles, according to the minutes of a Feb. 1 officers meeting Bloomberg obtained. http://www.businessweek.com/news/2013-02-15/wal-mart-executives-sweat-slow-february-start-in-e-mails

Here’s Wal-Mart, the single largest retailer in the US, reporting that it just had the single worst start to any month in over seven years. Indeed, the company missed just revenues expectations as families adjust to a “reduced paycheck and increased gas prices.

The increased gas prices is most important. Inflation is already seeping into the system in a big way. Indeed, if you account for real inflation (not the Fed’s phony CPI measure), the US economy contracted by over 1% last quarter.

Make no mistake, we are heading into a stagflationary collapse. The time to prepare is NOW before stocks “get it.”

So if you have not already taken steps to prepare for systemic failure, you NEED to do so NOW. We’re literally at most a few months, and very likely just a few weeks from the economy taking a massive downturn, potentially taking down the financial system with them. Think I’m joking? The Fed is pumping hundreds of BILLIONS of dollars into financial system right now trying to stop this from happening.

Another Article from Phoenix Capital Research: Spain Just Issued a Warning: The System is Blowing Up Again

About Phoenix Capital Research

We are interpreters of the global economy and financial markets.

Our clients are individual investors and financial institutions seeking clear, no nonsense, insights into what’s really driving economic developments and market movements. This, combined with our unique investment ideas, has made us a research firm of choice for clients that include tens of thousands of individual investors as well as:


Frank Holmes: A 95% Probability For Gold To Rise

When It Comes to Gold, Stick to the Facts

Gold just dipped below $1,600, falling to a six-month low, much to the chagrin of gold investors. I find the timing of the correction peculiar, given the G20 Finance Ministers Meeting taking place this past weekend. There’s been a growing debate over Japan’s move to devalue its currency to stimulate growth, with reaction from the G-7 leaders stating that “domestic economic policies must not be used to target currencies,” reports Reuters. 

While the G-7 tried to legitimize the currency debasement with this statement, in reality, investors seem to be able to see through to the real motivations. 

The main reason the mainstream media gave for the correction in the yellow metal is hedge funds’ selling of gold late last year. According to quarterly filings, Hedge Fund Manager George Soros sold half of his holdings in the SPDR Gold Trust ETF (GLD) in the fourth quarter of 2012. Bloomberg attributed the sell as a move that may “bolster speculation that gold’s 12-year bull-run is coming to the end.” However, Soros may have liquidated his gold holdings because he identified a significant short-term opportunity in the currency markets. 

I have said many times that government policies are precursors to change, and late last year, Japan’s new leader, Prime Minister Shinzo Abe, openly indicated his intention to drive down the currency to make the economy more competitive and increase inflation. As a result of Japan’s policy changes, the yen weakened, driving up the price of gold in Japan’s local currency. 

In other words, a gold investor in Japan was likely ecstatic with his gold trade over the past few months. 

Take a look at the comparison of gold’s return in different currencies. The chart below compares the percentage change of gold in the Japanese yen to the metal’s percentage change in U.S. dollar terms over the last six months. From the middle of August 2012 until about November, gold prices in both currencies closely followed each other. 

However, as a result of changes in government policies, over the six-month period, gold rose nearly 19 percent in yen, while only increasing less than one percent in U.S. dollar terms.

gold-2013-1

George Soros seemed to anticipate the effect that Japan’s government policies would likely have on the velocity of money. This turned out to be a brilliant move, as “wagering against the yen has emerged as the hottest trade on Wall Street over the past three months,” says the Wall Street Journal. The newspaper reported that Soros gained “almost $1 billion on the trade since November,” during a time the yen declined nearly 20 percent in four months. 

I admire Soros for his ability to identify significant effects that government policies have on markets as easily as recognizing when ice turns to water. More importantly, he quickly acts on these emerging events. 

This isn’t his first big win in foreign markets. In 1992, based on British government policy changes, Soros shorted British pounds and bought German marks, earning $1.8 billion for his fund. 

Just like recognizing how new equilibriums can alter the dynamics of an environment, government policies can significantly change the velocity of money. Global investors watch for these trends to know where to invest in commodities and markets, find new opportunities and adjust for risk.

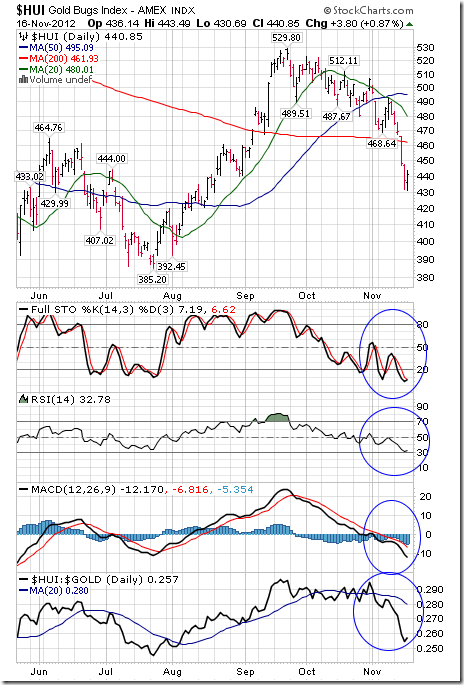
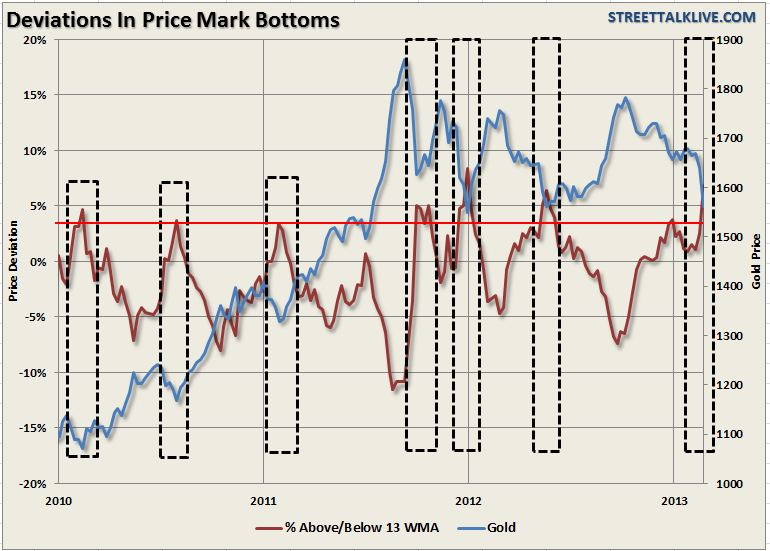
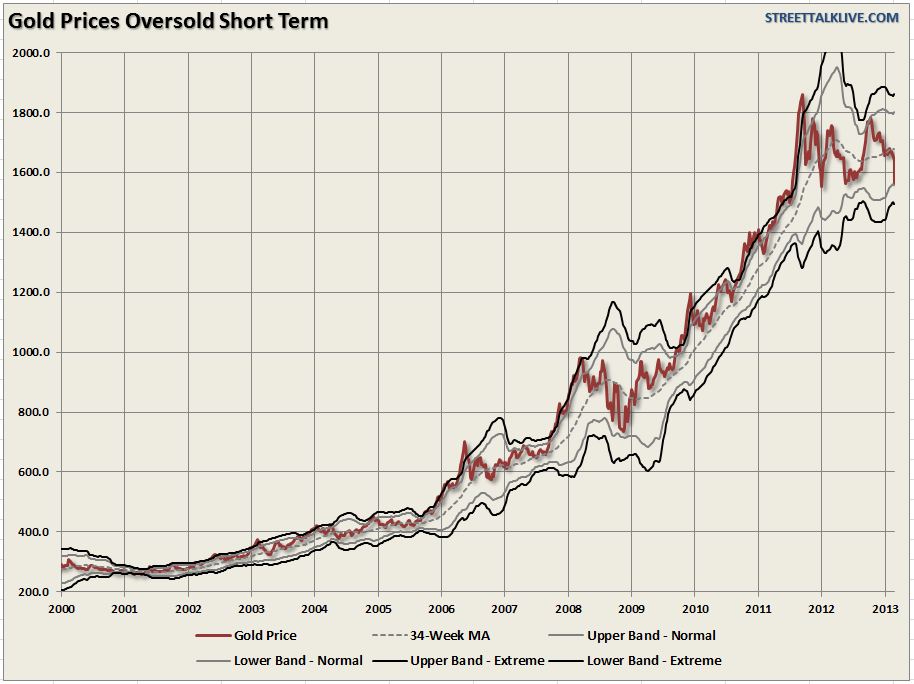
I discussed the potential motivation behind Soros’ trade with Simon Hobbs last week on CNBC. I explained how gold’s correction was reaching an extreme, indicating a potential buying opportunity. You can see on our oscillator model how gold has dropped nearly 2 standard deviations on a year-over-year basis. An event like this has happened only about 2 percent of the time over the last 10 years. Following these extreme lows, gold has historically increased as much as 15 percent over the next year.

gold-2013-2

Back in June 2012, I told CNBC the same thing: Gold had reached an extreme low, and only a few months later, the metal climbed nearly 10 percent. 

During short-term gold corrections, it’s much more important to focus on the facts, including the fact that gold is increasingly viewed as a currency. Rather than buying real estate, lumber or diamonds, central banks around the world are buying gold. According to the World Gold Council (WGC), over 2012, central bank demand totaled 534 tons, a level we have not seen in nearly 50 years.

gold-2013-3

Emerging market central banks have been adding gold to their reserves, including Mexico, Brazil, the Philippines, South Korea and Russia. Over the past decade, Russia has accumulated a total of 958 tons of gold, making its gold reserves the eighth largest of all central banks, says the WGC. 

Another fact about gold is the persistence of the Love Trade. As you can see below, jewelry demand declined slightly, about 3 percent in 2012, and more than half of this demand came from India and China, the countries with a cultural affinity toward gold. India’s gold purchases declined 12 percent due to an import tax and a weak rupee. However, even though the gold price experienced a significant increase in local currency, India’s demand is “all the more remarkable and serves to emphasize the importance of gold to Indian consumers,” says the WGC. 

Notably, India had a better-than-expected fourth quarter, and retained its rank as the largest gold market in the world.

gold-2013-4

In China, there was a slowdown in GDP in the first half of the year, which weighed on gold purchases. For the year, the WGC indicated that there was only a slight increase in demand over the previous year. 

In 2013, the WGC expects both markets to remain strong, forecasting growth rates of about 10 to 15 percent. I believe as GDPs in Chindia rise, so will their gold demand. And as long as the precious metal is attractive to both the fear trade and the love trade, hold tight to gold, with a 5 to 10 percent weighting in gold and gold stocks, and rebalancing annually. 

Frank Holmes
CEO and Chief Investment Officer, U.S. Global Investors

[U.S. Global Investors, Inc. is an investment management firm specializing in gold, natural resources, emerging markets and global infrastructure opportunities around the world. The company, headquartered in San Antonio, Texas, manages 13 no-load mutual funds in the U.S. Global Investors fund family, as well as funds for international clients.]


The Bottom Line: Spring Opportunity

A shallow correction between now and the end of March will provide an opportunity to accumulate sectors on weakness that have a history of outperformance into spring. Sectors include energy, metals and mining, copper, platinum, retail, steel and auto & auto parts.

clip image046 thumb1

Selected equity markets around the world (e.g. most western European markets, Canada, Mexico) showed short term technical signs of weakness last week. U.S. equity markets for the most part have held in a relative tight trading range during the past two weeks and remain short term overbought.

U.S. equity markets have a history of reaching a short term peak at the end of the first week in February in the year following a U.S. Presidential election. Thereafter, they enter into a shallow correction lasting until the end of March. Thereafter, U.S. equity markets move higher. History is repeating this year.

Equity Trends

The S&P 500 Index added 2.86 points (0.01%) last week. Intermediate trend is up. The Index remains above its 20, 50 and 200 day moving averages. Short term momentum indicators remain overbought.

clip image003 thumb6

The TSX Composite Index fell 114.60 points (0.90%) last week. Intermediate trend changed from up to down on Friday on a break below 12,668.81. The Index remains above its 50 and 200 day moving averages, but fell below its 20 day moving average. Short term momentum indicators are trending down. Strength relative to the S&P 500 Index remains negative.

clip image008 thumb5

The VIX Index fell 0.56 (4.30%) last week to a six year low.

clip image044 thumb1

Precious Metals

Gold fell $57.40 per ounce (3.44%) last week. Intermediate trend changed from neutral to down on a break below support at $1,626.00. Gold remains below its 200 and 50 day moving averages and fell below its 20 day moving average. Strength relative to the S&P 500 Index remains negative. Short term momentum indicators are oversold.

clip image028 thumb2

Silver fell $1.59 per ounce (5.06%) last week. Intermediate trend changed from up to down on a break below support at $30.75. Silver remains below its 20 and 50 day moving averages and moved below its 200 day moving average. Strength relative to Gold changed from positive to neutral. Short term momentum indicators are trending down.

clip image034 thumb1

The AMEX Gold Bug Index dropped another 23.99 points (5.95%) last week. Intermediate downtrend was confirmed on a break below support at 385.20. The Index remains below its 20, 50 and 200 day moving averages. Strength relative to Gold remains negative. Short term momentum indicators are oversold.

clip image033 thumb1

The TSX Metals & Minerals Index fell another 12.15 points (1.25%) last week. Intermediate trend is down. The Index remains below its 20 and 50 day moving averages and above its 200 day moving average. Strength relative to the S&P 500 Index remains negative. Short term momentum indicators are oversold.

clip image038 thumb1

Commodities

Crude Oil added $0.14 per barrel (0.15%) last week. Intermediate trend is up. Support is at $94.97 and resistance is at $98.24. Crude remains above its 50 and 200 day moving averages and below its 20 day moving average. Strength relative to the S&P 500 Index remains neutral. Short term momentum indicators are trending down.

clip image028 thumb2


….read much more & view 37 more charts HERE