
Timing & trends
Fiscal Cliff issues continue to weigh on equity markets. The issue intensified after the close yesterday when Secretary Treasurer Timothy Geithner informed the Senate that the statutory debt ceiling will be exceeded on December 31st. The government has the ability to continue to operate until March using various short term accounting measures. However, the pressure is increasing on Congress to reach at least a short term “kick the can down the road” deal that addresses specific issues that expire January 1st. The VIX Index jumped more than 9% yesterday.

…..9 more interesting charts & commentary at top of the page HERE
One of the best known seasonal events on Wall Street and Bay Street is the Santa Claus Rally. The event traditionally happens from just before Christmas Day to just after New Year’s Day. Investors consider price gains during this period as Santa’s gift to equity markets. The event is more than a guy in a red suit coming to town. Influencing factors include upbeat investor sentiment, lighter trading volumes, encouraging economic news, bullish reports by investment dealers highlighting prospects for the following year, expectations for seasonally strong fourth quarter earnings and the investment of year-end bonuses. In addition, equities pressured by year-end tax loss selling frequently rebound from bargain prices.
The Santa Claus rally is the strongest three week period of the year for U.S. and Canadian equity markets. Thackray’s 2012 Investor’s Guide notes that average return per period for the S&P 500 Index from December 15th to January 6th during the past 61 periods was 2.0 per cent. Profits were realized in 46 of the past 61 periods. Returns from the NASDAQ Composite Index were jollier. Average return during the past 40 periods was 3.0 per cent. Profits were realized in 31 of the past 40 periods. The TSX Composite Index since its reconstruction in 2000 has gained in 10 of the past 11 periods. Average gain per period was 3.0 per cent.
Conditions for a Santa Claus rally this year are favourable. Chances are high that Congress and President Obama will resolve the “Fiscal Cliff” before the end of the year. A resolution will remove a major uncertainty for equity market and will set the stage for U.S. and Canadian corporations to employing their huge cash positions. Canadian corporations hold cash equivalent positions valued at more than $560 billion. S&P 500 companies excluding financial institutions hold cash positions valued in excess of $1.5 trillion.
Other news also could help during the current Santa Claus rally. Economic news is improving. Recent economic reports show that growth in Canada and the U.S. is slightly accelerating albeit from a very low level. Growth is supported by record low interest rates in both countries. In addition, investors will begin to anticipate the release of encouraging fourth quarter and annual earnings reports when chief executive officers traditionally try to give shareholders good news. Earnings news from Canadian companies is expected to be better than news from major U.S. companies. Consensus for fourth quarter earnings by the S&P 500 companies is a year-over-year gain of 3.0 per cent. Consensus for Canada’s top 60 companies is a year-over-year gain of 6.3 per cent.
A wide variety of sectors are available with a history of outperforming the market during the year-end rally period: Best performing sectors include Small Caps, Home Builders, Metals & Mining, Biotech, Technology, Industrials and Consumer Discretionary. Exchange Traded Funds with exposure to these sectors include iShares Russell 2000 Index (Symbol: IWM US$84.12), SPDR S&P Homebuilders Index (Symbol: XHB US $26.77), S&P Metals & Mining (Symbol: XME US$29.32), NASDAQ Biotech (IBB US$139.07), Technology SPDRs (XLK US$29.32), Industrial SPDRs (XLI US$38.25) and Consumer Discretionary SPDRs (XLY US$47.91). Equivalent ETFs, that trade in Canadian Dollars, include iShares Russell 2000 Index Canadian Dollar Hedged (XSU $18.30), Global Metals and Mining iShares (CMW $17.63) and BMO Equally Weighted Metals and Mining (ZMT $13.52). All currently have a favourable technical profile.

Precious metals: Should have been rallying on the back of the global “reflationary” efforts from governments and central banks…and a weak US Dollar…BUT prices have been falling since early October.
Gold has fallen about $150 (just over 8%) from its October highs…last week’s Fed announcements and the “reflationary” election of Abe in Japan gave the market very little lift…when a market doesn’t react well to bullish news…LOOK OUT!
Someone is obviously selling…we may never know who or why…but on Nov 28 prices fell as much as $40 on the largest EVER daily volume in gold futures on the NY Comex …prices are down ~$100 since then. The selling could be totally un-related to gold…ie…a hedge fund may have taken big losses in the stock market and had to sell gold to raise liquidity….or the selling could be very much about gold…it’s had a great run over the last 10 years…maybe someone thinks the easy money has been made and it’s time to cash out…and move on to other things…see last paragraph below.
Silver: was also down on Nov 28, on larger than normal volume, but bounced back the next day….so the selling was gold specific. However silver began to outpace gold to the downside in early December and has fallen ~13% from last week’s highs to this week’s lows, compared to only a 5% loss for gold. This looks like capitulation selling in silver…liquidation of leveraged positions.
Gold and silver usually move more-or-less in tandem…BUT…when precious metals are charging higher silver will run hotter than gold…and when prices are falling silver will fall faster than gold. Since the October highs gold is down ~8%, silver is down ~16%.
Platinum: hit $1735 in early October following the “risk asset lift” from the September global round of “Q” announcements …it traded down to a low of $1525 Dec 21…down ~12% from the October highs, down ~7% from last week’s highs.
Gold shares: remain very weak relative to gold…near their weakest levels of the last 10 years.
So far the selling of gold seems to be restricted to the futures markets…with gold open interest down ~12% in the last month…while outstanding Gold ETFs remain close to all time record highs. Gold bulls might see this as further evidence that the “paper gold” market is “silly” while the physical market tells the real story…however, if the sell-off in the futures market continues then we may start to see selling pressure in the physical market.
We are in thin year-end conditions and that could be exacerbating the declines. Last year gold fell from $1800 to $1530 in the last 6 weeks of the year…and then bounced back to $1800 two months later.
The traditional relationship of a weak US Dollar = higher gold prices has not been working lately…adding to the confusion.
The short term precious metal chart patterns look bearish…and the longer term trend line under the gold market since the 2008 lows has been broken. See charts below.
One of my key trading rules is to trade what the market is doing…not what I think it should be doing…this rule is VERY EFFECTIVE because so many people DO trade what they think the market should be doing…that is, they buy a market that they “believe” should be going up…and when it doesn’t go up they get trapped with a losing position…and then if prices decline and bearish Market Psychology intensifies they may be subject to forced liquidation.
I think “the public” is very inclined to “believe” the gold bull market story…it’s a very convincing story…there’s only so much gold and the authorities keep “printing” paper money…the gold bulls “really believe” the story and may therefore be more inclined to “go down with the ship” than say, soybean bulls or crude oil bulls. One of the most common forms of DENIAL with traders who are holding a losing position is to change their time frame…that is, they buy something because they expect it to go up but when it doesn’t they convert it from a trading position to a “long term hold” to avoid taking a loss.
I’ve traded gold for 40 years. Physical gold, gold shares, and gold futures and options. I have a very good understanding of the fundamental reasons to be bullish gold…but I’m sensing a change in Gold Market Psychology…I’m watching the charts not reading the opinion pieces…I’ve said many times that I think the $1900 September 2011 highs could be the highs for a long time. (Those highs were All Time Highs in nominal US Dollar terms..23 year highs in terms of the S+P 500…an increase of over 800% in terms of the S+P 500 from the lows of July 1999.) If gold breaks below $1530 (it’s lows for the last 18 months) then $1200 would be a reasonable near term target. If prices turn around and rally through $1800 then Gold Market Psychology should turn very bullish…and new All Time Highs would be in order.
Chart section:
Gold: had a Weekly Key Reversal Down from the $1800 level in February and trended lower into May….formed a rising wedge from May thru August (rectangle) and then broke out to the upside…only to be turned back again at the $1800 level in October. If gold finds support around $1630 ( the top of the rectangle) it may turn higher…if not, then expect a challenge of the $1530 level.

Gold: Has been in a trading range between ~$1530 and ~$1800 for over a year.

Gold: The uptrend line from the 2008 lows was decisively broken in May 2012. The market rallied to the underside of the uptrend line in September/October 2012, but then turned lower…a bearish sign.
Note the powerful Monthly Key Reversal Down at gold’s All Time Highs.

Gold / S+P 500 ratio: The Great Bull Market in stocks began in 1982…the gold price went broadly sideways between $300 and $500…so gold fell relative to the S+P until 1999…and then gained over 800% to the 2011 highs…maybe this ratio gain has motivated the recent selling of gold.

Over the years I have developed a number of trading and risk management “rules” (see: http://www.victoradair.com/how-be-better-trader.)
Merry Christmas
Victor Adair
Precious Metals Decouple from Stock Market
At the end of July we wrote an article examining the relationship between gold stocks and general equities. We sought to understand the huge variance in performance between the two markets. Sometimes they trended higher together. Sometimes the gold stocks surged while conventional equities fell into a bear market. Both markets have endured bad bears at the same time. Is there any rhyme or reason to why such variation?
Here was our conclusion:
What can history tell us going forward? The key is the correlation. If gold stocks are trending higher with the equity market into a potential recession and bear market, then the gold stocks would remain positively correlated over the intermediate term. However, we can see that if the gold stocks are in a cyclical bear while the broad market is nearing a trend reversal or while the economy is nearing recession, then the gold stocks will remain negatively correlated. This is evident in three of the four previous examples.
Interestingly, two of those instances occurred during the second half of the 1960-1980 bull market. The equity market (Dow) is in blue while the Barron’s Gold Mining Index (BGMI) is in red.

Previously we referred to the decoupling as two separate points but in reality, the decoupling began in 1972 and lasted into early 1978. The above chart shows how the BGMI surged right as the DOW entered a cyclical bear market. When the DOW bottomed, the BGMI peaked.

Note how the BGMI bottomed in late 1976, just as the DOW’s recovery petered out. The decoupling didn’t end until early 1978.
Although no one (to my knowledge) has publicly discussed the current decoupling, it is clear and obvious for all to see. This decoupling began at the end of July 2011. Since GDX peaked, it is down 32% while the S&P 500 is up 25%. (Silver is down 32% and Gold is down 14%). Also, the S&P is closing in a five-year high while GDX is soon to retest a multi year low.

Going forward, we have the setup for an amazing contrarian opportunity. The trigger is an exacerbation in economic data and the general markets. As long as the markets are trending higher then Gold and gold stocks won’t get much of a bid. However, once markets lose momentum and the threat of increased policy becomes apparent, we will see precious metals confirm their bottom and resume their still fledgling cyclical bull. Now is the time to be vigilant but patient as these markets prepare to test their lows. Once these markets test their lows and flush out the weak bugs then that is the time to be a vulture. Speculators and investors are advised to carefully seek out the large or small companies which are poised for the best rebounds. If you’d be interested in professional guidance in uncovering the producers and explorers poised for big gains then we invite you to learn more about our service.
Good Luck!
Jordan Roy-Byrne, CMT
Jordan@TheDailyGold.com

U.S. stocks sold off late in the day to close at session lows on Wednesday as talks to avert a year-end fiscal crisis turned sour, even as investors still expect a deal.
The S&P 500 ended after a two-day rally that took the benchmark index to its highest close in two months. Defensive-oriented shares led the decliners, including health care and consumer staples.
Obama threatens veto
Boehner and Obama have each offered substantial concessions that have made a deal look within reach. Obama has agreed to cuts in benefits for seniors, while Boehner has conceded to Obama’s demand that taxes rise for the richest Americans.
However, the climate of goodwill has evaporated since Republicans announced plans on Tuesday to put an alternative tax plan to a vote in the House this week that would largely disregard the progress made so far in negotiations.
On Wednesday, Obama threatened to veto the Republican measure, known as “Plan B,” if Congress approved it.
Jobs, the Fed… and Silver
…some picks from this mornings 5 Minute Forecast
![]() We interrupt the Santa Claus rally in the stock market with this foreboding announcement: The businesses responsible for nearly all “job creation” in the U.S. economy are pulling in the reins.
We interrupt the Santa Claus rally in the stock market with this foreboding announcement: The businesses responsible for nearly all “job creation” in the U.S. economy are pulling in the reins.
As the unemployment rate is key to several factors, not least of which are Fed policy and the long-term price of gold, today we take a closer look…
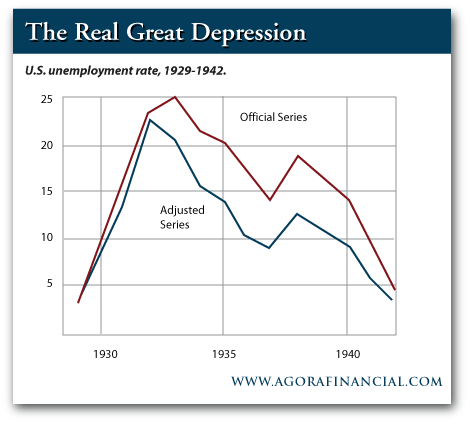
![]() Four years ago, the day before Election Day in 2008, we noted “the data point to watch [for whomever occupies the White House] will be unemployment. The real danger economically, socially or politically speaking in the ’30s was loads of young men without jobs.”
Four years ago, the day before Election Day in 2008, we noted “the data point to watch [for whomever occupies the White House] will be unemployment. The real danger economically, socially or politically speaking in the ’30s was loads of young men without jobs.”
Unemployment leapt up to 25% in a very short amount of time between the stock market bust in 1929 and 1934… the end of the official recession:
Now, five years after the start of the “official” 2007-09 recession, the real unemployment rate as charted by John Williams at Shadow Government Statistics remains stuck at 22.9%:
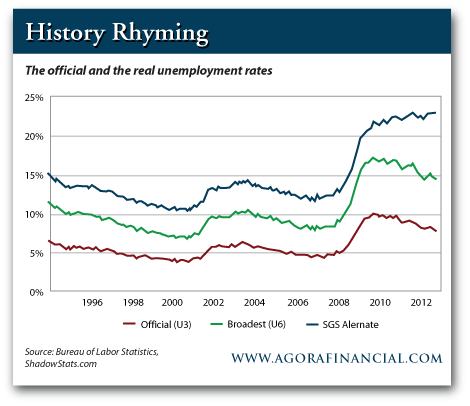
We might have been treated to a statistical reprieve during the campaign this year. We watched U-3 unemployment miraculously drop to 7.8%. But our forecast remains: As long as the quants can keep their grubby mitts off the figures, we expect unemployment to lurch its way back toward 10% before this time next year.
![]() Silver dropped to $31.18 yesterday, too. If you’re tracking the Midas metal’s less famous cousin, you can be forgiven for thinking it’s 2008 again — the price has been beaten down, but the actual metal is hard to come by.
Silver dropped to $31.18 yesterday, too. If you’re tracking the Midas metal’s less famous cousin, you can be forgiven for thinking it’s 2008 again — the price has been beaten down, but the actual metal is hard to come by.
The U.S. Mint has informed its network of dealers that inventory of 2012-dated Silver Eagles has been cleaned out… and the 2013 model won’t be available for order until Jan. 7. “This leaves a three-week void for the Mint’s most popular bullion offering,” Coin Update points out.
Silver Eagle sales to date this year total 33,742,500 — considerably less than last year’s record of nearly 40 million. Gold Eagle sales total 715,000 ounces so far in 2012 — the weakest pace since 2007.
[Ed. Note: Our friends at First Federal have already secured access to the coveted “first releases” portion of the Mint’s 2013 Silver Eagle issue. These beauties will be ready for shipment to your door as soon as they’re minted and certified MS70 by independent grading firm NGC. Get yours here.]
……..read more 5 Minute Forecast HERE
The world’s most famous bond investor, Bill Gross from Pimco is turning his back on long-dated country bonds in the US, UK and Germany for 2013, high-yield bonds and just as controversially hates bank and insurance stocks.
His picks for 2013 are: commodities like oil and gold, inflation-protected bonds, high-quality municipal bonds and non-dollar related stocks in the emerging markets. Mr. Gross has gotten himself into trouble in the past by being too bearish too soon on T-bonds but this former professional poker player has won far more often than he has lost.


-
I know Mike is a very solid investor and respect his opinions very much. So if he says pay attention to this or that - I will.
~ Dale G.
-
I've started managing my own investments so view Michael's site as a one-stop shop from which to get information and perspectives.
~ Dave E.
-
Michael offers easy reading, honest, common sense information that anyone can use in a practical manner.
~ der_al.
-
A sane voice in a scrambled investment world.
~ Ed R.
Inside Edge Pro Contributors

Greg Weldon

Josef Schachter

Tyler Bollhorn

Ryan Irvine

Paul Beattie

Martin Straith

Patrick Ceresna

Mark Leibovit

James Thorne

Victor Adair