
Timing & trends
Richard Russell has been bullish Gold since $250. He is also 88 years of age and has an enormous amount of experience with both Bull and Bear Markets, and how they unfold. He has been analysing, writing and advising his subscribers about markets in his Dow Theory Letters every business day for more than 50 years:
“Where’s gold going? — As you can see on the chart below, gold has formed an almost perfect rectangle. The top of the rectangle has been tested three times, and each time gold was turned back.”
“Obviously, there are some powerful groups (the shorts) that do not want to see gold move into and above the 1800s. At the bottom of the rectangle, gold has found support at approximately 1575.
For the last two weeks, gold and the dollar have moved in unison, which is most unusual. At the bottom of the chart we see the slow stochastics, which are in the neutral or middle zone. Since the bull market in gold is still in force, I would expect gold, ultimately, to break up and into the 1800 + zone.

One caveat — After rising for 12 years in a row, I expect the bull market in gold to produce a final upside blow-off. Bull markets don’t usually die with a whisper and a snore. Often prior to a final upward explosion, we will see a sharp correction, and I have expected something like that for gold. The final correction serves to clear the air and readies the market for a climactic rise.
One reason why we may not see the usual correction in gold is that most of the world’s central banks are now accumulaters of gold on any weakness. Both China and Russia are now eager buyers of gold — both have a small percentage of gold in their reserves.
It’s also significant that most Americans are afraid of gold, even though it has risen year after year for twelve years. Imagine the following a stock would enjoy if a given stock had risen twelve years in a row.
Since when does making money make one a sage? Ever since Warren Buffett bought a chunk of the Washington Post, he’s turned himself (or the media has turned him) into an oracle. Buffett says, yes, we should “tax the rich.” That doesn’t concern Buffett, who could drop a few billion and not know it.
Buffett may be a great company-picker, but when it comes to taxes and government, he’s no oracle in my eyes. Of course, I’m bitter. I bought ten shares of Berkshire at $250 a share and sold them when the stock hit $500. Who knew? Who ever knows? Actually, I bought the shares of Berkshire so I could read Warren’s annual report.
In the 1974 bear market, Berkshire’s shares dropped in half. I wonder how many BRK followers held their stock through the 1974 disaster?
Question –Why is gold the ultimate safe-haven investment?
Answer — Because gold is the only item that can’t go bankrupt. For thousands of years, gold has been treated as pure wealth.
Irony — The lust for gold opened up the American West. In 1849 men left their wives and families and homes and headed West in the hope of finding gold. Yet today, most Americans would not swap their intangible, unbacked dollars (Federal notes) for gold.
For a dozen years, Americans have turned their backs on an item that has risen to new highs each and every year. The stage is set for a huge reversal in sentiment. My intuition says the turn will come between now and 2015.”
To subscribe to Richard Russell’s Dow Theory Letters CLICK HERE.
Russell began publishing Dow Theory Letters in 1958, and he has been writing the Letters ever since (never once having skipped a Letter). Dow Theory Letters is the oldest service continuously written by one person in the business.
Russell gained wide recognition via a series of over 30 Dow Theory and technical articles that he wrote for Barron’s during the late-’50s through the ’90s. Through Barron’s and via word of mouth, he gained a wide following. Russell was the first (in 1960) to recommend gold stocks. He called the top of the 1949-’66 bull market. And almost to the day he called the bottom of the great 1972-’74 bear market, and the beginning of the great bull market which started in December 1974.
The Letters, published every three weeks, cover the US stock market, foreign markets, bonds, precious metals, commodities, economics –plus Russell’s widely-followed comments and observations and stock market philosophy.
In 1989 Russell took over Julian Snyder’s well-known advisory service, “International Moneyline”, a service which Mr. Synder ran from Switzerland. Then, in 1998 Russell took over the Zweig Forecast from famed market analyst, Martin Zweig. Russell has written articles and been quoted in such publications as Bloomberg magazine, Barron’s, Time, Newsweek, Money Magazine, the Wall Street Journal, the New York Times, Reuters, and others. Subscribers to Dow Theory Letters number over 12,000, hailing from all 50 states and dozens of overseas counties.
A native New Yorker (born in 1924) Russell has lived through depressions and booms, through good times and bad, through war and peace. He was educated at Rutgers and received his BA at NYU. Russell flew as a combat bombardier on B-25 Mitchell Bombers with the 12th Air Force during World War II.
One of the favorite features of the Letter is Russell’s daily Primary Trend Index (PTI), which is a proprietary index which has been included in the Letters since 1971. The PTI has been an amazingly accurate and useful guide to the trend of the market, and it often actually differs with Russell’s opinions. But Russell always defers to his PTI. Says Russell, “The PTI is a lot smarter than I am. It’s a great ego-deflator, as far as I’m concerned, and I’ve learned never to fight it.”
Letters are published and mailed every three weeks. We offer a TRIAL (two consecutive up-to-date issues) for $1.00 (same price that was originally charged in 1958). Trials, please one time only. Mail your $1.00 check to: Dow Theory Letters, PO Box 1759, La Jolla, CA 92038 (annual cost of a subscription is $300, tax deductible if ordered through your business).
IMPORTANT: As an added plus for subscribers, the latest Primary Trend Index (PTI) figure for the day will be posted on our web site — posting will take place a few hours after the close of the market. Also included will be Russell’s comments and observations on the day’s action along with critical market data. Each subscriber will be issued a private user name and password for entrance to the members area of the website.
Investors Intelligence is the organization that monitors almost ALL market letters and then releases their widely-followed “percentage of bullish or bearish advisory services.” This is what Investors Intelligence says about Richard Russell’s Dow Theory Letters: “Richard Russell is by far the most interesting writer of all the services we get.” Feb. 19, 1999.
Below are two of the most widely read articles published by Dow Theory Letters over the past 40 years. Request for these pieces have been received from dozens of organizations. Click on the titles to read the articles.

S&P 500 Technical Status
After the election the market dropped sharply as investors were eyeing the diffi culties of solving the fi scal cliff and the uncertainty of a resolution before year-end. The market soon refl ected the conclusion that perhaps it had overshot the situation and bounced off its support level at 1350 and rallied strongly into November month end. The S&P 500 is currently pushing up against resistance 1420 and is sitting on its 50 day moving average.

Most equity markets in the world and major sectors are recovering from oversold lows set on November 16th. Sectors with favourable seasonality are responding, but currently are overbought. Preferred strategy is to accumulate favoured sectors on weakness for a recovery rally that is likely to last at least until Inauguration Day.
Equity Trends
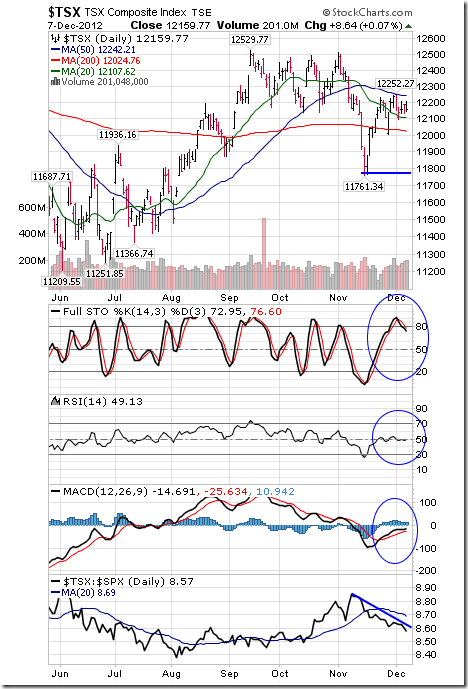
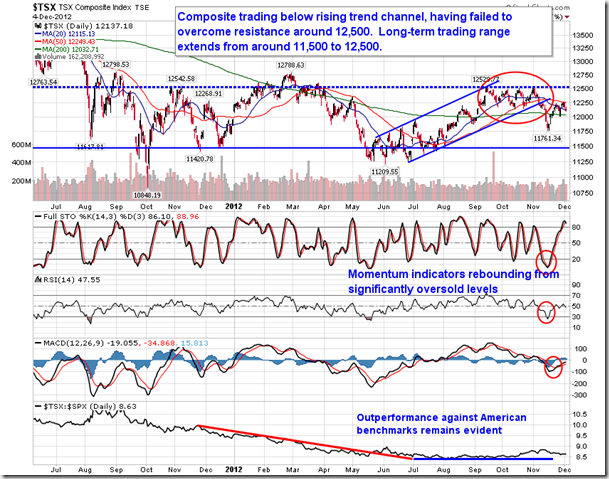
The TSX Composite Index slipped 79.59 points (0.65%) last week. Intermediate trend is down. Support is at 11,761.34. The Index remains above its 20 and 200 day moving averages and below its 50 day moving average. Short term momentum indicators are trending up. Stochastics already are over bought, but have yet to show significant signs of peaking. Strength relative to the S&P 500 Index remains negative.
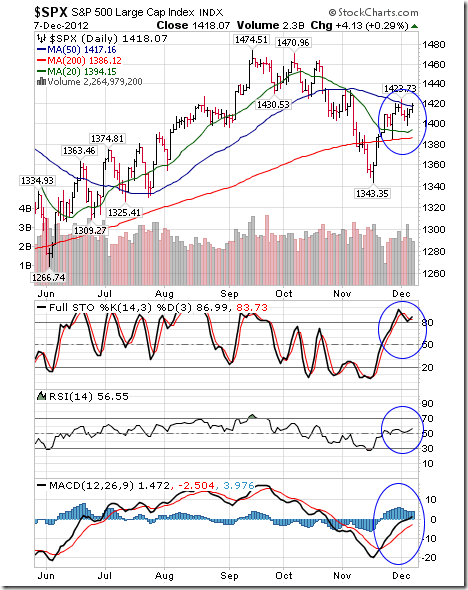
The S&P 500 Index added 1.89 points (0.13%) last week. Intermediate trend is down. Support is at 1,343.35. The Index remains above its 20 and 200 day moving averages and moved above its 50 day moving average on Friday. Short term momentum indicators are trending up. Stochastics already are overbought, but have yet to show significant signs of peaking.
The Dow Jones Industrial Average gained 129.55 points (0.99%) last week. Intermediate trend is down. Support is at 12,471.49. The Average remains above its 20 and 200 day moving averages and below its 50 day moving average. Strength relative to the S&P 500 Index has changed from negative to at least neutral.

Sectors with positive seasonality at this time of year continue to outperform the S&P 500 Index including Agriculture, forest products, industrials, technology, semiconductors, biotech, Europe, base metals, silver, platinum, lumber and copper.
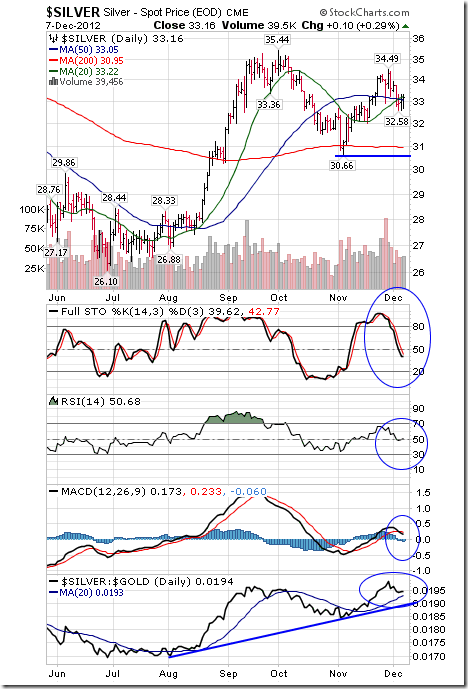
Silver gained $0.88 per ounce (2.73%) last week. Intermediate trend is neutral. Support is at $30.66 and resistance is forming at $34.49. Silver remains above its 200 day moving average and below its 20 day moving average, but moved above its 50 day moving average on Friday. Short term momentum indicators are trending down. Strength relative to gold remains positive.
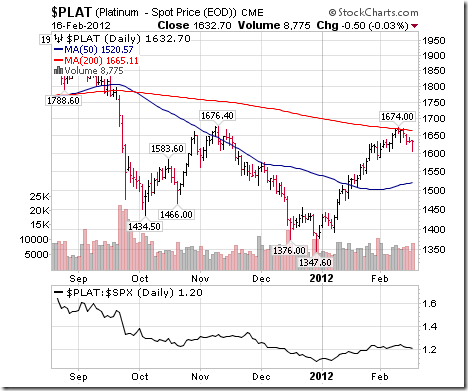
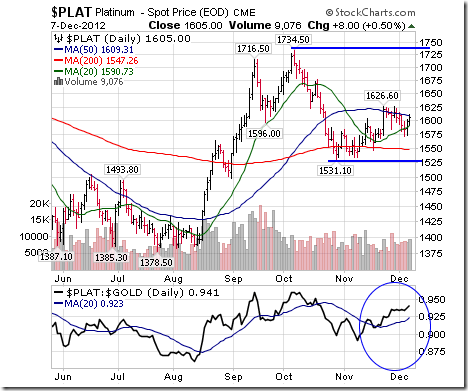
Platinum added $0.40 per ounce (0.02%) last week. Intermediate trend is up. The Index remains above its 20 and 200 day moving averages and below its 50 day moving average. Strength relative to gold remains positive.
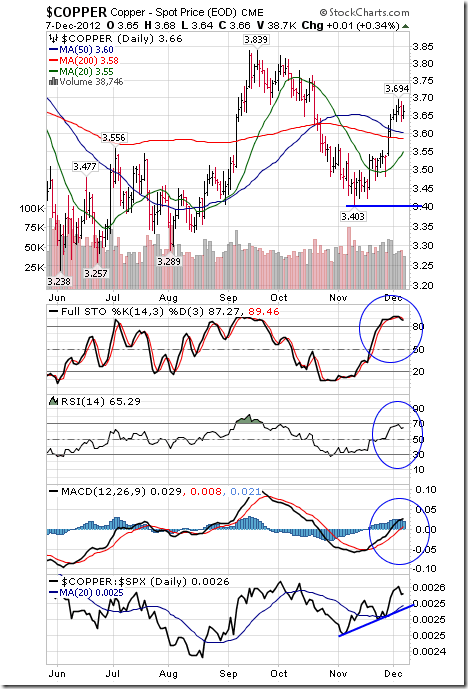
Copper added $0.01 per lb. (0.27%) last week. Intermediate trend is up. Support is at $3.403. Copper remains above its 20, 50 and 200 day moving averages. Short term momentum indicators are overbought, but have yet to show signs of peaking. Strength relative to the S&P 500 Index remains positive.
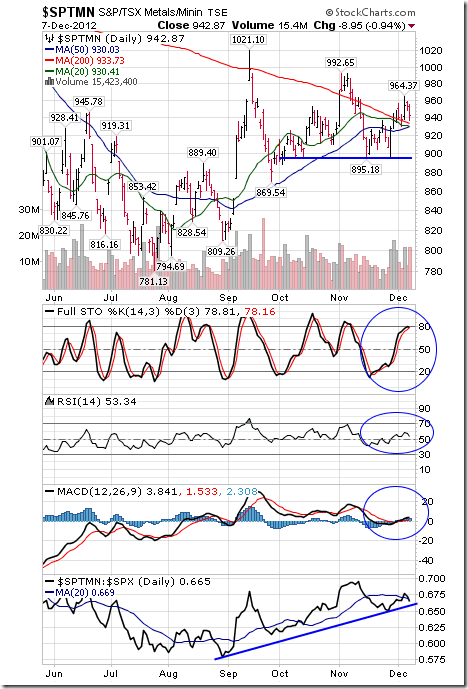
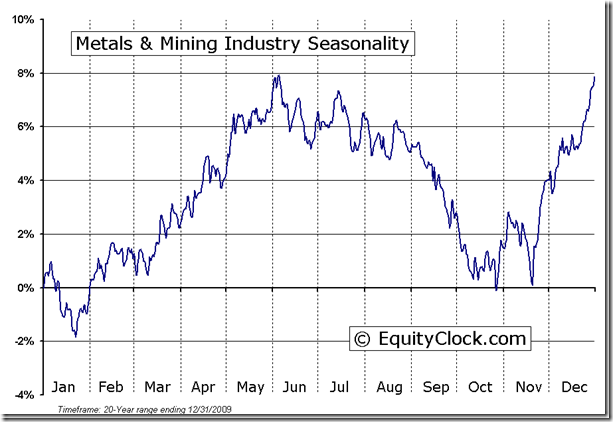
The TSX Metals & Mining Index slipped 1.95 points (0.21%) last week mainly on weakness in Freeport McMoran Copper & Gold following acquisitions of non-mining operations. Intermediate trend is neutral. Support is at 895.18 and resistance is at 1021.10. Short term momentum indicators are trending up. Stochastics already are overbought, but have yet to show signs of rolling over. Strength relative to the S&P 500 Index remains positive.
Other Issues
The VIX Index added 0.03 (0.02%) last week. It continues to hold above long term support near 14%.

Earnings news this week is not expected to have a significant impact on equity markets.
Short term momentum indicators for most equity markets and sectors are overbought, but have yet to show signs of rolling over.
Generally, U.S. economic news this week is expected to have a positive impact on equity markets. Positive events include the FOMC meeting release, retail sales, PPI, CPI, Industrial Production and Capacity Utilization. Greatest focus is on the FOMC meeting when information about extension of Operation Twist is expected to be released.
News outside of North America can have an impact on equity markets. Events in Syria have escalated to a level where news on a possible attack using biological weapons could shift focus. In Europe, Eurozone finance ministers meet on Wednesday ahead of the European Summit in Brussels this Thursday and Friday. Several economic data points were released by China last night, more are scheduled today and the next HSBC Flash PMI report is released on Friday. India’s Industrial Production report on Wednesday could provide a pleasant surprise.
On average, North American stock market performance in the second week in December has been neutral to slightly negative. The strongest period is the second half of the month when the Santa Claus rally usually occurs (particularly during U.S. Presidential election years). The rally normally continues until the first week in January.
…..much more (46 charts and analysis) HERE
Important Continuous Contract Seasonality & also Technical Analysis for the following:
Gold Futures, Silver Futures, S&P 500 & TSE Composite Index, Bond Market Futures, Oil Market Futures, Wheat Market Futures & Metals and Mining Industry Seasonality
Note: Under each Seasonal Study is a Technical Analysis Study contributed by Don Vialoux of Timing the Market. Seasonality is a useful analytical tool. Trades based on seasonality alone are profitable in say seven or eight times out of 10, but are unprofitable in two or three times out of ten. Better to use in conjunction with technical analysis and/or Fundamental analysis to again improve the odds.
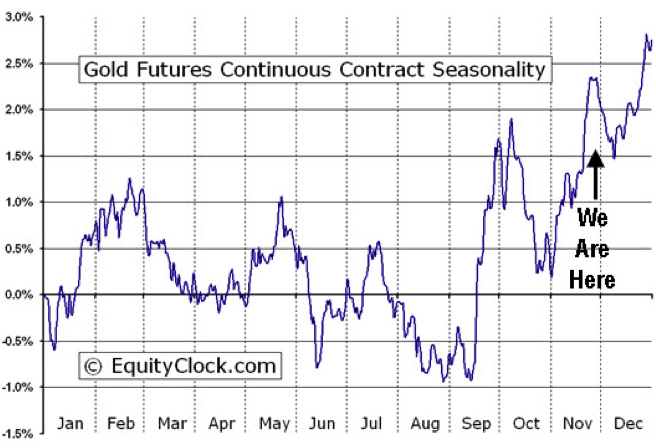
The above chart represents the seasonality for Gold Futures (GC) Continuous Contract for the past 20 years
Analysis has revealed that with a buy date of September 13 and a sell date of May 23, investors have benefited from a total return of 183.61% over the last 10 years. This scenario has shown positive results in 9 of those periods.
Conversely, the best return over the maximum number of positive periods reveals a buy date of September 16 and a sell date of May 20, producing a total return over the same 10-year range of 159.82% with positive results in 10 of those periods.
The buy and hold return for the past 10 years was 125.11%.
**Results shown are compounded
Technical Analysis of Gold
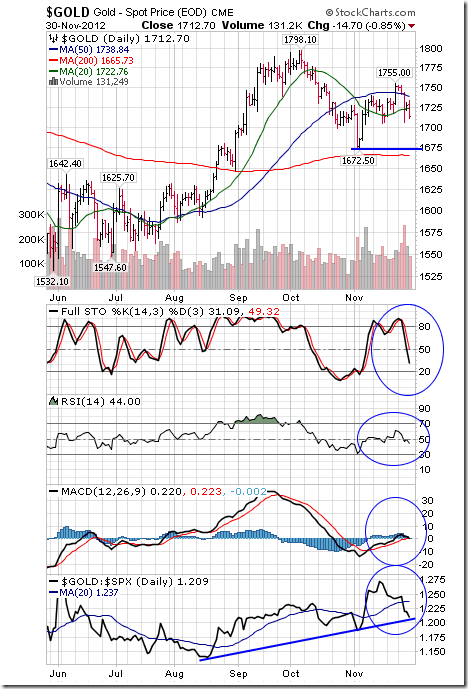
Gold fell $38.70 per ounce (2.21%) last week. Intermediate trend is up. Support is at $1,704.50. Gold remains above its 200 day moving average, but fell below its 20 and 50 day moving averages. Short term momentum indicators have rolled over and are trending down. Strength relative to the S&P 500 Index is positive, but showing signs of change.
Silver Futures Seasonality
The above chart represents the seasonality for Silver Futures (SI) Continuous Contract for the past 20 years.
Analysis has revealed that with a buy date of September 16 and a sell date of April 11, investors have benefited from a total return of 314.85% over the last 10 years. This scenario has shown positive results in 7 of those periods.
Conversely, the best return over the maximum number of positive periods reveals a buy date of September 14 and a sell date of September 23, producing a total return over the same 10-year range of 55.36% with positive results in 10 of those periods.
The buy and hold return for the past 10 years was 105.43%.
**Results shown are compounded
Technical Analysis of Silver
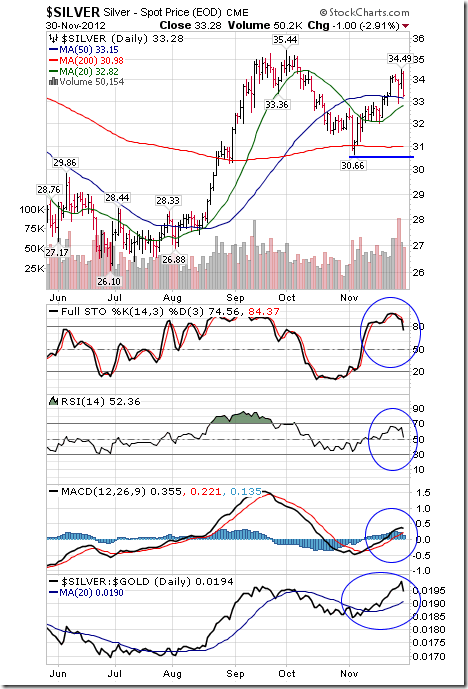
Silver fell $1.84 (5.39%) last week. Intermediate trend is neutral. Support is at $30.66. Silver remains above its 20, 50 and 200 day moving averages. Short term momentum indicators are overbought and showing early signs of rolling over. Strength relative to gold remains positive.
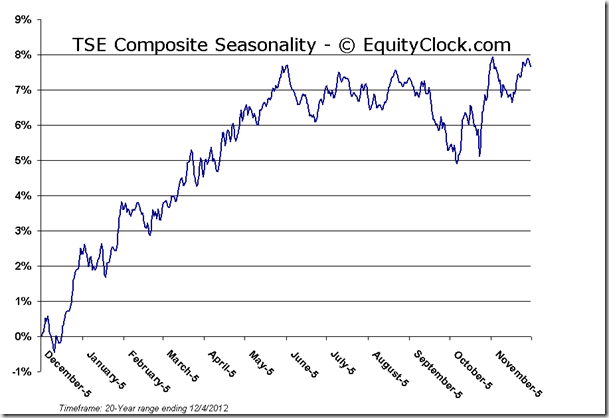
Seasonality & Technical Analysis of the TSE Composite
S&P 500 Index Seasonality
Analysis has revealed that with a buy date of March 9 and a sell date of June 4, investors have benefited from a total return of 85.05% over the last 10 years. This scenario has shown positive results in 7 of those periods.
Conversely, the best return over the maximum number of positive periods reveals a buy date of March 12 and a sell date of June 1, producing a total return over the same 10-year range of 79.65% with positive results in 9 of those periods.
**Results shown are compounded
Technical Analysis of the S&P 500
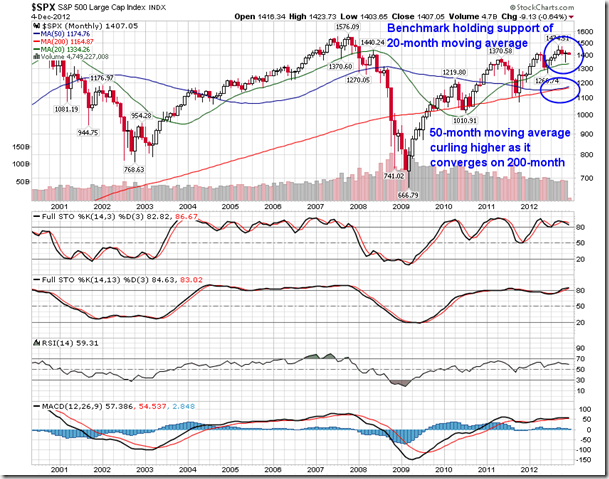
With little new to report on the daily chart of the S&P 500, we turn to the monthly chart to highlight the longer-term patterns. The large cap index is holding support at the 20-month moving average, having tested that level mid-November. The 20-month moving average continues to trend higher, although the slope of the curve is flattening. More interesting is the relation of the 50-month moving average compared to the 200-month moving average. The 50-month has been showing signs converging on the 200-month all year in what would amount to a bearish crossover should the two cross. The 50—month has been recently showing signs of curling higher precisely at the 200-month in a stubborn attempt to avoid what many are calling “the ultimate death cross.” A monthly death cross is extremely rare with the first and last having been recorded in 1934. The large cap benchmark subsequently produced a golden cross in 1946 with the 50-month moving average crossing above the 200-month and has remained so ever since. The two averages came close to crossing in 1978 during the 1966 to 1982 secular bear market. The S&P 500 hit a low of 87.45 at the beginning of 1978 around the time the two averages were about to converge and rallied higher by over 60% in the three years that followed to 140.52 by the end of 1980. Will this be another close cross followed by a rally higher? Only time will tell.
10 Year U.S. T-Note Bonds Futures Continuous Contract Seasonality
The above chart represents the seasonality for the CBOE Interest Rate 10-Year T-Note (^TNX) for the past 20 years. The values presented above are level figures, and as such should be viewed inversely to that of a regular seasonal chart. In this case, the peaks represent higher yields as a result of lower prices, and the troughs represent lower yields as a result of higher prices. The investment approach under these circumstances would be to invest at an indicated peak in yields when prices are low, and sell when the yields have bottomed.
Technical Analysis of the US 10 Year Bond
The yield on 10 year Treasuries fell 8.7 basis points (5.14%) last week. Its five month range remains between 1.548% and 1.892%. Short term momentum indicators are neutral.
Crude Oil Futures Continuous Contract (CL) Seasonality
The above chart represents the seasonality for Crude Oil Futures Continuous Contract (CL) for the past 20 years.
Crude Oil Futures Continuous Contract (CL) Seasonality
Analysis has revealed that with a buy date of December 24 and a sell date of August 21, investors have benefited from a total return of 344.86% over the last 10 years. This scenario has shown positive results in 9 of those periods.
Conversely, the best return over the maximum number of positive periods reveals a buy date of December 24 and a sell date of August 30, producing a total return over the same 10-year range of 331.05% with positive results in 10 of those periods.
The buy and hold return for the past 10 years was 60.62%.
**Results shown are compounded
Technical Analysis of Oil
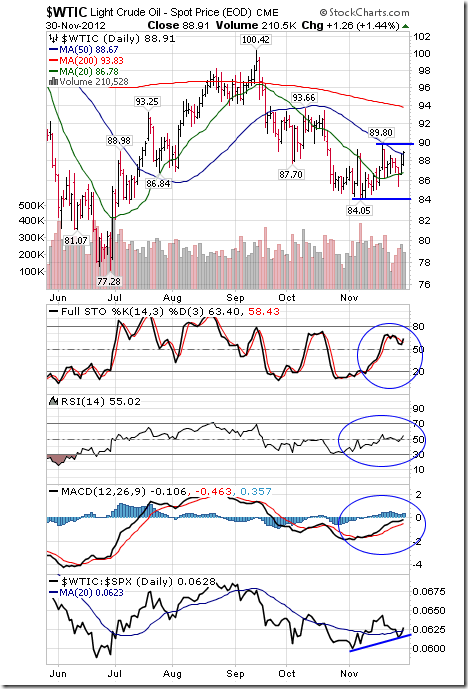
Crude Oil added $0.63 (0.71%) last week. Intermediate trend is neutral. Support is at 84.05 and resistance is at 89.90. Crude remains above its 20 day moving average and moved above its 50 day moving average on Friday. Short term momentum indicators are trending up. Strength relative to the S&P 500 Index remains positive.
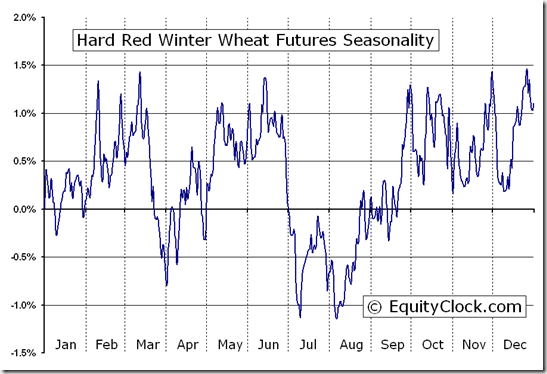
Wheat Futures Continuous Contract Seasonality
The above chart represents the seasonality for Wheat Futures (W) Continuous Contract for the past 20 years
Analysis has revealed that with a buy date of December 6 and a sell date of March 12, investors have benefited from a total return of 37.4% over the last 10 years. This scenario has shown positive results in 5 of those periods.
Conversely, the best return over the maximum number of positive periods reveals a buy date of December 6 and a sell date of January 2, producing a total return over the same 10-year range of 29.69% with positive results in 8 of those periods.
The buy and hold return for the past 10 years was -40.4%.
**Results shown are compounded
Technical Analysis of Wheat
Ed Note: I could not find an up to date Technical Analysis of Wheat. Will update as soon as I find it. This is what I could find:
The Agriculture ETF added $0.42 (0.81%) last week. Intermediate trend changed from down to neutral on a break above resistance at $51.93. Units remain above their 20, 50 and 200 day moving averages. Short term momentum indicators are trending up. Stochastics already are overbought, but have yet to show signs of peaking. Strength relative to the S&P 500 Index remains positive.
Special Free Services available through www.equityclock.com
Equityclock.com is offering free access to a data base showing seasonal studies on individual stocks and sectors. The data base holds seasonality studies on over 1000 big and moderate cap securities and indices.
To login, simply go to http://www.equityclock.com/charts/
Following is an example:
About Equity Clock
Equity Clock is a division of the Tech Talk Financial Network, a market analysis company that provides technical, fundamental and seasonality analysis on a daily basis via TimingTheMarkets.com and EquityClock.com. Equity Clock’s mission is to identify periods of reoccurring strength among individual equities in the market using methodologies presented by some of the top analysts in the industry, including that of Don Vialoux, author of TimingTheMarkets.com.
Feel free to use any of the content or seasonality studies (charts, timelines, or otherwise) presented as long as a link-back to this site at EquityClock.com is provided.
For further information on indicators used in reports presented on this site, please visit our reference page.

“there are numerous other structural headwinds that may reduce real growth even below the New Normal 2% rate that Bernanke has just confirmed, not only in the U.S. but in developed economies everywhere”.
 ….Bill Gross sees 4 Key Structural Headwinds going forward. They are:
1) Debt/Delevering
Gross’s Picks to Deal with those headwinds
- Commodities like Oil and Gold
- U.S. Inflation-Protected Bonds
- High-Quality Municipal Bonds
- Non-Dollar Emerging-Market Stocks
Gross’s Pans
- Long-Dated Developed-Country Bonds in the U.S., U.K. and Germany
- High-Yield Bonds
- Financial Stocks of Banks and Insurance Companies
William H. Gross
Managing Director

-
I know Mike is a very solid investor and respect his opinions very much. So if he says pay attention to this or that - I will.
~ Dale G.
-
I've started managing my own investments so view Michael's site as a one-stop shop from which to get information and perspectives.
~ Dave E.
-
Michael offers easy reading, honest, common sense information that anyone can use in a practical manner.
~ der_al.
-
A sane voice in a scrambled investment world.
~ Ed R.
Inside Edge Pro Contributors

Greg Weldon

Josef Schachter

Tyler Bollhorn

Ryan Irvine

Paul Beattie

Martin Straith

Patrick Ceresna

Mark Leibovit

James Thorne

Victor Adair