
Timing & trends
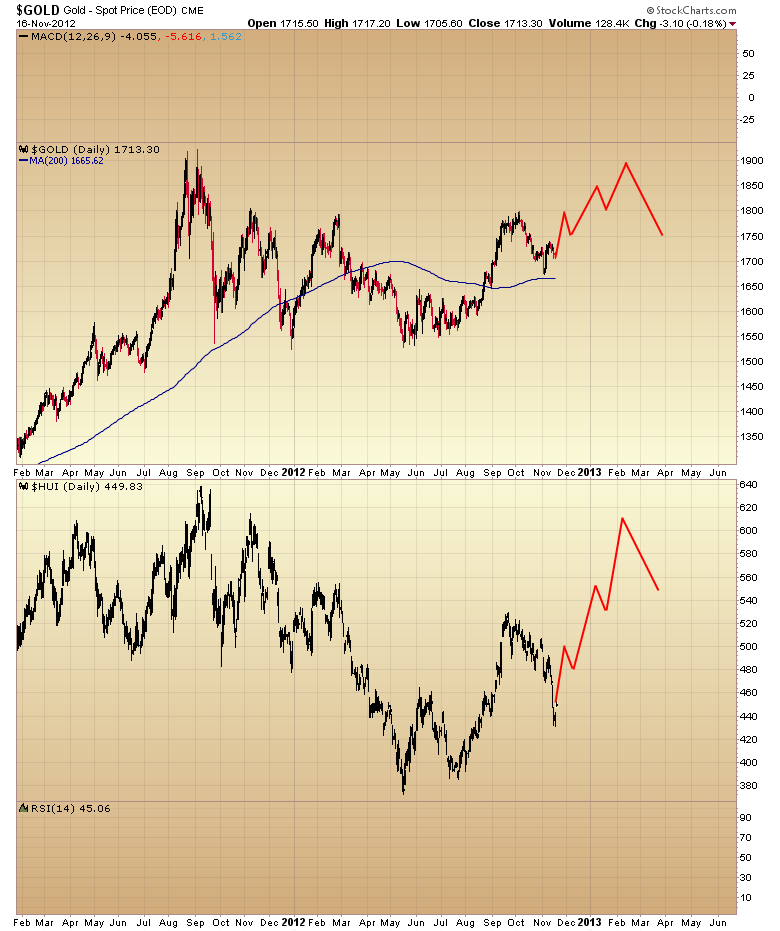
“Today should be the opportunity to get on board what is likely to be a significant rally over the next 3 weeks and probably a move to new highs over the next 2-3 months.
However I think the really big money will be made in mining stocks as gold should rally enough to make it’s first test of the all time highs at $1900. It’s not unreasonable to think miners will follow and test 640 during this time”.
“Typically the stock market will rally fairly aggressively out of one of these major intermediate bottoms, often gaining 6%-8% in the first 15-20 days. At that point the market will dip down into a half cycle low that will establish the trend line for this particular daily cycle”

….4 more charts and commentary HERE

In this commentary we’ll survey the intermediate-term to longer-term market terrain and Gold Relative Strength. This is especially important since we’re about to enter a new year, which the Kress cycle outlook describes as potentially dangerous from a financial market and economic perspective.
Investors have had no shortage of worries in November, including uncertainty surrounding the presidential race earlier this month, the upcoming “fiscal cliff” on Dec. 31, troubles in the Middle East, and the ongoing euro zone debt crisis. On the European front, Spain has still not asked for the European Central Bank (ECB) to purchase its bonds, while the Euro area finance ministers will not likely to make a final decision to release the Euro 31.5 billion of aid to Greece until Nov. 26.
In a bull market investors tend to ignore worries and focus on the positive news, namely expanding corporate profits. Bull markets on average tend to run about 3-4 years before becoming exhausted. The bull market which began in March 2009 was accompanied by a major recovery in corporate profits, which was part of a feedback loop that propelled equity prices higher in the last 3+ years. Corporate profit momentum is in the process of revering now, which means investors have one less positive to consider when evaluating equities.
From an investor psychology perspective, what does it mean when fear and worry feeds on itself and creates downside momentum? It means we’re entering a bear market, which was fated to happen at some point after the 4-year cycle peaked in October. On an interim basis it was confirmed when the NYSE Composite Index (NYA) decisively broke below its 60-day moving average.

Another indication that conditions have turned bearish on an intermediate-term basis is seen in the series of internal momentum indicators known as HILMO (Hi-Lo Momentum). As the name implies, HILMO is based on the rate of change in the daily 52-week highs and lows on the NYSE. Whenever all the main components of HILMO (short-, intermediate-, and longer-term) are in synch to the downside it shows that conditions have turned decisively bearish.
Of course this negative internal condition can, and most likely will, be reversed on a short-term basis. We’re entering a favorable timeframe for equities seasonally (December-January) and a year-end rally isn’t out of the question. The investor sentiment poll released last Thursday by the American Association of Individual Investors (AAII) showed the percentage of their members who are bullish were only 29 percent, while 49 percent were bearish. This net bearish reading is one of the highest in two years and suggests, from a contrarian standpoint, a short-term market bottom.

But what separates a normal, healthy market from the environment we’re now entering on a longer term basis is that the rallies will likely not be sustainable beyond a few weeks. The main trend for 2013, in contrast to the past year, will likely be down. This is especially true with the final “hard down” phase of the 40-year and 60-year Kress cycles upon us in 2013 and 2014.
Gold ETF
Our preferred gold ETF, the iShares Gold Trust (IAU), hasn’t yet confirmed a buy signal according to the rules of our trading discipline, but it has begun to show significant relative strength. Consider the following graph which shows the meaningful spike in the gold ETF’s relative strength in just the last few days. In most cases, a spike in the relative strength lineprecedes an upside move in the IAU. Accordingly we should soon have a confirmed immediate-term buy signal for the gold ETF.

Market Analyst
About Cliff Droke
Clif Droke is the editor of the 3-times weekly Momentum Strategies Report which covers U.S. equities and forecasts individual stocks, short- and intermediate-term, using unique proprietary analytical methods and securities lending analysis.He is also the author of numerous books, including most recently “Turnaround Trading & Investing.” Home of the infamous Durban Roodepoort Deep (DROOY/RGLD/MDG/XAU/HUI) report. Published online every trading day. Aimed at serious day & short-term traders of Durban Deep & followers of the XAU & HUI index. Posted online each evening by 9pm EST. www.clifdroke.com
PO Box 3401 Topsail Beach NC 28445-9831 USA
clif @ clifdroke.com
http://www.clifdroke.com/

Many investors believe that a fiscal cliff “dive” is inevitable.
Even with the prospect of a deal lifting the markets yesterday, I can’t say I disagree.
The blame game has already started and it’s highly unlikely that we’ll see anything other than more foolishness out of Washington. And so far all they have done is kick the can down the road to date.
So what can you do about it? Believe it or not, crises like these can be an ideal time to buy stocks. And gold. And oil. And certain kinds of bonds. And more.
The death of financial markets is almost always highly overrated.
Adding insult to injury, fiscal cliff or not, trying to time the markets is an exceptionally bad idea – 85% of all buy/sell decisions are incorrect, according to Barron’s. Further, Dalbar data shows that the return of an average investor trying to time the market is a pathetic 1.9% per year versus the S&P 500 return of 8.4% over the same time period.
Over 20 years, that’s the financial equivalent of taking a 342% hit in lost performance.
With that in mind, here’s a five-point plan for turning the fiscal cliff into an outstanding opportunity.
1) Get ready to go bargain hunting
 With Europe entering another recession and some parts of the world flirting with a protracted slowdown that’s going to be more like a managed depression, things couldn’t be more uncertain.
While I don’t personally like this reality any more than you do, from an investment perspective I’m very happy to pick through the oversold stocks and go bargain hunting.
Why?
Because history’s rearview mirrors show that fear, panic, crisis and stress are all classic signs associated with opportunity — and profits.
This is particularly true for choices related to energy, resources and certain kinds of technology – all of which the world needs, as opposed to wants, and all of which are backed by billions of dollars flowing their way whether we go over the fiscal cliff or not.
2) Stress test yourself
Never mind the big banks or Wall Street’s hooligans, take a good hard look in the mirror.
Many investors are completely unprepared for the psychological impact of our nation going over the edge. And you don’t want to be one of them.
….read the rest of 2, 3, 4 & 5 HERE
U.S. Stock Market – I have constantly resisted the cries from bears to come back ever since leaving the bearish camp in March 2009. It’s been my opinion that the least resistance was up, not down and the surprises shall be to the upside.
It would come as no surprise that last Friday ends up marking an important low and in this seasonally favorable week of trading, the “Don’t Worry, Be Happy’ crowd ramp up their yearly “Santa Claus Rally” talk (It helps that Santa Claus will be in the White House for four more years).
No Bah-Humbug from me!
Gold – For the umpteen time, the bloodied perma-bears have tried to break the back of the “Mother” of all gold bull markets and failed. Look for $1.745 to be taken out on a closing basis and then yet another challenge of key resistance around $1,800.
Mining and Exploration Shares – I think last week was an important low up and down the food chain. While it won’t be straight up from here, I do think we can say good riddance (fingers, toes and all other body parts crossed) to the horrific bear market of 2012
The comments above by Peter Grandich @ Grandich.com
Ed Note: The following comments and the short term chartwork on mining shares is from Don Vialoux’s monday report:
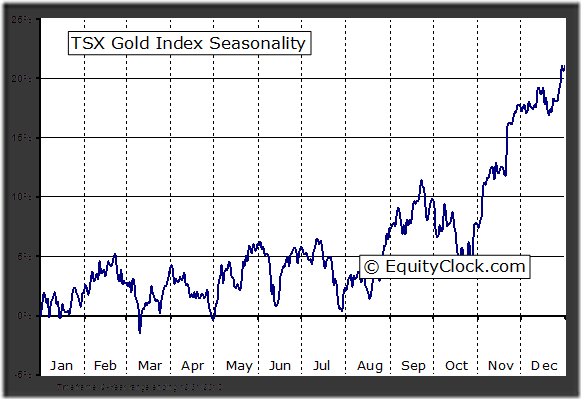
The TSX Metals & Mining Index dropped 44.47 points (4.66%) last week. Intermediate trend is neutral following a break below support at 910.32. The Index fell below its 20 and 50 day moving averages. Short term momentum indicators are trending down. Strength relative to the S&P 500 Index remains positive despite the loss last week. Seasonal influences start to become positive at this time of year.

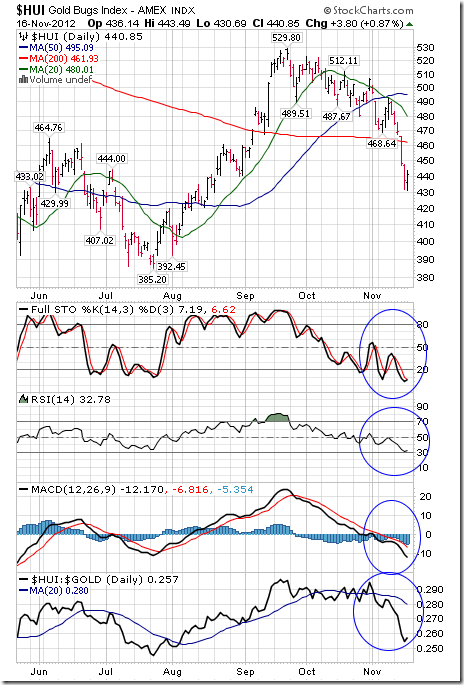
The AMEX Gold Bug Index dropped 40.36 points (8.84%) last week. Intermediate trend is down. The Index remains below its 20 and 50 day moving averages and fell below its 200 day moving average. Short term momentum indicators are oversold, but have yet to show signs of bottoming. Strength relative to gold bullion remains negative.
This past summer I was long risk assets in my short term trading accounts as the market climbed a “Wall of Worry.” I went to the sidelines August 21 as I sensed a top with the DJI at 5 year highs and the VIX at 5 year lows. I thought the market made a “Blow Off Top” Sept 14 (a Key Turn Date) following the global round of reflationary efforts from the authorities and I went short…thinking that Market Psychology could become increasingly negative over the next few months. As of November 16/12 Market Psychology has become very negative with the DJII down 800 points from last week’s highs to this week’s lows. ..a bounce is surely possible but I don’t think the downtrend is over. My previous weekly market comments are freely available at: www.VictorAdair.com/blog
I try to determine Market Psychology…if the market is bullish it’s easier to make money as a buyer…if the market is bearish it’s easier to make money as a seller. Since I’m more of a poet than an engineer my methodology is more art than science. Among other things, I look at the relationships of different markets to one another, I look at how the markets respond to news, I look at what’s popular and what’s not, and I certainly look at lots of charts.
In my public speaking and in this blog I’ve noted several Key Turn Dates…dates when a number of markets have turned more-or-less simultaneously…I see these Key Turn Dates as dates when Market Psychology reversed…for instance May 2/11, Oct 4/11, June 4/12, Sept 14/12. I trade off of these Key Turn Dates.
Over the years I have developed a number of trading and risk management “rules” (see: http://www.victoradair.com/how-be-better-trader.) One of those rules is to sync the time frame of my trading with my analysis…so I have my short term trading accounts and my long term savings accounts…which allows me to do different things, with different objectives, to suit my analysis over different time frames. In my trading accounts I am short the market, in my savings accounts I am heavily in cash…waiting out the post credit bubble deflationary collapse.
Inflation/deflation: Since the market crash in 2008 I have maintained that the reflationary fiscal and monetary efforts of the global authorities would be a rear-guard action, at best, against the tidal wave of private sector deleveraging. I think this trend will continue…BUT…if the markets take a serious leg lower over the next few months I expect we could see a MAJOR turn in the markets as the authorities REALLY ramp up their reflationary efforts…and if that happens then cash will truly become trash. If that MAJOR turn develops…and it may not…I will want to use some of the cash in my savings accounts to buy assets….for the first time in years.
Chart comment:

The CAD (and a number of other markets) had Key Turn Dates on June 4/12 and Sept 14/12. The Market Psychology on the CAD and on Canadian markets is determined more by events outside Canada that inside Canada.

The DJII had a Weekly Key Reversal higher June 4/12 and made 5 year highs in September 2012. Short term it may bounce but I think the downtrend has more to go. A break of the June 2012 lows could generate increased downside momentum.

I’ve thought that the highs of September 2011 around $1900 would be THE highs for a long time…last week we had a Weekly Key Reversal higher following the Obama win…I have to respect that, but if stocks and commodities gain momentum to the downside, and the USD is rising, gold will likely get pulled lower…but it should continue to make gains spread against stocks and commodities.

US (and Canadian) Long Term interest rates are at lifetime lows…it’s hard to imagine that they could go lower…but that’s the trend!

For the past few years many analysts have been forecasting that the Japanese Yen will fall…maybe, just maybe…it is finally starting to happen. If so, it could be a REALLY big move! That’s a very bearish monthly chart pattern.

-
I know Mike is a very solid investor and respect his opinions very much. So if he says pay attention to this or that - I will.
~ Dale G.
-
I've started managing my own investments so view Michael's site as a one-stop shop from which to get information and perspectives.
~ Dave E.
-
Michael offers easy reading, honest, common sense information that anyone can use in a practical manner.
~ der_al.
-
A sane voice in a scrambled investment world.
~ Ed R.
Inside Edge Pro Contributors

Greg Weldon

Josef Schachter

Tyler Bollhorn

Ryan Irvine

Paul Beattie

Martin Straith

Patrick Ceresna

Mark Leibovit

James Thorne

Victor Adair