
Timing & trends
If you own physical gold, gold mining stocks or plan on buying anything related to precious metals before year end, you are likely going to get excited because of what my analysis and outlook shows.
Since gold topped abruptly a year ago (Sept 2011) with a massive wave of selling which sent the price of gold from $1920 down to $1535, technical analysts knew that type of damage which had be done to the chart pattern could take a year or more to stabilize before gold would be able to continue higher.
Fast forwarding twelve months to today (Oct 2012). You can see that gold looks to have stabilized and is building a basing pattern (launch pad) for another major rally. The charts illustrated below show my big picture analysis, thoughts and investment idea.
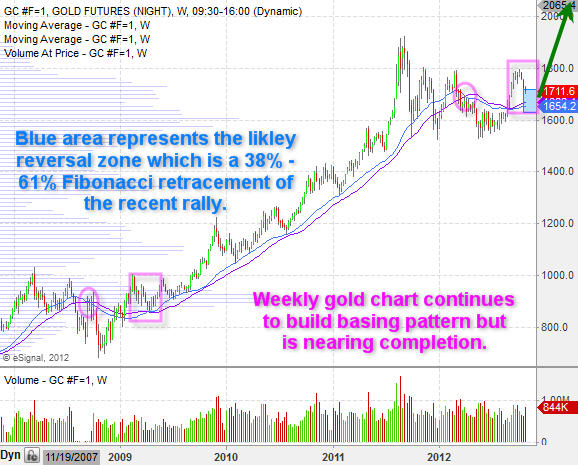
Weekly Spot Gold Chart:
The weekly chart can be a very powerful tool for understanding the overall trend. This chart clearly shows the last major correction and basing pattern in gold back in 2008 – 2009. Right now gold looks to be forming a very similar pattern.
Keep in mind this is a weekly chart and if you compare the 2009 basing pattern to where we are today I still feel it could take 3 – 6 months before gold truly breaks out to the upside and kicks into high gear. The point of this chart is to provide a rough guide for what to expect in the coming weeks and months.
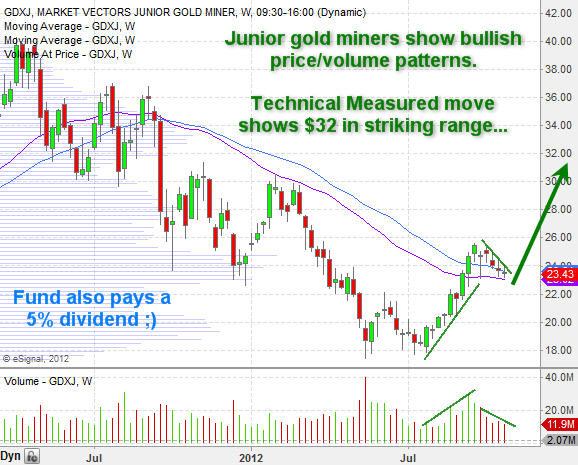
Weekly Chart of Junior Gold Miner Stocks:
If you follow gold closely then you likely already know junior gold mining stocks can lead the price of gold up to two weeks. Meaning gold mining stocks which you can track by looking at GDX and GDXJ exchange traded funds will form strong bullish chart patterns and generally start moving up in price before physical gold.
The chart below shows the junior gold miner ETF with a VERY BULLISH chart and volume pattern. Remember that gold stocks are a leveraged play on gold in most cases. For example, if gold moves up 1% we typically see GDX and GDXJ move 2-4%. Because they act as a leveraged play on physical gold smart money and big institutions start accumulating these investments in anticipation of gold rising.
GDXJ has formed a tight bull flag and the volume levels confirm there is big money moving into these investments. The first price target on GDXJ using technical analysis for a measured move points to the $32 area. Looking forward twelve months with gold trading above $2000 we could see this fund more than double in value.
Bonus: while most traders focus on GDX gold miner fund, I prefer the GDXJ fund because its almost identical in price performance BUT it pays you a 5% dividend…
Gold’s Seasonality:
It’s that time of year again where gold tends to move higher. Below you can see where we are and what the price of gold typically does in November.

Gold Investing & Trading Conclusion:
Looking forward one month (November) and factoring in the recent pullback in gold to known support levels along with strong buying of junior gold mining stocks, I feel gold will take another run at the $1800 level and for GDXJ to test its previous higher of $25.50 at minimum. If both those levels get taken out then a massive bull market for precious metals could be triggered. Only time will tell…
Get my Daily Trading Analysis & Trade Setups at: www.TheGoldAndOilGuy.com
Chris Vermeulen
Disclaimer:
This material should not be considered investment advice. Technical Traders Ltd. and its staff are not a registered investment advisors. Under no circumstances should any content from this website, articles, videos, seminars or emails from Technical Traders Ltd. or its affiliates be used or interpreted as a recommendation to buy or sell any type of security or commodity contract. Our advice is not tailored to the needs of any subscriber so go talk with your investment advisor before making trading decisions This information is for educational purposes only.

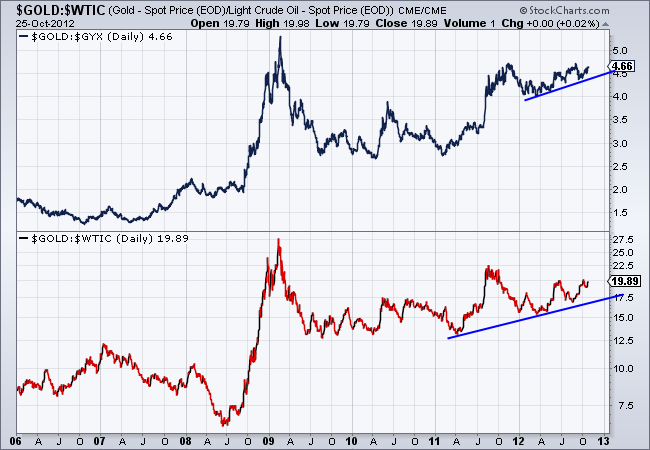
Longtime readers know that we are a fan of intermarket analysis. The movement of certain markets influences other markets so it is always wise to analyze a handful of markets rather than just a single market by itself. Several years ago we learned from others before us how intermarket analysis can help us get a handle on the margins of gold (and silver) miners. Generally, Oil (energy) represents about 25% of the cost of mining while industrial metals prices can be a proxy for the costs of trucks, chemicals and blasting agents (like cyanide). It has been a while since we’ve looked at these charts but with the gold stocks having put in a major bottom it is time to analyze whether it is sustainable or not.
Simply put, we look at Gold relative to oil (bottom) and Gold relative to industrial metals (top). These ratios were quite low in 2007 when share prices were driven more so by positive sentiment and high valuations then by positive fundamentals. As you can see, the financial crisis was a major catalyst for the gold mining industry. Gold surged against oil and industrial metals. During the weak recovery these ratios held their ground and are reaching higher levels once again.
Next, we want to look at these markets by themselves. Industrial metals prices are on top while oil is on the bottom. Do these markets appear to be any threat to move much higher? Industrial metals have substantial resistance at 500 and have made obvious lower highs and lower highs in the past year. GYX is threatening a move below 350. Oil has also made lower lows and appears far more likely to test $78-$80 then to rebound above $95.
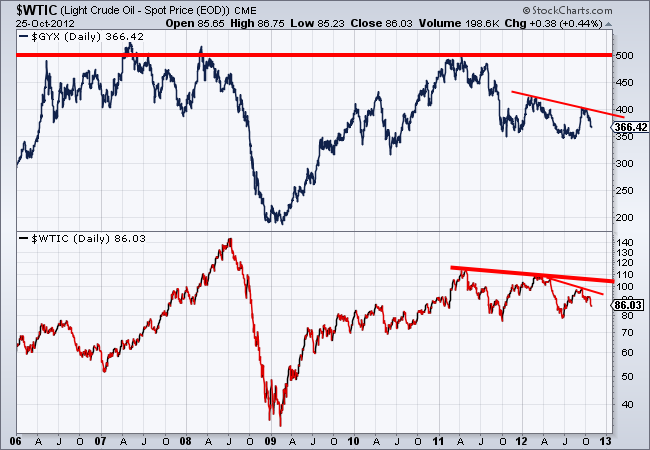
Meanwhile, Gold continues to hold up quite well within a consolidation. Predictably, its rebound ended at $1800. Yet, the market has a very strong bottom in place and has good support just below $1700.

As you can see, according to this simple straightforward analysis, Gold mining margins should continue to expand. The commodities that represent mining cost inputs are not only trending bearish but are little threat to move much higher anytime soon. Meanwhile, Gold is trading in a healthy range and once it breaks $1800 will be within a month or two of breaking to a new all time high.
In the early years of the boom, gold stocks performed quite well even as cost inputs surged. The reason was the market was willing to pay more and more for gold stocks. Presently we have a very different situation. The fundamentals for gold producers are improving yet the market is attaching low valuations to these companies. Our view is that if Gold breaks to and sustains a new high then the current valuations of these companies will increase materially.
All this being said, it is important to understand that gold mining is an extremely difficult industry. Despite this positive analysis, a fair portion of the industry will struggle. It is geologically and mathematically impossible for major producers to grow consistently. Small miners often lack the expertise and manpower to be successful. Most are aware of the 80-20 rule. We just returned from a tour of one of the best producer’s projects. We heard that this management team believes in the 95-5 rule. In other words, in the gold mining industry, 5% of the people produce 95% of the profits. You should keep this in mind when evaluating producers and potential producers. This is also why we focus on stock selection. In this sector, it is crucial to achieving great returns. If you’d be interested in professional guidance in uncovering the producers and explorers poised for big gains then we invite you to learn more about our service.
Good Luck!
Jordan Roy-Byrne, CMT
Jordan@TheDailyGold.com

Gold reacts more positively to post-election certainty and stability than to who’s in the office. With the presidential election only a few weeks away, the American electorate is being bombarded on an hourly and daily basis by information (some of it accurate, most of it not). With so much information out there, it can be very confusing for investors (as well as voters) to determine what’s relevant from what’s frivolous and what’s accurate from what’s misleading. In this week’s column, we will examine the current state of political and economic affairs and provide some insight into the coming election and what it means for your portfolio.
Before we delve into specifics, we have to ask the all-important question: Do presidential elections affect the markets? Unfortunately, while this is a straightforward question, the answer is not as simple as investors would like. For example, while studies show that the stock market performs better under Republicans during the first year after an election, studies also show that the market performs better during the overall four years under a Democratic president.
Specifically, markets increase 75 percent of the time under a Republican president versus 58 percent of the time under a Democratic president during the first year of office. However, during the total four-year term in office, markets perform better under Democrats than under Republicans by a factor of almost 2-to-1.
Those figures may change depending on several external factors. For example, it depends if the incumbent party loses or wins a second term. Markets decidedly favor stability and tend to perform much better during the second term of an incumbent president rather than the first term of an incoming president. Specifically, markets have historically increased by 15 percent if the incumbent president wins a second term versus a drop of 5 percent if the incumbent president loses.
So all in all, it would seem that markets favor incumbent Democratic presidents in the long term. However, this isn’t an exact science. There are so many other political factors that have to be taken into consideration, such as the political control of both houses of Congress, fiscal policy and budgetary planning.
The bottom line is that presidential elections do have an effect on the markets and your portfolio, but it is not an exact science. Therefore,we do not recommend taking portfolio decisions solely on the basis of presidential politics—it is an additional metric to use, but certainly not the only one.
Presidents, Commodities And Gold
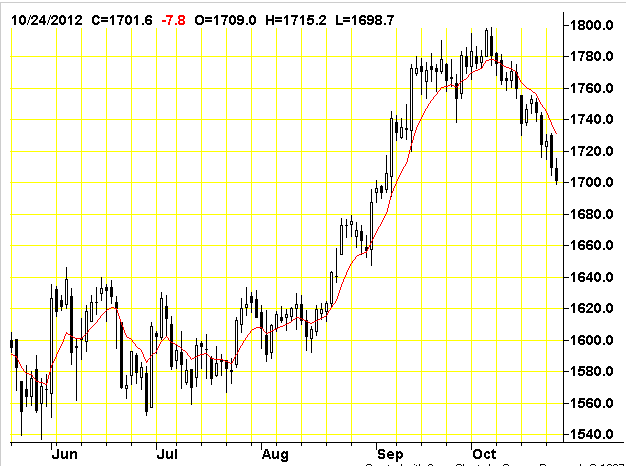
In addition to the broader stock market performance, the outcome of presidential elections may have a significant influence on commodities markets as a whole. Let’s take a look at gold. Over the last few election cycles, gold prices have tended to drop or stay flat during the election year, only to see positive performance throughout the rest of the term. Let’s take 2012 as an example. While gold prices are up 9 percent year-to-date, that’s primarily due to an almost 10 percent rise between the months of August and September. On the flip side, you see that gold prices have actually decreased by 3 percent since late September until now, less than two weeks from Election Day.
If history is an indication, now is a good time to start loading up on gold. If you missed the recent rally, then this may be the right time for you to jump back in. With the election so close, history suggests that gold prices will begin another uptrend soon after a winner is announced.
Gold markets—unlike the broader stocks and commodities markets—don’t discriminate based on which political party enters the White House. Rather, gold markets are more interested in stability and market visibility. This has been the case throughout the last decade and looks like it will be the case in this coming cycle as well.
At the end of the day, who enters the White House is important; however, it’s not as important as the actual policies that are implemented and which will have a broader effect on the economy and the markets. The astute investor will therefore analyze the fiscal policies and budget policies implemented by the president-elect to determine how those changes will affect their portfolio. While the election is a critical moment in time, the work done after the election is the deciding factor for markets.
Disclosure: The author doesn’t have any positions in the stocks mentioned.
 We have witnessed extraordinary events coming out of Greece. There is little doubt that its bonds are now rated as junk. However, there is a lesson to be learned from the 1931 Sovereign Debt Crisis. After each nation defaulted and was relieved of its debt, their economies reversed. Even Great Britain recovered before the United States once it was forced off the gold standard. An as for the United States, well when Roosevelt confiscated gold from the banks and devalued the gold relative to gold from, $20.67 an ounce to $35, the worst was over. Why do defaults and devaluations relieve the economy? Ironically, as long as capital hoards and people are not investing, they drive the value of the currency higher just as if they had bought stocks. In this case, they buy the currency, which reduces economic output further creating DEFLATION.
What we are looking at is Greece being the first to crack, should also be the first to start to recover. Look East to Greece and you shall know your fate. Those calling for a pending Great Depression fail to grasp the real mechanism at work. They tout gold and a Depression at the same time. This is simply not the way things move. Gold rose in purchasing power during the Depression because it was money. Today, it would decline under those conditions because it is not money. For gold to rise there must be INFLATION not DEFLATION and thus we cannot have austerity, depression, and rising gold. The system today is set for inflationary trends, not a Great Depression.

The Greek share market declined for 56 months. It is starting to come to life. Here are the Monthly Bullish Reversals to watch. Pay attention to Greece, for as she goes so will the rest of the world. The rise in tangible assets reflects that shift in PUBLIC to PRIVATE investment strategies. With government debt being the risky nonsense lacking any security, smart capital will shift toward the PRIVATE sector. As that takes place, you will see this index begin to generate Monthly Buy Signals.

Here is the Forecast Timing Array for the next year in the Greek General Index. This will give us a good perspective of when to pay attention. We will be looking at Greece and the Euro nations in detail at the Berlin Conference and will provide a special report on the region.
About Martin Armstrong
“In Armstrong’s view of the world where boom-bust cycles occur like clockwork every 8.6 years, what matters is his record as a forecaster. … He called Russia’s financial collapse in 1998, using a model that also pointed to a peak just before the Japanese stock market crashed in 1989. These days, as the European sovereign-debt crisis roils markets worldwide, he reminds readers of his October 1997 prediction that the creation of the euro “will merely transform currency speculation into bond speculation,” leading to the system’s eventual collapse.” – Ed Note: Much more HERE
 Excuse me if I sound like a pessimist today. I’m not. I’m actually an optimist about our country’s future. I’m also optimistic for the future of the global economy.
But I’m also a realist.
No matter who wins the U.S. presidential election come November 6 ― there is simply no way our country will ever make good on its gargantuan debts and pile of IOUs that now total as much as $212 trillion.
Washington could raise taxes to 100% of your income, and the debt still wouldn’t be paid off. They could slash spending to zero, and the debt would not be paid off.
The same applies to Europe. It’s drowning in debt and there is simply no combination of tax increases and austerity measures that will fix its problems, either.
So what’s the solution then? It’s actually very simple.
The world needs a new monetary system. New “rules of the game,” as central bankers like to call them.
Or a “new financial architecture” — the term used by many academics. A new “Bretton Woods.”
Thing is, that’s where we’re headed. Toward a new monetary system. But getting there won’t be easy.
Right now, for instance, the world is mostly caught up in competitive currency devaluations. No country wants a currency that’s too strong for fear it will hurt exports and aggravate deleveraging and deflation.
So the Fed prints money. Ditto for the European Central Bank. In fact, almost all major central banks are now printing money. They all think that money-printing will inflate away debt, cheapen their currency, revive exports and fix unemployment.
But the fact of the matter is that no amount of money-printing will solve any of those problems.
It’s not going to solve unemployment in the U.S. or in Europe. It’s not going to get rid of unpayable debts. It’s not going to fix unfunded pensions, Social Security, Medicare.
It’s not going to rescue Europe’s zombie banks and governments.
And it’s not going to build real wealth for anyone.
At best, all it will do is artificially inflate asset prices.
Meanwhile, the massive debts our country — and Europe — has will continue to mount. The cost of servicing the rising debt will become more and more burdensome.
And this will go on until the entire house of cards on both sides of the Atlantic comes crashing down.
We’ve already seen the first phase hit, and pass. We’re now in the middle of the eye of the storm, where there’s relative calm. But soon, the next phase, the next wave of the storm will hit.
It will be the worst phase of this great financial crisis. It will tear apart everything you thought you knew about the world, about your world, about your wealth, your children’s future, your grandchildren’s future.
It’s where gold will soar to well over $5,000 per troy ounce. Silver to over $150. Oil to near $200. Food prices to the moon. Interest rates surging. And more.
And then, when the house of cards finally comes crashing down, world leaders will finally get together to change the world’s monetary system to wipe out and forgive bad debts and to start anew with a fresh balance sheet.
I’ve discussed this before in a previous Uncommon Wisdom column and in my Real Wealth Report, and where the ideas I set forth went viral on the Internet, even appearing on Rep. Ron Paul’s (R-Texas) website.
I will reiterate them here: In the end, when it finally becomes apparent that no amount of money-printing, tax hikes or austerity measures will fix the sovereign-debt problems of Europe and the United States, world leaders will meet and agree to two basic steps for the foundation of a new world monetary system …
![]() Monetize most, if not all, of the Western world’s debt (temporarily sending gold to well over $5,000 an ounce).
Monetize most, if not all, of the Western world’s debt (temporarily sending gold to well over $5,000 an ounce).
![]() Create a new world reserve currency, tied to a commodity basket and administered by the International Monetary Fund.
Create a new world reserve currency, tied to a commodity basket and administered by the International Monetary Fund.
I also suspect that at some point, as far-fetched as it may sound, world leaders will also consider a debt-free banking system. One that mimics, at least in part, the Islamic banking system where Sharia law forbids usury and interest and, instead, works on the basis of “Profit-Loss Sharing,” or PLS. Put another way, the bank becomes your partner in your home or your business, instead of a lender.
We have a long road ahead of us. But as I said at the outset, I believe the crisis the world is going through will eventually give birth to a better world for all of us.
It just won’t be easy getting there. It will be a trip through hell.
Right now, most markets are still consolidating and looking like they will retest important support levels, as I have been expecting. Gold is starting to slide; so are silver, oil and many other commodities.
So while downside is still present, and there are opportunities to make money on the downside, never forget that there is one asset — bar none — that you should own for the longer term.
It’s gold. There is nothing better than gold. If you own gold already, hold, and wait for my signals to add more gold. If you don’t own gold, get ready to buy — either on a decline back to major support levels, or a full-blown breakout to the upside above $1,823.
Best wishes,
Larry
P.S. If you truly want to be positioned correctly in gold for its next lift-off to $5,000-plus, I strongly recommend you consider a membership to my Real Wealth Report. That’s where you will get every one of my timing signals to buy gold, silver, mining shares, resource-based income investments and more.
The price: A mere $89 year. Peanuts in the scheme of things. To join, simply click here now.
About Uncommon Wisdom
For more information and archived issues, visit //www.gliq.com/cgi-bin/click?weiss_uwd+0117202-7+UWD1172+vgbb@shaw.ca+%20%20%20%20%20%20%20%20++1+4422655++“>http://www.uncommonwisdomdaily.com
Uncommon Wisdom (UWD) is a free daily investment newsletter published by Weiss Research, Inc. This publication does not provide individual, customized investment or trading advice. All information is based upon data whose accuracy is deemed reliable, but not guaranteed. Performance returns cited are derived from our best estimates, but hypothetical as we do not track actual prices of customer purchases and sales. We cannot guarantee the accuracy of third party advertisements or sponsors, and these ads do not necessarily express the viewpoints of Uncommon Wisdom or its editors. For more information, see our//www.gliq.com/cgi-bin/click?weiss_uwd+0117202-10+UWD1172+vgbb@shaw.ca+%20%20%20%20%20%20%20%20++1+4422655++“>Terms and Conditions. View our //www.gliq.com/cgi-bin/click?weiss_uwd+0117202-11+UWD1172+vgbb@shaw.ca+%20%20%20%20%20%20%20%20++1+4422655++“>Privacy Policy. Would you like to //www.gliq.com/cgi-bin/click?weiss_uwd+0117202-13+UWD1172+vgbb@shaw.ca+%20%20%20%20%20%20%20%20++1+4422655++“>unsubscribe from our mailing list? To make sure you don’t miss our urgent updates, just follow these simple steps to //www.gliq.com/cgi-bin/click?weiss_uwd+0117202-12+UWD1172+vgbb@shaw.ca+%20%20%20%20%20%20%20%20++1+4422655++“>add Weiss Research to your address book.
Attention editors and publishers! Uncommon Wisdom content may be republished with a link to the full story onUncommonWisdomDaily.com. Such republication must include attribution with a link to the Uncommon Wisdom home page as follows: “Source: http://www.uncommonwisdomdaily.com“


-
I know Mike is a very solid investor and respect his opinions very much. So if he says pay attention to this or that - I will.
~ Dale G.
-
I've started managing my own investments so view Michael's site as a one-stop shop from which to get information and perspectives.
~ Dave E.
-
Michael offers easy reading, honest, common sense information that anyone can use in a practical manner.
~ der_al.
-
A sane voice in a scrambled investment world.
~ Ed R.
Inside Edge Pro Contributors

Greg Weldon

Josef Schachter

Tyler Bollhorn

Ryan Irvine

Paul Beattie

Martin Straith

Patrick Ceresna

Mark Leibovit

James Thorne

Victor Adair