
Timing & trends
Stock Market Trend & Cycles Show 6-12 Weeks of Weakness, plus US Dollar, Crude Oil, Natural Gas, Gold, Gold Miners, Silver and Bonds all carefully reviewed.
Click anywhere on Chart to or HERE to start the review:


These markets continue to frustrate the heck out of just about every kind of investor out there — whether you’re a buy-and-hold investor, an active trader, or even a day trader, or a scalper of the markets.
The markets continue to coil up in very, very tight trading ranges. It’s like watching paint dry. A lot of this has to do with the hesitation by investors to make any moves considering the still-ongoing crisis in Europe and now, very importantly, the upcoming elections, which are about two and a half weeks away.
Unfortunately, we may have to contend with this very sideways action for a couple more weeks. It’s lasted longer than I expected and it may last yet a little bit longer until we get the elections out of the way.
However, all of my economic models and my trading models do indicate that there have been no major trends changes at this point in time.
Now let’s go right to charts.
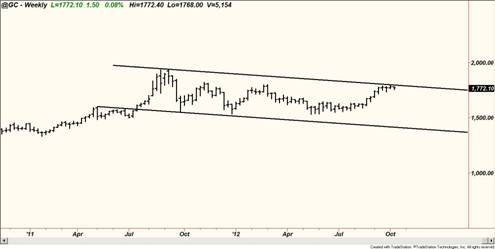
Gold: This is a weekly gold chart that I showed you in my last video update. As you can see, gold is still pressing up against channel resistance here, but it’s largely gone nowhere for the last three weeks.
The trading range in gold is tightening up — it’s roughly defined now by support at $1,750 and resistance at $1,805 and $1,823. And until we see a breakout above resistance or below support, there’s really nothing to do in gold and I urge you to stay away from it because you’ll just get chopped up.
Silver: Largely the same thing as gold. Silver has been going mainly sideways for the last week or so. It is still beneath overhead resistance but it is also still below the previous high back in February/March of this year and the previous high back in 2011, and, of course, its record high back at $50.
This overall is a bearish indication to me and I do believe silver is running out of steam like gold and we will soon see a turn to the downside.

The U.S. Dollar: The dollar is really tightening up in a very coiling type of range here.
This is a weekly chart of the dollar. It’s still holding support at this uptrend line here, but largely going sideways.
And that’s true of virtually all of the major currencies. They have really been going nowhere but sideways over the last couple of weeks, indeed the last month or so.
I’ve looked extensively at the cycles for the dollar over the last few days and they all point higher, which is why I remain bullish on the dollar.
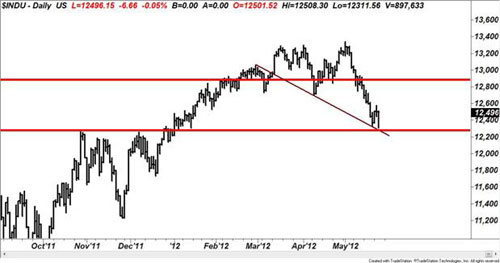
Dow Industrials: The chart of the Dow Industrials looks very much like gold — actually pushing up against upper channel resistance here but largely going sideways.
I’m afraid here, too, until we get the elections out of the way, we’re not going to see any decisive moves.
In short, I’ve said this before, there are three kinds of positions in the market: You can be long the market, you can be short a market or you can be on the sidelines. I strongly feel that right now is the time to be on the sidelines.
While it’s certainly not as exciting as being in a market, sideline-type of affairs where you’re sitting out the market waiting for high profit potential/low risk trades is often the best place to be. It not only preserves your capital, but it can also generate a return on your capital because you’re not taking unnecessary risks.
That’s it for today. Please stay tuned to everything. I’m sure we’re going to see some major progress and trending moves occur in all the markets soon — if not right before the election, certainly right after it.
Larry Edelson has over 34 years of investing experience with a focus in the precious metals and natural resources markets. His Real Wealth Report (a monthly publication) and Power Portfolio provide a continuing education on natural resource investments, with recommendations aiming for both profit and risk management.
For more information on Real Wealth Report, click here.
For more information on Power Portfolio, click here.

As I watched the debate between Romney and Obama I was amazed at how strong Romney was and how weak Obama was. Romney reminded me of Ronald Reagan, the way he cocked his head and nodded patiently while Obama talked, but especially the way he focused on his “Vision” of America. Ahead of the debate the polls had indicated that Obama would be re-elected…following the debate the polls indicate a very close race…which got me to thinking about how markets might react if Romney won…about how markets had reacted 32 years ago when Reagan won.
It seems to me that the two current candidates give voters a clear choice about what kind of government, what kind of America, they want…much like Carter and Reagan gave voters a clear choice back in 1980. Under Carter America was struggling in a post-Vietnam War era…inflation had been in the teens, Volker had raised interest rates sharply to “break the back” of inflation and a nasty recession had ensued…oil prices had skyrocketed, there were lineups at the gas pumps and Carter had appeared on TV in a cardigan sweater to ask Americans to turn down their thermostats to save energy…the Russians had invaded Afghanistan…in Tehran the American embassy had been overrun, American hostages in blindfolds were paraded for the media and the American government was powerless to get their people back. America seemed mired in malaise and the voters wanted change…Reagan was elected in a landslide and declared that it was, “Morning Again in America.”
I was in New York City on Reagan’s inauguration day, January 20, 1981. There were Yellow Ribbons everywhere, the hostages were flying home, the limos were 6 deep in front of the Waldorf Astoria and the city was positively buzzing…there had been a huge change in Crowd Psychology…America was on a roll…and the markets reacted.
Market reaction to the Reagan Victory:
The US Dollar: had been in a bear market since 1971 (and the pundits of the day had forecast that it was destined to become worthless.) Beginning in October 1980 the US Dollar index rallied from 85 to a high of 165 by Feb 1985..call it a double…it then fell all the way back to 85 by December 1987.
Gold: was trading around $600 – $650 when Reagan was elected in November 1980…it fell in half within 2 years.
Commodity prices: the CRB index peaked at all-time-highs in November 1980 then fell by 1/3 over the next 2 years.
The stock market: the DJI had its best monthly close in years following Reagan’s election in November 1980 and then traded marginally higher over the next few months, but it couldn’t decisively break through the “1000 point lid” that had been on the market since 1966 and it declined from the summer of 1981 to August 1982 when the “Greatest Ever Bull Market in Stocks” began.
Interest rates: yields on US Treasuries continued to rise after Reagan was elected with the long bond breaching 15% in September 1981…then bonds began a 30+ year bull market.
My current short term market view: I continue to see the September highs in stocks and commodities as a “blow-off top” following the latest round of “Q” from global authorities and I’m trading accordingly. I think there is a risk that Market Psychology may become increasingly negative during the next couple of months.

Victor Adair
Victor Adair is a Senior Vice President and Derivatives Portfolio Manager at Union Securities Ltd. Victor began trading financial markets over 40 years ago and has held a number of senior positions during his long career as a commodity and stockbroker. He provides daily market commentary on CKNW AM 980 radio Vancouver and is nationally syndicated on Mike Campbell’s weekly Moneytalks radio show. Victor’s trading focus is primarily on the currency, precious metal, interest rate and stock index markets and his clients are high net worth individuals and corporations.
You can reach Victor Adair at:
Article provided by:
Drew Zimmerman
Investment Advisor
Union Securities Ltd. | Vancouver, BC
Tel: 604-646-2031 | Fax: 604-646-2067
Email: dzimmerman@union-securities.com
Web: www.union-securities.com
Overall, Gartman sounds a less concerned message than many commodities investors—such as Jim Rogers—who argue that demand for various materials risks outstripping supplies in coming years, ushering in a crisis-ridden era featuring high prices in developed countries and food shortages in the developing world.
Noting that back in 1984, people were already predicting food shortages as well as oil supply constraints as population grew worldwide, Gartman said that what the world has seen instead is technological advancement that has enabled production to keep up with demand.
“We grow more grain now than we ever have and with far fewer farmers than we ever have,” he said.
What’s more, China and other emerging market nations are only now beginning to understand how to grow crops, so supply shouldn’t be a concern, as everyone suggests. That applies to oil as well, he said. “We will find much more crude oil in the ground. We have more reserves today than we did in 1984.”
Trouble Spots
Optimism notwithstanding, Gartman does have one overriding concern as he surveys global commodities markets: “What keeps me up at night is Nigeria.”
…..read Gartman’s whole analysis including his unique perspective on Gold. Gartman, who gets paid a lot of money for his advice also takes issue with prevalent views that the Federal Reserve is dangerously expanding its monetary base with its quantitative easing (QE) programs.. Read it all HERE

VRTRADER.COM Trial Signup: Use this month to kick our tires. Pay 50% for the first 30 days (No refund) and sample our Silver or Platinum service and then decide what works best for you. Just send an email to mark.vrtrader@gmail.com” or call 928-282-1275
Mark Leibovit’s Gold Letter, # 1 Gold Timer for 10 year period & #2 Gold Timer for 2011
IF YOU HAVE NOT SIGNED UP FOR THE LEIBOVIT VR GOLD LETTER, HERE IS YOUR CHANCE. THE October 5th EDITION IS HOT OFF THE PRESS. HERE IS THE LINK: WWW.VRGOLDLETTER.COM. YOU GET A 50% DISCOUNT FOR THE FIRST MONTH.
The Annual Forecast Model is now ‘on-line’ BUT YOU MUST SUBSCRIBE! It is a premium report. Call or email us today for a 50% discount.
Here is the link:
https://www.vrtrader.com/subscribe/index.asp
The Annual Forecast Model (The VR Forecaster Report) is published each and every year in early February and comprises Mark Leibovit’s proprietary cyclical forecast for the Dow Industrials and Gold. Don’t miss the opportunity to see this Report that projects market direction and/or important cyclical change points months in advance. We have called it our ‘Blueprint to the Future’. Unique to Mark Leibovit it has been published since the mid 1980s. Access to the report is provided via the website using the username and password provided to you

-
I know Mike is a very solid investor and respect his opinions very much. So if he says pay attention to this or that - I will.
~ Dale G.
-
I've started managing my own investments so view Michael's site as a one-stop shop from which to get information and perspectives.
~ Dave E.
-
Michael offers easy reading, honest, common sense information that anyone can use in a practical manner.
~ der_al.
-
A sane voice in a scrambled investment world.
~ Ed R.
Inside Edge Pro Contributors

Greg Weldon

Josef Schachter

Tyler Bollhorn

Ryan Irvine

Paul Beattie

Martin Straith

Patrick Ceresna

Mark Leibovit

James Thorne

Victor Adair