
Timing & trends
We are continuing to see a rather tight but volatile market, with all the markets literally coiling up in springs. It’s highly unusual for the September period to see such sideways, but volatile, tightening trading markets with volume in most markets literally falling off a cliff.
Ed Note: To watch it on video go HERE
So, I continue to be very certain that we are on the cusp of very big moves in many markets. And most likely, those moves will not be the moves you’ve seen recently.
I still remain bearish on gold, looking for a top in the stock market, and looking for a bottom in the dollar.
We are getting close to the point where there would be the potential for me to reverse those opinions, but we are not there yet. And I remain (convinced) with what my models are saying — which is to look for a top in gold, look for a top in stocks, and look for a bottom in the U.S. dollar.
Gold: As I wrote recently and you can see here on this chart, even (with) the latest rally — which occurred over Thursday and Friday of last week — gold has yet to take out its March 2012 high or its November 2011 high.
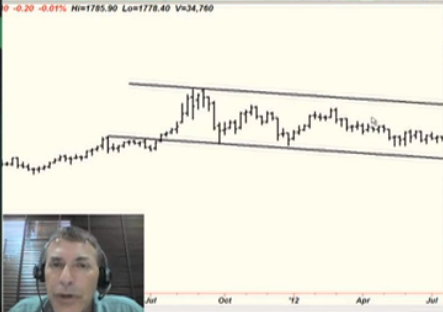
And given all the money-printing that’s going on — with China jumping in on the fray this past week — that’s pretty amazing.
That’s a subtle sign that we may be reaching a top here, and all this money-printing is not going to be the catalyst that sends gold to new record highs.
Ultimately, it will be — it was in the first phase of gold’s bull market. But we may have to wait for gold to really take off until the sovereign-debt crisis hits the United States. That’s the big atom bomb for the financial markets.
And we are not there yet. Most of the sovereign-debt worries are still, of course, focused on Europe.
Silver: Silver is pretty much the same. Silver hasn’t broken out yet despite all this money-printing. That’s somewhat not surprising because silver is more of an industrial metal; but nevertheless, silver has not broken out yet.
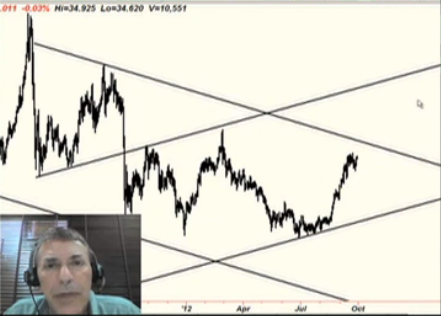
U.S. Dollar Index: The dollar is indeed trying to find a bottom in here. I believe it certainly will very soon. The euro has sold off rather sharply last week, and that’s lending support to the dollar. I’m starting to get some preliminary buy signals in the short- and intermediate-term for the dollar, so please stay tuned to my work there.
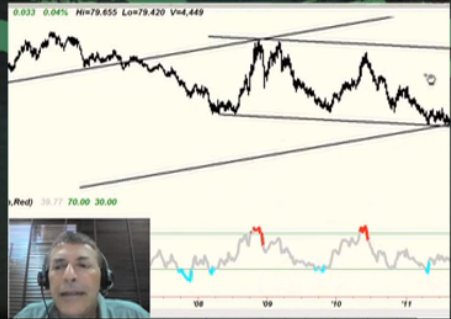
Dow Industrials: The Dow Industrials are starting to show some signs of weakness. This is a longer-term chart here. But you can still see we haven’t critically broken out yet. The Dow requires a close above the 14,200 level and we’re not there yet.

There’s nothing wrong with buying a breakout on the highs. In fact, that’s what you want to do. There are some times when buying low, so to speak, and selling high doesn’t work. There are times when it’s important to buy only breakouts, for example, of new highs.
Having said that, I believe we are really critically close to some major market turns in here.
So stay tuned to all of my work. Have a good week. This is Larry.
Larry Edelson has over 34 years of investing experience with a focus in the precious metals and natural resources markets. His Real Wealth Report (a monthly publication) and Power Portfolio provide a continuing education on natural resource investments, with recommendations aiming for both profit and risk management.
Larry Edelson has over 34 years of investing experience with a focus in the precious metals and natural resources markets. His Real Wealth Report (a monthly publication) and Power Portfolio provide a continuing education on natural resource investments, with recommendations aiming for both profit and risk management.
For more information on Real Wealth Report, click here.
For more information on Power Portfolio, click here.

INSTITUTIONAL ADVISORS
FOR A FREE TRIAL GO HERE
THURSDAY, SEPTEMBER 27, 2012
BOB HOYE
PUBLISHED BY INSTITUTIONAL ADVISORS
The following is part of Pivotal Events that was
published for our subscribers September 20, 2012.
RHETORICAL ECONOMICS?
SIGNS OF THE TIMES
“Copper Surplus Presents Puzzle” – Wall Street Journal, September 11
“US Median Income Lowest Since 1995” – Financial Times, September 12
The number is down 4.1% since Obama took office. Table follows.
“No one will speculate against the unlimited power of a central bank. This is what stabilizes currencies of countries where investors know that. One wouldn’t gamble against the Federal Reserve, for example.” – European Central Bank Governing Council, Bloomberg, September 13
This boast could soon be another example of hubris. Wikipedia has a nice definition:
“Hubris often indicates a loss of contact with reality and an overestimation of one’s own competence or capabilities, especially when the person exhibiting it is in a position of power.”
An earlier example occurred with the boast about a “Dream Team” of economists in December 2007.
“Fed’s Facebook Poll Finds Public Anger at QE3” – Mortgage Orb, September 18
* * * * *
PERSPECTIVE
Last week’s comments included that the action was becoming compulsive. That would be for assets on the upside and the USD on the downside. On the decline, momentum on the USD continued down to 19 on the daily RSI. Last week we noted that it was approaching the level that would limit the move.
It’s there, and in going the other way narrowing credit spreads (junk vs. treasuries) have reached 78.5 on the RSI. This is the highest since early 2010 when that level exhausted the play.
Conditions are getting stretched and one wonders about what the elastic modulus of a financial bubble is. In 2000 this page invented the term “gossamer” limit. Whatever – practical instruction is not too far away.
CREDIT MARKETS
There are times when market prospects can be downright daunting. Like now, and the emotional side can be compared to standing at the top of a Double Diamond ski run, or in a whitewater kayak going into a rapid that is a grade more severe than your comfort level. Another analogy is driving a sports car at the end of a long straight and going into a hair-pin turn. A big adrenalin rush goes with trying to brake later than the other guy.
Typically over hundreds of years, if something bad is going to happen it will happen in the fall, and recent financial action has been outstanding enough to be followed by a setback. This has been accompanied by convictions within and without the Fed that intervention can boost the markets, whenever needed. Many technical and sentiment numbers suggest that this attempt is in the market.
That the Fed and ECB have talked up their hopes so much suggests a new school – Rhetorical Economics.
As noted above, junk bonds and spreads have been very exciting–along with the dreadful sub-prime mortgage bond. The later has soared in price from a panicked 38 last fall to 61 two weeks ago. Looked like panic buying. After a two-days of no change, it has dropped to 59 today. A distinctive drop – looking like the “Eiffel Tower” pattern that ended the long bond rally in June-July. Quite likely the Fed will have little problem in buying $50 billion per month.
They might have to buy more, after all the Fed generously exceeded its authority to buy bonds in the 1929 Crash – by a factor of six!
Long treasuries have firmed a little as other asset classes are stalling out. This could continue, but they are vulnerable to disappearing liquidity this fall.
Most other classes of bonds are very vulnerable.
COMMODITIES
Soybeans took out the 1700 level on this week’s decline to 1630. This dropped the grain index (GKX) down to 492, taking out support at 496. This one is technically vulnerable.
Base metal prices (GYX) have recorded the sharpest rally in a decade. Sharp approximates straight up and the last, but less vigorous, example occurred in early 2008. This one has recorded a huge swing from oversold to very overbought at 84 on Friday and is offering some perspective.
The cyclical high in 2007 set a big “Head and Shoulders” pattern, with the Head at 537 in 2007, the Left Shoulder at 490 in 2006 and the Right Shoulder at 527 in 2008. The crash-low was 187 in early 2009.
The next and likely cyclical peak has been focused with the Head at 502 in 2011, the LS at 430 in 2010 and the RS at 428, earlier this year. For us, the cyclical peak was confirmed by the 346 low in early August.
This summer’s surge is virtually exhausted at the 400 level. As noted, this is part of the overall rise, with the Fed and the ECB accelerating it to a compulsion that is measurable.
Crude oil joined the party and a couple of weeks ago accomplished a Sequential Sell pattern. Ross thought it could run for a few more bars – and it did that and then some – the high was 101.4 Friday.
Tuesday’s 4-dollar drop in 30 minutes was an alert to change. Crude often rushes up and then suffers a sharp hit on the way to an intermediate decline.
Yesterday’s ChartWorks updated the pattern.
AMPERSAND
A number of items recorded a reversal on September 14 and then today brought a setback to global equity markets. Perhaps related to news of European commercial banks losing deposits.
Technically, the action over the past three weeks has been impressive in forming so many excesses in so many different items. Ross is working on the review and it definitely is a cluster of signals.
Often a number different price-series get excited at the same time – just before a change.
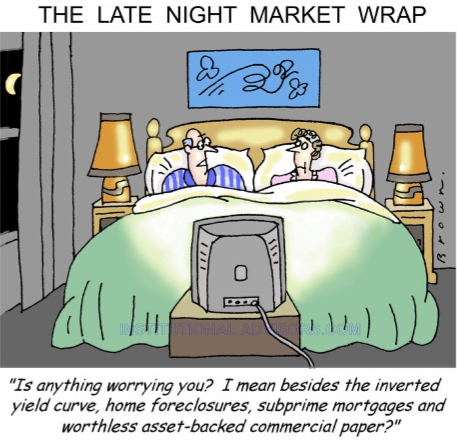
In September 2008, we published our “Cluster Cluck” cartoon. It could be appropriate now and it follows.
for a Free Trial go HERE
BOB HOYE, INSTITUTIONAL ADVISORS
E-MAIL HYPERLINK “mailto:bhoye.institutionaladvisors@telus.net” bhoye.institutionaladvisors@telus.net
WEBSITE: HYPERLINK “http://www.institutionaladvisors.com” www.institutionaladvisors.com

With some of the “Mind Boggling” numbers coming out of the United States, the mess in Europe and a Sovereign Debt Crisis on the horizon, Michael Campbell decided to ask what the legendary James Dines had to say about current conditions. Ed Note: You can also listen to the 43 minute exclusive interview between James& Mike right below if you prefer:
{mp3}Jamesdines_michaelcampbellsept22{/mp3}
James Dines: Q3 and the declaration that they are going to print money without limit primed the pump in my opinion and I’m now looking for a resumption of the Super Major Bull Market that I’ve been looking for since my major buy signal 11 years ago on September 25th, 2001. Gold has been up every single year for the last 11 years and there has been no other investment area that’s done as well. It is important to understand that with all this money being printed, Gold has no price. Gold is money. In each country it will sell for a different number of pieces of paper based on the amount that they print. In my interim bulletin of August 22nd/ 2012, I said I was looking for Gold and Silver to challenge their all-time highs, which means at least $1,900 for Gold and $50 for Silver. My initial target on Silver is $120 an ounce if they continue to print all that paper.
The problem is that there is no safety in this environment and its Delusionary to think that there is. When the currency itself is corrupt were can you hide. Maybe the only really safe place would be Gold and Silver on pullbacks because a coin of them made back even in Caesars time is still good anywhere in the World today. I think everyone should put a small amount of money into some Gold coins and put them, never on your person or near your residence, but in a bank or safety deposit box and preferably in more than one country. If you have more money than a small amount you can buy stocks also on pullbacks. They’ve had a big jump here and I am looking for a bit of a pullback before the next upwave.
About James Dines:

James Dines has become legendary for having made correct forecasts that were in complete contradiction to the rest of the financial community.
In an industry where it takes courage and conviction to go against the crowd, Mr Dines defiantly warned investors of the “invisible crash” that would bring down stocks in 1966, the unexpected gold boom of 1974, the Internet revolution of 1996, and the market top in 2000, a 2001 call for a Super Major Bull Market in Gold. Now he warns of “The Coming Uranium Boom” that is steadily approaching.
His subscribers to The Dines Letter have profited so much that subscriptions are handed down to second generations. – read more HERE
A leading precious metals consultancy, Thomson Reuters GFMS, has forecast that investors will buy record amounts of gold in the remainder of 2012. GFMS produces the benchmark supply and demand statistics for the gold market. GFMS forecasts that investors will purchase 973 tons of gold in the second half of 2012, more than during the wild gold market of the summer of 2011. This surge in demand for the yellow metal, GFMS says, will move gold above the $1850 an ounce level, not far from the record high of $1920 hit in September 2011.
GFMS may be right. This past week, gold hit its high for this year at $1790 an ounce on the back of the various global stimulus plans launched by a number of countries around the globe. Primary among the recently announced stimulus plans was the Federal Reserve’s QE3 or as some in the market have called it, QE infinity. Philip Klapwijk of GFMS said that, for the gold market, “QE3 has become talismanic”.
The Federal Reserve said it would purchase $40 billion a month in mortgage-backed securities indefinitely. In addition, the Fed will continue Operation Twist – the buying of longer-dated U.S. treasury notes and bonds. When all is totaled, the market is looking at about $85 billion a month in government bond purchases for an unlimited period of time.
The main characteristic of QE3 that drives the gold market is the fact that the open-ended purchases of all of these Treasuries will be financed by money that does not yet exist! And it’s not just about a fear of future inflation being ignited by all this money creation. It’s a very logical move higher by gold based on recent history of Fed actions and gold prices.
Even ignoring Operation Twist, the Fed will add $40 billion a month, or $480 billion a year, to its balance sheet. If one looks at the Fed’s own website, you will see that it shows current assets of $2.8 trillion. Add $480 billion annually to that and in about five years the Fed’s assets (the foundation of the money supply) will have nearly doubled.
That is exactly what happened in the last five years too…the Fed’s assets doubled. And in what should not be a surprise to gold investors, the price of gold also doubled! For the past decade or so, gold has tracked the increase in Federal Reserve’s assets. Do not be shocked if that pattern continues over the next five or ten years too.
Get my Trading Alerts and Pre-Market Analysis Videos EVERY DAY –www.TheGoldAndOilGuy.com
Chris Vermeulen
INSTITUTIONAL ADVISORS
THURSDAY, SEPTEMBER 20, 2012
BOB HOYE
PUBLISHED BY INSTITUTIONAL ADVISORS
The following is part of Pivotal Events that was
published for our subscribers September 13, 2012.
SIGNS OF THE TIMES:
“Organic Food Not Healthier Than Non-Organic: Study”
– Yahoo News, September 3
It’s about time, and we are looking forward to a study from high places that a gold standard is very much healthier than fiat money.
“China Iron Ore Prices Dropped 24% last month…to the lowest since October 2009.”
– Bloomberg, September 4
“Honduras Signs Deal to Create Private Cities”
– AP, September 5
“Investors face an ‘Age of Inflation’, which typically provides a headwind, not a tailwind, to securities prices – both in stocks and bonds.”
– Bill Gross, Bloomberg, September 5
Apparently, the term “Financial Asset Inflation” has yet to make to be fully understood by the chattering classes.
“French Unemployment Rose to a 13-Year High”
– Bloomberg, September 6
* * * * *
PERSPECTIVE
Now let’s think about the in-your-face announcement that the ECB is going to aggressively buy bonds out of the market. And then today’s Fed announcement to buy mortgage bonds added to the prospects of salvation through inflation. How will a deliberate short squeeze improve the condition of insolvent European countries?
But, it did take the dollar index down to 79.2 earlier today. This is below our target of 80.2 and is adding to the oversold. This has prompted rallies in a number of markets that are likely to be brief.
Why brief?
It’s that time of year and the action has become very compulsive.
COMMODITIES
First of all, the big drought-driven grain rally is over. For the season and likely for this business cycle. Last week’s “Sequentially yours” theme noted that wheat was the first to complete its topping pattern. That was in July and the next was corn in August and then last week soybeans needed to hold a certain price to record another “Sequential Sell” pattern. It did and the next step will be taking out 1700.
The overall index (GKX) set its price-high at 533 and this compares to 570 reached with our Momentum Peak Forecaster in March 2011. The Forecaster signal suggested most commodities were then setting a cyclical high.
Recently, the momentum-high was accomplished at 82 on the RSI in the middle of July. This was at the level that had ended a number of rallies over the past decade.
At 512, the index was up only 3 points today. Taking out 495 would turn the drought-rally into a downtrend.
Base metals (GYX) set their cyclical high at 502 in the spring of 2011. This was confirmed earlier this year when last fall’s panic low of 350 was taken out on the way to 346 in August.
Last week, we noted the “saucer” bottom and thought that the rebound could find resistance at as high as 389. So far the high has been today’s 393. Possibly important – the RSI reached 79 which has turned back all the rallies of the past two years.
Late in August, crude oil’s action completed a Sequential Sell and as Ross noted on August 30 the run could extend for a few more bars. This has been the case, and we are looking at some heavy crude oil action.
The couple of “more bars” has helped the CRB in reaching a good overbought at 74. This is close to the level that can end the move.
It is interesting that different commodity sectors are becoming overbought at the same time as the USD is becoming oversold.
CURRENCIES
The ECB policy short squeeze was given extra thrust by a court approval – and is being called the “Bazooka”. The term has been used in financial context for a while, but with the German court’s approval the term should be “Panzerfaust”, resulting in a jump in “wolatility”.
But it is volatility in the direction the market wanted to go, and now with the Fed’s announcement extended enough for a reversal. The USD slipped to 79.2 and to an RSI low of 23, which is close to the limiting level. But, when looking at the RSI 82 reached on the rally the action has accomplished a huge transit from overbought to oversold. In so many words, the Fed’s “elastic” currency is being stretched to the limit.
Going the other way, the Canadian dollar popped to today’s 103. This is a few “bars” beyond overhead resistance at 102 and the action is eligible for reversal.
STOCK MARKETS
Last week, we reviewed the negative divergence of declining A/Ds against the uptrend in the S&P. Mainly it records that fewer and fewer individual stocks are capable of keeping up to the leaders, which is typical of an important top.
The following chart shows that the timing is becoming somewhat late for the top in the index. The secondary high on the A/D was set on August 17 and has not been surpassed. Continuing negative divergence suggests the ultimate high on the S&P is pending.
Ross’s work on the VIX also shows a negative divergence typical of an important top. This indicator has yet to complete the signal.
Last week’s review noted that more of a spike up would fit the pattern, and thanks to today’s Fed announcement this is happening. The promise to buy $40 billion of mortgage-backed securities (MBS) a month reminds of central bank pledges to sell so many tons of gold per year into the lengthy bear market for bullion. That pathetic policy ended at 253 in July and August of 1999.
It is interesting that the sub-prime mortgage bond rallied to new high for the move this week before the news.
It is uncertain how long the speculative spike will last, but often such spikes are brief.
AMPERSAND
Bernanke’s remarks included the boast that Fed policy had created stable inflation over the past decade. That would mean CPI inflation, which calculation has been suspect since the Clinton revision. But financial asset inflation and volatility has become dangerous.
This cannot work out well, despite the belief that massive stimulus will revive the failing global economy. The 24 percent plunge the price of China’s iron ore price is a voice of opposition to Fed and ECB wishful thinking.
We can’t help but wonder about Romney’s statement that as president he would retire Bernanke from the Fed. Perhaps the MBS buying program is an attempt to help Obama, which would likely insure that Bernanke’s career as the great inflator continues.
* * * * *
“[The] 1901 [Bull market] was . . . speculative demonstration based . . . on the assumption that we were living in a new era; that the old rules and principles and precedent of finance were obsolete; that things could safely be done today which had been dangerous or impossible in the past. The illusion seized on the public mind in 1901 quite as firmly as it did in 1929. It differed only in the fact that there were no college professors in 1901 who preached the popular illusion as their new political economy.”
– Alexander Dana Noyes (1930)
Link to September 14, 2012 ‘Bob and Phil Show’ on TalkDigitalNetwork.com:
HYPERLINK “http://talkdigitalnetwork.com/2012/09/a-world-of-easing/” http://talkdigitalnetwork.com/2012/09/a-world-of-easing/
BOB HOYE, INSTITUTIONAL ADVISORS
E-MAIL HYPERLINK “mailto:bhoye.institutionaladvisors@telus.net” bhoye.institutionaladvisors@telus.net
WEBSITE: HYPERLINK “http://www.institutionaladvisors.com” www.institutionaladvisors.com
STOCK MARKET NEGATIVE DIVERGENCE
This model worked well going into the top of 2007.
It will likely be effective in seeing through current excitement.

-
I know Mike is a very solid investor and respect his opinions very much. So if he says pay attention to this or that - I will.
~ Dale G.
-
I've started managing my own investments so view Michael's site as a one-stop shop from which to get information and perspectives.
~ Dave E.
-
Michael offers easy reading, honest, common sense information that anyone can use in a practical manner.
~ der_al.
-
A sane voice in a scrambled investment world.
~ Ed R.
Inside Edge Pro Contributors

Greg Weldon

Josef Schachter

Tyler Bollhorn

Ryan Irvine

Paul Beattie

Martin Straith

Patrick Ceresna

Mark Leibovit

James Thorne

Victor Adair