
Timing & trends
Ed Note: The Godfather of newsletter writers, Richard Russell, had some absolutely extraordinary thoughts about life, the markets and gold. Here is what Russell had to say: “Most of the people in the world suffer from fear, anxiety, anger, guilt, bitterness, resentment, sorrow, depression, and various other emotions which can mar their lives. The majority of these emotions are holdovers from damaged or traumatic infancies.”
“I was brought up in the early 1920s. In those days parents were taught by doctors to feed infants by the clock, not when the infant was famished and screaming with hunger. In those days, infants were not tended and comforted when they needed warmth and attention. They were often tended by nurses and allowed to “cry themselves out,” thus leaving parents with plenty of free time of their own.
I had damaged parents, which affected me very negatively. My mother’s mother died in childbirth when my mom was two years old. So my mom grew up without a mother, and as a result, she knew nothing about mothering. My father’s father (my grandfather) committed suicide when my dad was 8 years old. As a result, my poor father was anxious, fearful, and nervous all his life.
Unfortunately, I absorbed the fears and anxieties of my parents, who had done the best they could, based on what they knew at the time. I grew up during the Depression, believing or feeling that the world was a harsh and unsafe place. As a result, I think I developed an extreme sensitivity to danger in the world and in the stock market. Interestingly, I think I kept my subscribers OUT of every bear market since the 1950s.
Let me go a bit further into my family history. My grandfather owned the biggest jewelry store in Charleston. He killed himself when he lost all his money in the awful panic of late 1902.
My dad’s half-brother (my uncle Irving) jumped out of the window of a New York hotel when the stock market crashed in 1929. Irving had a lot of stock in the family-owned City Stores. Irv was a playboy, and he lived entirely off his dividends. When City Stores cut its dividend in 1929, it was too much for Irving — so he killed himself.
With that sordid history, it’s kind of ironic that I ended up writing about the stock market. Strange, indeed, or is it?
December gold closed yesterday at 1770.60. If I was in GLD, I’d be fretting. But if I was solely in bullion coins, I wouldn’t give gold’s action a second thought. The reason I say this is because buying GLD is a trade, and holding gold coins is a move that theoretically is forever. For instance, if I had GLD, at some point I’d sell it, and hopefully show a profit.
But I don’t know when I’d ever sell the bullion coins. Sell them for what? For Fed-created fiat paper? Actually, I’d probably gift the coins to my kids, on the basis that it would be an easy transfer of wealth, much as some women gift their diamond engagement rings to their daughters.
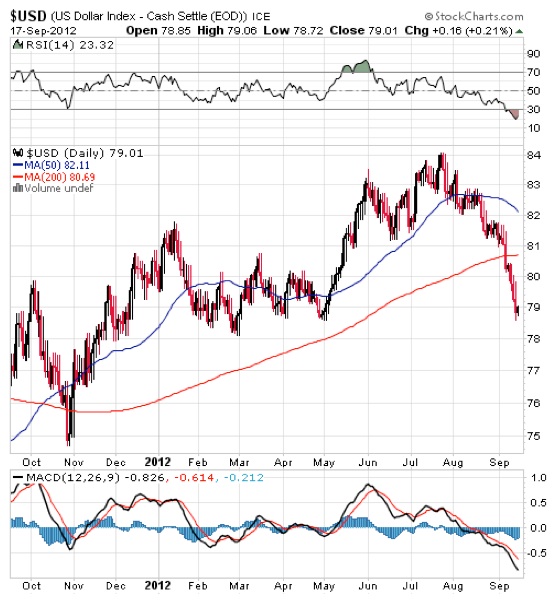
Below is the US dollar as per yesterday’s close. The dollar has broken below both MAs, and is sitting on support, which is around 78 3/4. RSI shows the dollar over-sold, but MACD allows for a further decline. Thank the Fed’s massive money-creation project for this chart, but what the heck, a cheaper dollar helps our exports.
But a cheaper dollar is also inflationary. Marc Faber states that the Fed is destroying the world with its wild printing, and I can tell you that Mr. Faber is really angry.
Awhile back, the “surest” way to make money was to short the Euro. When too many traders get on one side of an item (in this case, the short side), this is what can happen. A strong Euro means a weak dollar, and a weak dollar translates into higher gold. But we must be careful, because the Euro is in the overbought zone of RSI, and a lot of its strength may be coming from short covering.
INTERESTED IN SUBSCRIBING? GO HERE
Russell began publishing Dow Theory Letters in 1958, and he has been writing the Letters ever since (never once having skipped a Letter). Dow Theory Letters is the oldest service continuously written by one person in the business.
Russell gained wide recognition via a series of over 30 Dow Theory and technical articles that he wrote for Barron’s during the late-’50s through the ’90s. Through Barron’s and via word of mouth, he gained a wide following. Russell was the first (in 1960) to recommend gold stocks. He called the top of the 1949-’66 bull market. And almost to the day he called the bottom of the great 1972-’74 bear market, and the beginning of the great bull market which started in December 1974.
The Letters, published every three weeks, cover the US stock market, foreign markets, bonds, precious metals, commodities, economics –plus Russell’s widely-followed comments and observations and stock market philosophy.
In 1989 Russell took over Julian Snyder’s well-known advisory service, “International Moneyline”, a service which Mr. Synder ran from Switzerland. Then, in 1998 Russell took over the Zweig Forecast from famed market analyst, Martin Zweig. Russell has written articles and been quoted in such publications as Bloomberg magazine, Barron’s, Time, Newsweek, Money Magazine, the Wall Street Journal, the New York Times, Reuters, and others. Subscribers to Dow Theory Letters number over 12,000, hailing from all 50 states and dozens of overseas counties.
A native New Yorker (born in 1924) Russell has lived through depressions and booms, through good times and bad, through war and peace. He was educated at Rutgers and received his BA at NYU. Russell flew as a combat bombardier on B-25 Mitchell Bombers with the 12th Air Force during World War II.
One of the favorite features of the Letter is Russell’s daily Primary Trend Index (PTI), which is a proprietary index which has been included in the Letters since 1971. The PTI has been an amazingly accurate and useful guide to the trend of the market, and it often actually differs with Russell’s opinions. But Russell always defers to his PTI. Says Russell, “The PTI is a lot smarter than I am. It’s a great ego-deflator, as far as I’m concerned, and I’ve learned never to fight it.”
Letters are published and mailed every three weeks. We offer a TRIAL (two consecutive up-to-date issues) for $1.00 (same price that was originally charged in 1958). Trials, please one time only. Mail your $1.00 check to: Dow Theory Letters, PO Box 1759, La Jolla, CA 92038 (annual cost of a subscription is $300, tax deductible if ordered through your business).
IMPORTANT: As an added plus for subscribers, the latest Primary Trend Index (PTI) figure for the day will be posted on our web site — posting will take place a few hours after the close of the market. Also included will be Russell’s comments and observations on the day’s action along with critical market data. Each subscriber will be issued a private user name and password for entrance to the members area of the website.
Investors Intelligence is the organization that monitors almost ALL market letters and then releases their widely-followed “percentage of bullish or bearish advisory services.” This is what Investors Intelligence says about Richard Russell’s Dow Theory Letters: “Richard Russell is by far the most interesting writer of all the services we get.” Feb. 19, 1999.
Below are two of the most widely read articles published by Dow Theory Letters over the past 40 years. Request for these pieces have been received from dozens of organizations. Click on the titles to read the articles.
“Rich Man, Poor Man (The Power of Compounding)“


Crude oil prices hit a four-month high this week on the back of rising tensions in the Middle East and North Africa and the unfortunate murder of the U.S. ambassador to Libya. Added impetus on the upside was given to oil by the announcement of more money printing (QE3) by the Federal Reserve which said it would launch an open-ended commitment to purchase $40 billion of mortgage-backed securities monthly. The global benchmark for oil, Brent crude oil, jumped to about $117 a barrel. It maintained its roughly $18 premium to U.S.-based WTI crude oil which was trading at $100 a barrel on a couple days ago. Non-futures investors can easily participate in the oil market through the use of exchange traded funds. The ETF which tracks Brent crude oil futures is the United States Brent Oil Fund (NYSE: BNO) and the ETF which tracks WTI crude oil futures is the United States Oil Fund(NYSE: USO). The real story behind the story in the oil market, however, is the ongoing Arab Spring which is sweeping throughout the Middle East and North Africa, pushing aside some regimes and threatening others. The countries whose governments, such as Saudi Arabia and the other Gulf states, feel threatened by popular uprisings are where investors should put their focus. Saudi Arabia in particular is key because it accounts for more three-quarters of the world’s spare oil production capacity. So it is very important to note that the kingdom is no longer a price ‘dove’ in OPEC as it has been for decades. It has joined Iran, Venezuela and others in being a price ‘hawk’. The reason behind the change in attitude is simple…Arab Spring. Like its neighbors in the Gulf region, Saudi Arabia has gone on a public spending spree to appease its restless citizens. It has sharply increased outlays on subsidies for items like food, fuel and housing in an attempt to appease its citizens. In 2011, the kingdom raised its domestic spending by $129 billion – the equivalent of more than half its oil revenues. Much of this increased spending will go toward upgrading the country’s infrastructure. Take electricity, for example. Saudi Arabia has revealed plans to spend more than $100 billion dollars on power plants and distribution networks by 2020. The kingdom has also set a goal to electrify 500,000 new homes that are being built in an attempt to mollify political unrest among its population of 27 million people. This spending spree led the International Monetary Fund and other analysts to estimate that the kingdom and other Gulf countries need oil to be selling between $80 and $85 a barrel in order for the governments to balance their budgets. This is up, in Saudi Arabia’s case, from a mere $25 a barrel a few short years ago! Unfortunately for oil consumers, this trend looks set to continue in years ahead. According to the Institute of International Finance, by 2015 the Saudi government will only be able to balance its budget if oil prices are at $115 a barrel if current spending trends remain in place. So in effect, with the Arab Spring forcing governments to spend more on their citizens, it has put a floor under the price of oil. OPEC will do everything in its power to keep the price above the budget breakeven points for governments in the Gulf region. Keep up to speed on the oil and precious metals markets with my free newsletter: www.GoldAndOilGuy.com Chris Vermeulen

For all the analysis of the US ‘fiscal cliff’, eurozone sovereign debt crisis, Japan’s lost decades and China’s stalling economy, the biggest threat to global financial markets this autumn is the danger of a sudden strike on Iranian nuclear installations by Israel, most probably before the US presidential election.
The fear then is that Iran would attempt to close the Strait of Hormuz, the vital oil artery of the global economy with 18 million barrels of oil passing through this 34-kilometre wide stretch of sea.
At present there is an armada of ships from 25 nations conducting a mine sweeping exercise in the Straits, including three of the most powerful US aircraft carriers, each with more planes than the entire Iranian airforce.
Unpredictable consequences
Military experts are in no doubt who would win but wars are very unpredictable. The US over-ran Iraq in three weeks in 2003 but failed to adequately plan the occupation leaving the country highly unstable and in a virtual state of civil war.
Stock markets hit rock bottom in the spring of 2003 just before the invasion of Iraq and the Second Gulf War. That was the point of maximum uncertainty. Remember some then thought Saddam Hussein had weapons of mass destruction and nobody could be entirely sure.
This autumn many global stock markets have recovered to almost pre-global financial crisis levels, mostly without a full recovery in economic output. Arguably they are ripe for a fall.
As in 2003 the countdown to military action in the Gulf is just the sort of thing to put fear back into the markets. The most immediate impact is already being felt in the price of crude. Oil prices are at levels today that have tipped better global economies into recession.
Oil price impact
If Israel insists on making its attack on Iran then the price of crude will soar to levels beyond the peak of $147 a barrel in July 2008 that brought on the global financial crisis of that autumn after the failure of Lehman Brothers.
The stock market response will be to discount another major recession with very much lower share prices across the board. Hopefully whatever happens in this military action will not be anything like the worst case scenario and the bounce back for financial markets will be equally vigorous.
However, if you want to isolate the biggest threat to global financial markets this autumn it has to be an Israel-Iran conflict, something that the money printing of global central banks can do nothing to influence or contain.

Downside risk exceeds upside potential in equity markets during the next five weeks. The recent breakout by the S&P 500 Index implies that depth of the downside risk is less than previous. Selected seasonal trades continue on the upside (gold, energy, software) and downside (transportation). However, many of these seasonal trades reach the end of their period of seasonal strength this month. September is a month of transition. Trade accordingly.

“Mario Draghi and Ben Bernanke have willingly opened the floodgates and allowed their respective printing presses run 24/7. No surprise here. This is all Central Bankers know how to do and it had been forecast by many (myself included).”
“My Annual Forecast Model (below) along with Equityclock.com’s ‘seasonal’ studies all pointed to the time band from mid-summer forward as being friendly to the metals. So, for now, we need to sit back and enjoy it!”
“Depending on which forecast chart you look it, it is clear we’re overall headed higher. However, there is theoretical ‘cyclical’ risk of a pullback both here in September and again in October. Use pullbacks to establish or to add to current positions if you don’t feel you allocation to the metals is great enough.”

Quote & Chart above from Mark Leibovit’s Hot off the Press Sept. 14th 25 page VR Gold Letter . IF YOU HAVE NOT SIGNED UP FOR THE LEIBOVIT VR GOLD LETTER, HERE IS YOUR CHANCE. HERE IS THE LINK: WWW.VRGOLDLETTER.COM. YOU GET A 50% DISCOUNT FOR THE FIRST MONTH.
Miners Catching Up To Metals — Huge Run
Coming?
Gold bugs are a generally happy bunch this week. But they’d be a lot happier if precious metals mining stocks kept up with the metals themselves. Since early 2011 the largest gold miners have underperformed gold by about 40%, while the junior miners have done even worse (I’m talking to you, Great Basin).
Thanks to this divergence between the metals and the miners, it was possible to clearly understand the monetary destruction endemic in the developed world, conclude that gold and silver were the places to be, make a decisive bet on this thesis — and still end up losing money.
There are two possible conclusions to draw from this: Either mining as a business has changed fundamentally and will be unprofitable forever – in which case we should just own physical metal and forget about paper proxies. Or the past couple of years were one of those inexplicable divergences from established relationships that produce huge gains when they snap back to normal.
The past month has offered a taste of what the second possibility might look like. The chart below shows that the big miners (represented by the GDX gold miner ETF, red line) have outperformed gold itself (the GLD bullion ETF, blue area) since July. But the two-year gap, like I said, is about 40%, so parity is still a long way off.
Now that the miners have some momentum, it wouldn’t be surprising if they made up this ground in no time at all.

Above by DollarCollapse.com managed by John Rubino, co-author, with GoldMoney’s James Turk
Perspective on the current Dow rally
The Dow made another post-financial crisis rally high Thursday on the news that the Fed will embark on a third round of quantitative easing (a.k.a. QE3). To provide some perspective on the current Dow rally, all major market rallies of the last 112 years are plotted on today’s chart. Each dot represents a major stock market rally as measured by the Dow — with a rally being defined as an advance that followed a 15% correction (i.e. a major correction). As today’s chart illustrates, the Dow has begun a major rally 28 times over the past 112 years which equates to an average of one rally every four years. Also, most major rallies (78%) resulted in a gain of between 30% and 150% (29.8% to 150.5% to be exact) and lasted between 200 and 800 trading days (9.5 months to 3.2 years) — highlighted in today’s chart with a light blue shaded box. As it stands right now, the current Dow rally (hollow red dot labeled you are here) which began in October 2011 (since it followed a 16.8% correction), would be classified as well below average in both duration and magnitude.

Notes:
Where’s the Dow headed? The answer may surprise you. Find out right now with the exclusive & Barron’s recommended charts of Chart of the Day Plus.

-
I know Mike is a very solid investor and respect his opinions very much. So if he says pay attention to this or that - I will.
~ Dale G.
-
I've started managing my own investments so view Michael's site as a one-stop shop from which to get information and perspectives.
~ Dave E.
-
Michael offers easy reading, honest, common sense information that anyone can use in a practical manner.
~ der_al.
-
A sane voice in a scrambled investment world.
~ Ed R.
Inside Edge Pro Contributors

Greg Weldon

Josef Schachter

Tyler Bollhorn

Ryan Irvine

Paul Beattie

Martin Straith

Patrick Ceresna

Mark Leibovit

James Thorne

Victor Adair