
Timing & trends
One Emerging Bright Spot in the Gloomy Energy Sector
The energy sector is expected to see a 12% drop in earnings this quarter. But one segment — offshore drilling companies — is bucking the trend. And that’s where the next investing gusher could be.
For example, last month Noble Corp. (NE), the owner of the world’s third-largest offshore drilling fleet, reported that its year-over-year earnings shot up by 250%. Quarterly profits tripled, costly downtime decreased, and revenue grew with the debut of new rigs in Brazil and the Gulf of Mexico.
Demand for deepwater rigs is so strong that Noble and Diamond Offshore Drilling (DO) are already looking at 2014 deals. Production for 2013 is mostly booked at higher levels.
Diamond announced that Ocean Onyx, a rig under construction in Texas, will start a one-year contract with Apache Corp. (APA) in the third quarter of 2013.
The rate: $490,000 per day!
Demand Is Growing,
Giving Rig Builders Added Leverage
Last week Noble revealed a three-year deal for an ultra-deepwater drillship now under construction, in a contract that will average $618,000 per day starting in 2014 — making it one of the company’s most lucrative rigs.
What’s more, the normally reserved Swiss management forecasts a plethora of such deals in the near future.
And the sector leader, Transocean Ltd. (RIG), plans to sell up to $1 BILLION worth of rigs this year, as all the leading rig operators focus on improving their fleets. Fleet utilization at Transocean was 66% for this year’s second quarter, up from 61% in the first quarter.
Again, the rising pricing impact is not limited to just one company …
Transocean’s Deepwater Deep Seas drillship was hired byMurphy Oil Corp. (MUR) at $595,000 per day starting next March, in another sign of strong deepwater demand when compared with its previous $450,000 rate.
The shortage is driving acquisitions, too …
Ensco (ESV), the second-largest offshore drilling company in the world, announced its second-quarter results a few weeks ago. Benefiting from the acquisition of Pride International, the deal doubled Ensco’s net income from the prior year’s quarter. But there’s also room for further earnings growth by moving some of the newer rigs to higher-rate contracts.
So What’s Going On?
Just five years ago, it was widely believed that U.S. oil and natural gas production would follow a path of steady decline.
Now the Energy Information Administration (EIA) predicts that total U.S. liquids production will climb to 12.1 million barrels per day by 2025 — a 38% increase over the 2005 projection.
Several other countries in the Western Hemisphere, including Brazil and Canada, are also expected to post significant increases in oil output …
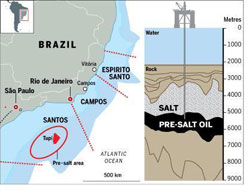
Tapping its recent discovery could prove Brazil’s greatest challenge.
Based on the EIA’s most recent projections, Brazil’s oil output should rise by 2.8 million barrels per day between 2009 and 2035. All the increase will virtually come from the pre-salt fields in the Atlantic, about 200 miles southeast of Rio de Janeiro.
But this is easier said than done as Brazil’s state-controlled oil company, Petrobras (PZE), admits …
These fields are located beneath a mile-and-a-half of ocean and another two miles of sand, rock and shifting salt layers.
Reaching them will require drilling technology even more costly and sophisticated than that used by BP Plc (BP), ExxonMobil (XOM) and other private firms in the Gulf of Mexico. And don’t forget there’s always the risk of a catastrophic blowout like the one that destroyed the Deepwater Horizon.
For Canada, the EIA projects the output from its Athabasca tar sands in the Alberta Province to jump from 1.7 million barrels per day in 2009 to 4.8 million in 2035, an impressive 180% increase.
The bottom line here is that the oil industry is struggling to find enough equipment to meet its surging production demand.
No wonder Atwood Oceanics (ATW) — which owns a small fleet of 10 mobile offshore-drilling units located in the U.S., Gulf of Mexico, South America, the Mediterranean Sea, West Africa, Southeast Asia and Australia — is running at 95% utilization!
That’s why I’m looking forward to Seadrill’s (SDRL) earnings release at the end of this month for more positive news. The Norwegian offshore oil rig operator won a deal potentially worth $4 billion for three of its drillships in the Gulf of Mexico. The deal was one of the biggest in the global rig industry.
My take on this is that offshore drilling companies will continue to be one of the bright spots in an overall gloomy sector, with day rates increasing and rig-utilization numbers growing.
And I plan on watching this segment of the energy market very closely.
Best wishes,
Rudy
Latin American Specialist
Rudy Martin is the former director of research for TheStreet.com Ratings.
In addition to his periodic contributions on this and other financial sites, Rudy writes a monthly newsletter The Latin Capital Market Report and is the editor of Weiss Research’s special report, The Greatest Riches in Latin America.
Earlier he worked 25 years in investment research and management positions with Fidelity Investments, Lincoln National, Dean Witter Reynolds and Transamerica Investments. He began his career as a securities investment analyst at Duff and Phelps where he published equity and fixed income securities investment recommendations. Martin holds a master’s degree in finance from Kellogg Northwestern University.
For more information about Rudy Martin and The Latin Capital Market Report visitwww.latincapitalmarket.com
Rudy appreciates your feedback; click here to send him an email.

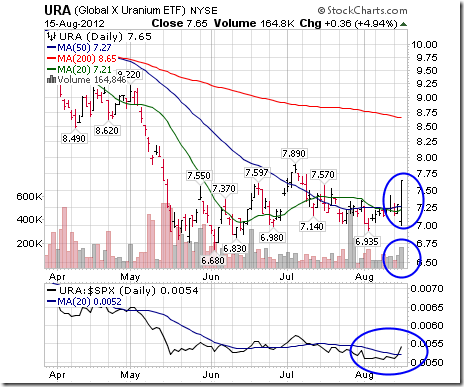
For starters, here’s an Interesting Chart:
The uranium ETF came alive yesterday. Nice break to the upside on higher volume, a move above its 20 and 50 day moving average as well as early signs of outperformance.
Mark Leibovit’s Recommended List Changes
Bulletin
Adding UEC and NLR (both uranium plays) to the recommended list at the market. I know we’re weighted heavily in uranium, but I’m looking for some further diversification. We already own URRE, USU and DNN.
Stop 1.75. Target 3.75 in UEC.
Stop 13.00. Target 18.00 in NLR.
Gold
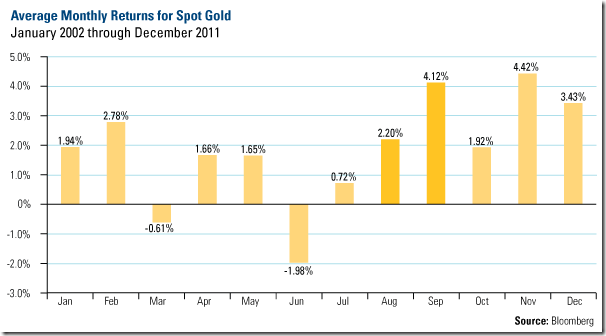
“So while gold has its monthly ups and downs, you can see that, on a historical basis, we have arrived at gold’s peak performance period of the year. Based on 10 years of data, gold bullion has historically increased 2 percent in August and 4 percent in September.”
– Frank Holmes
Source: BullionBuzzeNewsletter
Yesterday, Gold moved above its 20 and 50 day moving averages.

Yesterday, Gold moved above its 20 and 50 day moving averages – Don Vialoux
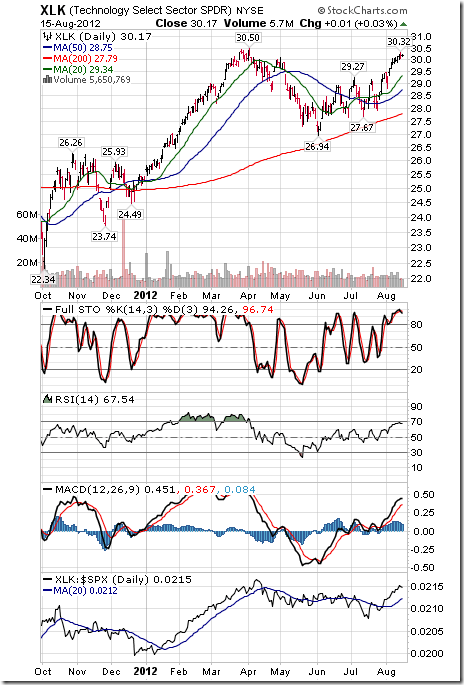
Weekly SPDR Select Sector Review
Technology
· Intermediate trend is up.
· Units remain above their 20, 50 and 200 day moving averages.
· Short term momentum indicators are overbought, but have yet to show signs of peaking.
· Strength relative to the S&P 500 Index remains positive.
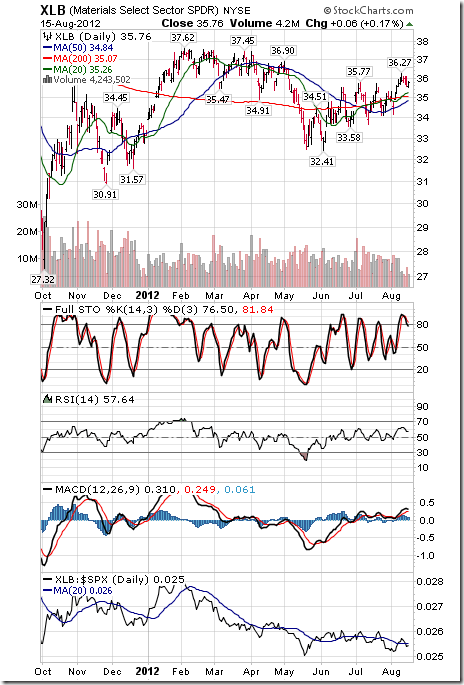
Materials
· Intermediate trend is up.
· Units trade above their 20, 50 and 200 day moving averages.
· Short term momentum indicators are overbought, but have yet to show signs of peaking.
· Strength relative to the S&P 500 Index remains neutral.
Consumer Discretionary
· Intermediate trend is neutral. Support is at $41.58 and resistance is at $46.11
· Trades above its 20, 50 and 200 day moving averages
· Short term momentum indicators are overbought, but have yet to show signs of peaking.
· Strength relative to the S&P 500 Index remains negative.
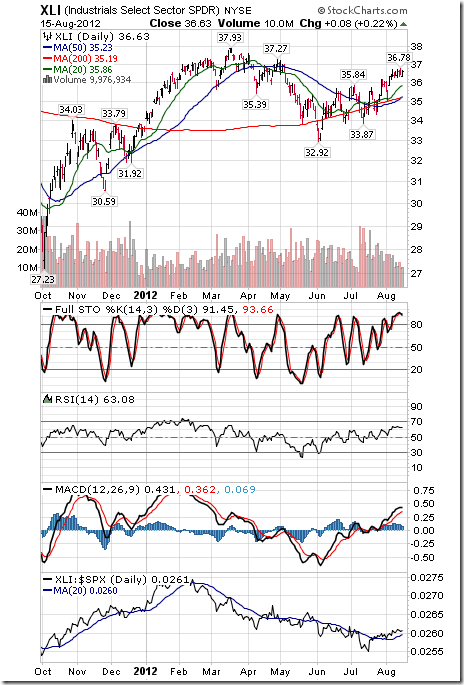
Industrials
· Intermediate trend is up.
· Trades above its 20, 50 and 200 day moving averages.
· Short term momentum indicators are overbought, but have yet to show signs of peaking.
· Strength relative to the S&P 500 Index remains positive.
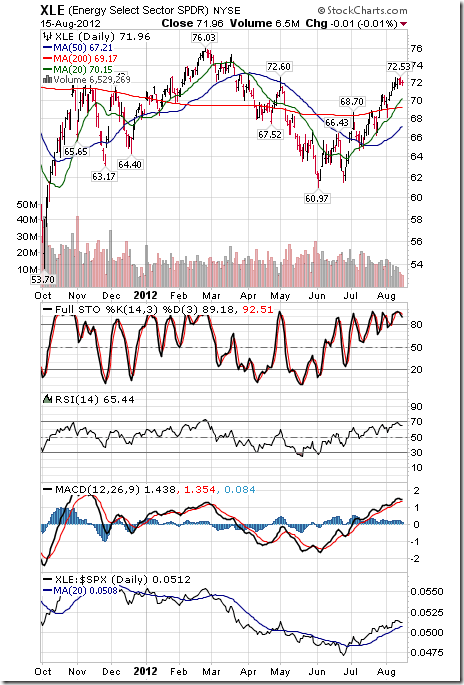
Energy
· Intermediate trend is up.
· Trades above its 20, 50 and 200 day moving averages.
· Short term momentum indicators are overbought, but have yet to show signs of peaking.
· Strength relative to the S&P 500 Index remains positive.
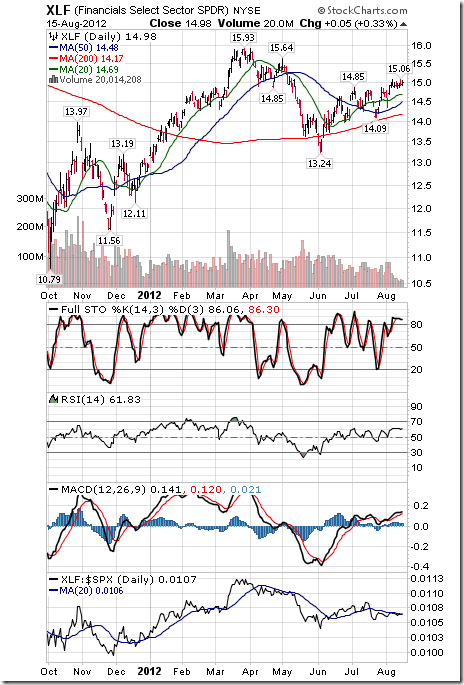
Financials
· Intermediate trend is up.
· Trades above its 20, 50 and 200 day moving averages.
· Short term momentum indicators are overbought, but have yet to show signs of peaking.
· Strength relative to the S&P 500 Index remains neutral.
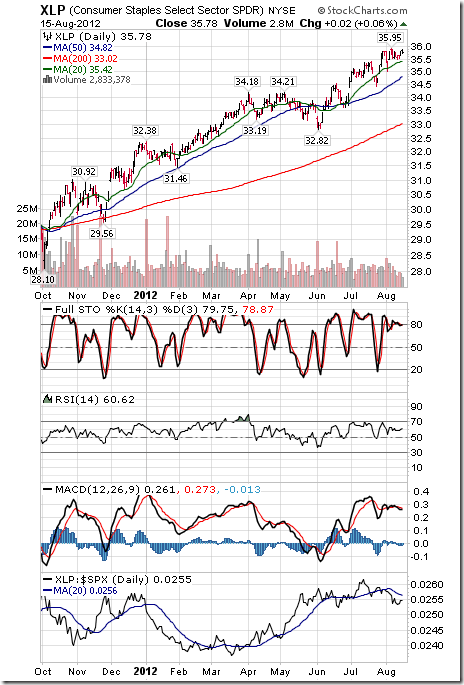
Consumer Staples
· Intermediate trend is up.
· Trades above its 20, 50 and 200 day moving averages.
· Short term momentum indicators are overbought and showing signs of rolling over.
· Strength relative to the S&P 500 Index remains negative.
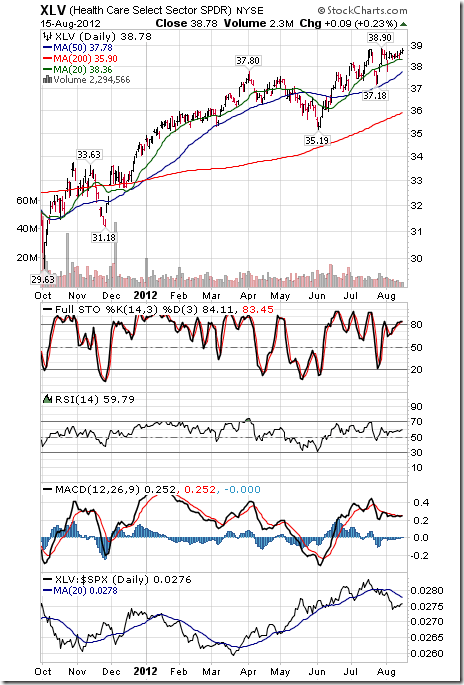
Health Care
· Intermediate trend is up.
· Trades above its 20, 50 and 200 day moving averages.
· Short term momentum indicators are overbought and showing early signs of rolling over.
· Strength relative to the S&P 500 Index remains negative.
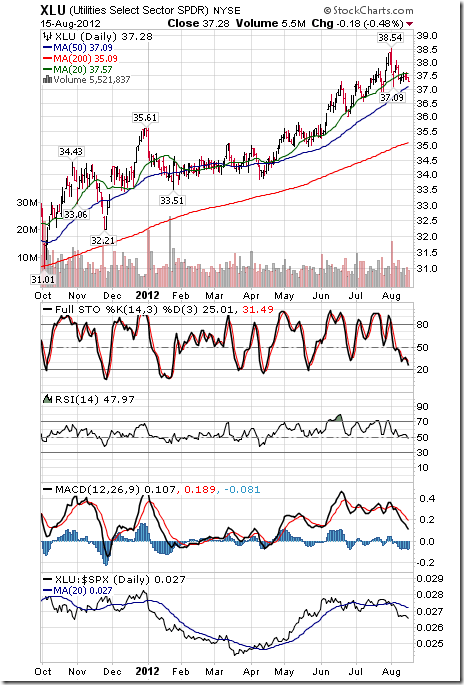
Utilities
· Intermediate trend is up
· Trades above its 50 and 200 day moving averages and below its 20 day moving average.
· Short term momentum indicators are trending down.
· Strength relative to the S&P 500 Index remains negative.
Cycle targets that we provide are TURNING POINTS. This means an event normally takes place at that time be it a high or low. If ideally something should produce a low but does not and produces a high, it is typically extending the cycle to the next TURNING POINT. It looks at this time that the next important turning point is the week at the start of Sept. There is of course the Fed meeting. But then there is trouble among debt ridden nations and then there is Iran.
Keep in mind that for some strange reason, geopolitical evens tend to also happen in the Aug/Sept time frame. Besides war, there was even 911. On 28 June 1914,Archduke Franz Ferdinand of Austria was assassinated. World War I began officially 28 July 1914 and lasted until 11 November 1918. It was August when things really got underway. World War II began when Germany attacked Poland on September 1, 1939. Most stock market crash events take place after highs in early Sept such as 9/3/1929. Even the 1987 Crash 10/19/1987.What it is about this time of the year who knows. Where December is the time to be jolly, Sept is the time for chaos. Never look for a particular event high/low. It is a TURNING POINT that sometimes can invert and produce the opposite largely because everything is connected. It is always a action/reaction.

The Rising Social War
In Rome, there was the Social War (91–88 BC) where citizens of Italy paid taxes but did not have the same respect and rights as those in Rome. We are likewise headed straight into a class-warfare struggle because government blames the rich for not paying their “fair share” when it is government that spends without comprehending what the hell they are doing. In Rome, this taxation without equal rights eventually erupted into the Social War just as the American Revolution took place as England sought to extract wealth unjustly.
In Italy today, the Prime Minister Mario Monti’s government has implemented a 20 billion euros ($25 billion) policy in austerity measures that is now causing the Italian economy to implode. The country is struggling with 1.9 trillion euros of debt and as everyone else in the West, there is no plan to pay it back and all governments are turning inward against their people threatening the very foundation of democracy itself. This is now all about government surviving and they see this as extracting funds from the people to pay the interest only to the bond-holders who demand austerity and higher taxes as their pound of flesh.
Prime Minister Mario Monti’s government is now implementing this 20 billion euros attempt to strip people of their wealth in austerity measures that are destroying the economy precisely as took place under Maximinus. We must understand that attacking the “rich” who are the class that create the economy by creating jobs (small businesses employ 70% of the civil work force), they cause capital to hoard and the money supply to actually contract simultaneously with higher unemployment as hiring takes a wait and see approach.
This trend of a collapsing velocity in money was self-evident also during the Great Depression when over 400 American cities were forced to print their own money – Depression Scrip. We are headed into a deep and dark vortex from which there is no escape. Government MUST revise the entire monetary system and restructure the debt. Italian demand for supercars is collapsing. According to Bloomberg News, the number of secondhand high- performance Italian cars that have been exported from Italy has exploded nearly tripling to 13,633 vehicles in the first five months of 2012, from 4,923 a year earlier, according to auto industry group Unrae as reported by Bloomberg. We are in such a serious position, it is NOT hyperinflation we have to worry about, it is the collapse of everything because government is too damn corrupt and refuses to even look at what they hell they are doing upon the advice of bankers. We cannot learn from experience, because we are ignorant of the past – history is the real catalog of solutions if we dare to look.
by Martin Armstrong of Armstrong Economics
Jim Rogers : ….”It’s finished All the people who got MBAs made mistakes they should’ve become farmers because farming is going to be the exciting , farming, mining things like that is where the excitement going to be as finance goes into serious decline for two or three decades” …
Veteran investor and an early spotter of the commodities bull market, Rogers also says if he could only invest in one precious metal this summer it would be silver. Why is that?
Silver prices are more volatile than gold. And over the past five years gold has actually been a slightly better performer.
Consider this: silver is the only major commodity not to have reached a new all-time high in this bull market; silver is still cheaper than it was 32 years ago, prices are astonishingly depressed.
….much more in the video below:

Two weeks ago I told you that August would see dramatic trending moves, and that we wouldn’t have to wait long for them to unfold.
Well, they’re here NOW. Nearly all markets are pressing extreme resistance levels in what most traders and investors believe are breakouts.
They see a surge in gold, and think it’s going to march to new record highs well-above $2,000 an ounce.
They see a modest rally in silver, and think they should load up the truck, expecting silver to surge to $50 and higher.
They see a rally in oil, and figure that all must be well with the global economy and that higher energy prices are a fait accompli.
They see grain prices surging, and figure rampant inflation will soon hit food prices.
And they see the Dow Industrials hanging in there nicely above the 13,000 level — and expect a new bull market in stocks.

Mind you, ALL of the above WILL happen.
- Gold will soar to at least $5,000 an ounce.
- Silver to well over $100 an ounce.
- Oil to new record highs near $200 a barrel.
- Inflation surging.
- And the Dow Industrials will soar in a new bull market, to at least 21,000, if not much higher.
But none of that is in the cards for right now. It’s not time. The moves I mention above WILL happen, but not for at least another six months, give or take.
Instead, nearly all markets will soon turn back down, taking with them the most-optimistic of investors precisely at the wrong time.
You see, all markets have one underlying rule that always seems to govern their broad behavior: At market extremes, inflict the most amount of damage upon the most investors. Take them to the woodshed and spit them out like sawdust; then go find another group of investors and start the shredding process all over again.
Don’t get me wrong. That doesn’t mean you can’t make money in the markets. It does, however, mean that you must always keep your guard up … and more importantly, know when to be a trend-follower versus a contrarian.
And right now, it is my humble, 34 years of experience that’s telling me it’s time to be a contrarian.
Not just my gut, but also all of my technical and cyclical indicators.
For one thing, though gold seems to be pressing higher and could move even higher in the short term — as I recently pointed out — gold would have to close above $1,727.70 to prove me wrong and turn the short- and intermediate-term trends back to bullish.
I see very little chance of that happening and, instead, I sense that gold is about to inflict a lot of damage on the majority of investors and stage a stunning collapse.
Silver is about to do the same. While it could press a bit higher, silver would have to close above $30.71 to reverse the short- and intermediate-term trends. Short of that, silver will pummel a lot of the investors who are now venturing in to buy “the devil’s metal.”
Oil, too, is about to hurt a lot of investors and traders. While it’s managed to rally to the $94 level, it also is on the verge of turning back down — taking with it all those investors who think energy prices have nowhere to go right now but up.
Grain prices are topping as well. So is inflation in the short term.
And the Dow Industrials — though clearly showing their propensity to begin a new bull market — are getting very toppy.
Momentum indicators are slowing. The number of advancing stocks versus those declining is beginning to wane quite dramatically. And the Dow Transports have thus far entirely refused to confirm the rally in the Dow and the S&P 500, creating a hugely BEARISH non-confirmation.
I would love to tell you that new bull markets are here in all of the above, but they’re not. Each and every one of the above markets needs more time to form the foundation for their next bull legs higher.
They need to back-and-fill support areas on their charts. And most importantly, they need to take the majority of investors out to the woodshed for a shredding. Then, and only then, will they have a chance to begin anew.
Ironic, but once those declines occur, you’ll find almost everyone will become a giant bear. Precisely near the bottom of the corrections.
Nearly everyone but me. Because when that happens …
When you see gold fall below at $1,500 …
When you silver fall at least below $23 …
When you see oil plummet like there’s no tomorrow …
And you see the Dow Industrials melting in a 2008-style plunge …
I’ll be backing up the truck and telling you to buy almost everything with both hands.
What are the chances I’m completely wrong in my analysis? I’d rate them as very low, say around 10%.
And if it turns out I am wrong, I don’t have a problem with it. With gold ultimately heading to over $5,000 … silver to over $100 … oil to near $200 … and the Dow Industrials to at least 21,000 …
There will be plenty of money to be made.
Bottom line: For now, dis-inflation still has the upper hand in most markets. There’s still too much bad debt in the world that hasn’t been dealt with.
And the Federal Reserve and the European Central Bank will NOT act until the pain is too much to bear. That pain is on the horizon, so in the interim, just make sure you’re out of harm’s way.
I repeat my advice of two weeks ago:
If you’re an investor with an eye to the long term, continue to preserve your ammo and hedge the positions that, for whatever reason, you can’t get out of. The time will come to add to your long positions — but it’s not here yet.
If you’re a short-term trader, don’t be frustrated by the recent choppy markets, or any short-term losses you may have experienced. Stay the course.
Best wishes,
Larry
P.S. I’m hard at work on the next issue of my Real Wealth Report, which publishes on Friday. To be among the first to find out how I’m planning to fully seize profit potential in the markets for the rest of the year, be sure you’re signed up to get your copy. Activate your risk-free trial subscription bysimply clicking here now!

-
I know Mike is a very solid investor and respect his opinions very much. So if he says pay attention to this or that - I will.
~ Dale G.
-
I've started managing my own investments so view Michael's site as a one-stop shop from which to get information and perspectives.
~ Dave E.
-
Michael offers easy reading, honest, common sense information that anyone can use in a practical manner.
~ der_al.
-
A sane voice in a scrambled investment world.
~ Ed R.
Inside Edge Pro Contributors

Greg Weldon

Josef Schachter

Tyler Bollhorn

Ryan Irvine

Paul Beattie

Martin Straith

Patrick Ceresna

Mark Leibovit

James Thorne

Victor Adair