
Timing & trends
Submitted by Victor Adair on July 30, 2012 – 7:41am
We’ve had a week of dramatic reversals across all markets.
Stocks: The DJI dropped nearly 500 points from the Friday July 20 highs to this past Tuesday’s lows…and then rallied back nearly 600 points to the Friday July 27 close.
Credit Markets: Early this week the yields on “safe haven” bonds fell sharply while the yields on Spanish bonds soared. This pattern reversed dramatically Wednesday through Friday.
Currency markets: Early this week the US Dollar Index surged to new 2 year highs…and then reversed sharply Wednesday through Friday.
We had Key Weekly Reversals higher in Euro, Swiss, CAD, AUD, DJI, S+P, TSE, Gold (in USD terms), US treasury yields from 2 through 30 year maturities, and a Key Weekly Reversal lower in the US Dollar Index.
From an emotional point of view the stock market had been flying high (relative to the credit markets) until it hit a stone wall Friday, July 20, as Spanish bond yields soared and the markets feared that the Euro debt crisis could swiftly spin out of control. The fear intensified Monday and Tuesday…investors scrambled for safety…the USD and the Yen soared, stocks tumbled, safe haven bonds rallied and liquidity drained out of the markets…and then…
Late Tuesday afternoon an article by Hilsenrath in the WSJ speculating about imminent Fed easing brought the DJI back from its lows to close slightly higher on the day. A comment the next day from ECB head Mario Draghi to the effect that the ECB would do “whatever it takes” to save the Euro seemed to light a fire under the markets and the weekly reversals were on with a vengeance. The market mood had become increasingly fearful Friday through early Tuesday and then suddenly changed to becoming increasingly hopeful Wednesday through Friday. To say that the market mood swings have been manic-depressive would be an understatement.
This week ahead there are scheduled central bank meetings of the BOE, the ECB and the Fed…as well as the US employment numbers Friday Aug 3…plenty of fuel for more manic price swings.
What is the market really doing? Despite the manic-depressive mood swings, despite the torrent of capital rushing into perceived safe haven bonds, despite the seemingly intractable European debt crisis, despite the sluggish US and global economy, despite the all time record high number of American citizens on food stamps and disability it seems that THE STOCK MARKET WANTS TO GO HIGHER…the DJI has rallied over 1000 points from the June 4 lows…over 2,700 points from the October 4 lows.
Why? It seems as though we are mainly trading off macro political or central bank inspired headlines…or rumors…its seems as though the markets expect central banks will take further reflationary action…will print more money…which will inspire risk on…and higher asset prices.
The technical view: Technicians make the point that you can never know all you need to know to make the best market decisions…but if you look at the market you can see what it’s doing…so free yourself of your opinions about what the market should be doing and look at what it is doing. When I look at the US stock market this week I see that it rallied right through this month’s previous highs and closed at its best levels in nearly three months. This market is a classic case of climbing a wall of worry.
There has been a huge amount of cash sitting on the sidelines for the past few years due to economic and political uncertainty and that money could come into this market…taking it much higher…yes, the economic and political uncertainty that has kept that cash on the sidelines still exists…yes, those problems may only be intensifying…and yes, it’s entirely possible that the stock market may reverse tomorrow and drop a few thousand points before Christmas…but…since March, 2009, the US stock market has been trending higher and, as skeptical as I am and as skeptical as I have been, I have to say it looks like this market wants to go higher.
With my own money I remain cautious in both my short term trading account and my long term savings accounts…I feel there is a high degree of risk in these markets…so I remain on the sidelines…but I don’t want to be short either!

Victor Adair
Senior Vice President and Derivatives Portfolio Manager
Contact Victor E-mail @ vadair@union-securities.com
Victor Adair is a Senior Vice President and Derivatives Portfolio Manager at Union Securities Ltd. Victor began trading financial markets over 40 years ago and has held a number of senior positions during his long career as a commodity and stockbroker. He provides daily market commentary on CKNW AM 980 radio Vancouver and is nationally syndicated on Mike Campbell’s weekly Moneytalks radio show.
Victor’s trading focus is primarily on the currency, precious metal, interest rate and stock index markets and his clients are high net worth individuals and corporations.

Three major events will dominate equity market trends this week:
- · The FOMC meeting announcement on Wednesday. Will the Fed hint or take action of QE III? Market action last Thursday and Friday suggests a high probability.
- · The European Central Bank announcement by Draghi on Thursday. Is Draghi serious or is he bluffing following his comments last week about saving the Euro? Market action late last week suggests that he is serious.
- · The July employment report on Friday. Consensus suggests a modest improvement. However, this report is infamous for its frequent adjustments that have little to do with real employment (birth/death adjustment, immigration adjustment, seasonal adjustments particularly related to the auto industry in July).
U.S. economic news released this week (other than the employment report) will be mixed at best. Most will confirm that real GDP growth in the third quarter is anemic at best. On Friday after the initial estimate of second quarter GDP was released at only a 1.5% annual rate, most economists lowered third quarter real GDP estimates. According to CNBC, average estimate based on a survey of well-known Wall Street economists was a decline of 0.1%.
The VIX Index rose 0.43 (2.64%) last week, but was heading lower on Thursday and Friday following spikes to higher levels earlier in the week.

Other macro events to watch this week include Eurozone Consumer Confidence to released today, Canada’s May GDP on Tuesday, Eurozone PMI on Wednesday, China’s PMI on Wednesday and Eurozone interest rates on Thursday.
Earning reports will remain a focus. Reports released last week generally showed lower revenues and earnings than the second quarter last year, but earnings that exceed consensus. Unless, reports were significantly lower than consensus, stock prices advanced. Look for more of the same this week. Frequency of Canadian reports will increase significantly this week.
Seasonal influences on equity markets in August turn negative. According to Thackray’s 2012 Investor’s Guide, “The month of August has been the fourth worst month from 1950 to 2010” for U.S. equity markets. In addition, U.S. equity index losses during the past 10 periods were significantly higher than the previous five decades. More information will appear in tomorrow’s Tech Talk. Weakness in August is greater in the first half of August than in the second half. August frequently is the time when analysts re-evaluate their estimates following release of second quarter results. Analysts have a habit of over-estimating annual results in the first half and adjusting estimates lower after second quarter results become available. Currently analysts are estimating a 13% increase in fourth quarter earnings on a year-over-year basis. These estimates clearly are too high. Downward adjustments this year will be higher than usual.
Short and intermediate technical indicators for most equity markets and sectors are overbought, but have yet to show signs of peaking.
North American equity markets have a history of moving higher from June to December during Presidential Election years. However, at least one correction during that period also is normal.
Cash on the sidelines remains substantial and growing. However, political uncertainties (including the Fiscal Cliff) preclude major commitments by investors and corporations.
The Bottom Line
Equity markets on both sides of the border have had a good ride since their lows set on June 4th. The Dow Jones Industrial Average is up 8.6%, the S&P 500 Index has gained 9.4% and even the TSX Composite Index has improved 5.0%. Investing in equity markets has become less attractive. Accumulation of seasonal trades on weakness continues to make sense as long as the seasonal trades are outperforming the market. Sectors in this category include agriculture, energy, leisure & entertainment, software and gold. Equity markets will move higher if good news from three major events this week is released. However, upside potential relative to downside risk is significantly less now than early June. A cautious bullish stance appears appropriate.
Equity Trends
The S&P 500 Index gained 23.31 points (1.71%) last week. Intermediate trend is down. The Index broke above short term resistance at 1380.39 on Friday to reach a 12 week high. Support is at 1,266.74. The Index returned to above its 20 day moving average on Thursday and remained above its 50 and 200 day moving averages. Short term momentum indicators are trending higher.

Percent of S&P 500 stocks trading above their 50 day moving average increased last week to 75.00% from 64.60% last week. Percent is intermediate overbought, but continue to trend higher.

Percent of S&P 500 stocks trading above their 200 day moving average increased last week to 65.40% from 59.40%. Percent remains intermediate overbought.

The ratio of S&P 500 stocks in an uptrend to a downtrend (i.e. the Up/Down ratio) increased last week from 0.95 to (230/198=) 1.16. Sixty S&P 500 stocks broke resistance (mainly on Thursday and Friday) and 43 stocks broke support).
Bullish Percent Index for S&P 500 stocks increased last week to 61.60% from 61.20% and remained above its 15 day moving average. The Index remains intermediate overbought and trending higher.

The Up/Down ratio by TSX Composite stocks improved from 0.82 to (111/110=) 1.01. Twenty seven TSX stocks broke resistance and 20 stocks broke support.
Bullish Percent Index for TSX Composite stocks increased last week to 50.00% from 48.37% and remained above its 15 day moving average. The Index continues to trend higher.

The TSX Composite Index gained 143.45 points (1.23%) last week. Intermediate trend is down. Support is at 11,209.55 and resistance is at 11,936.16. The Index remains above its 20 and 50 day moving averages and below its 200 day moving average. Short term momentum indicators are trending higher. Strength relative to the S&P 500 Index remains negative.

Percent of TSX stocks trading above their 50 day moving average increased last week to 58.94% from 53.66%. Percent is intermediate overbought, but continues to trend higher.

Percent of TSX stocks trading above their 200 day moving average increased last week to 39.43% from 38.62%. Percent is trending higher.

The Dow Jones Industrial Average added 253.09 points (1.97%) last week. Intermediate trend changed from down to up on Friday when the Average broke above resistance at 12,077.57 on Friday. The Average remains above its 20, 50 and 200 day moving averages. Short term momentum indicators are trending higher. Strength relative to the S&P 500 Index is negative, but showing early signs of change.

Special Free Services available through www.equityclock.com
Equityclock.com is offering free access to a data base showing seasonal studies on individual stocks and sectors. The data base holds seasonality studies on over 1000 big and moderate cap securities and indices.
To login, simply go to http://www.equityclock.com/charts/
Following is an example:
AMEX GOLD BUGS INDEX ($HUI) Seasonal Chart

Disclaimer: Comments and opinions offered in this report at www.timingthemarket.ca are for information only. They should not be considered as advice to purchase or to sell mentioned securities. Data offered in this report is believed to be accurate, but is not guaranteed.
Don and Jon Vialoux are research analysts for Horizons Investment Management Inc. All of the views expressed herein are the personal views of the authors and are not necessarily the views of Horizons Investment Management Inc., although any of the recommendations found herein may be reflected in positions or transactions in the various client portfolios managed by Horizons Investment Management Inc
ED Note:listen to Josef Schacter inteviewed by Michael Campbell on Money Talks July 28th/2012 – The interview starts at the 19:20 and ends at the 42:20 mark. The show that preceded it and came after the interview with Josef can be listened to onl the player at the centre player in the middle of the top banner home centre title Money Talks July 28th.
{mp3}josephschacter2{/mp3}
Schachter Asset Management Analyst and Investment Advisor Josef Schachter, who provides oil and gas research to Maison Placement Canada clients, is recommending a group of Canadian companies that are maintaining the delicate balance between oil, on which he is bearish, and natural gas, which he believes will soon enrich both producers and investors. In this exclusive interview with The Energy Report, Josef shares some value-priced names he feels are poised for big gains, along with natural gas’ rising price. (Ed Note: Josef Schachter who provides oil and gas research is Michael Campbell’s Guest on Money Talks this coming Saturday at 9am)
COMPANIES MENTIONED: DANA GAS PJSC – DELPHI ENERGY CORP. – ENCANA CORP. – GALLEON ENERGY INC. – IMPERIAL OIL LTD. – NIKO RESOURCES LTD. – QUESTERRE ENERGY CORPORATION – SEA DRAGON ENERGY INC. – STERLING RESOURCES LTD. – SUNCOR ENERGY INC. – TALISMAN ENERGY INC. – VERO ENERGY INC. –WESTERNZAGROS RESOURCES LTD.
The Energy Report: You recently said that if gasoline prices continue to rise we should see West Texas Intermediate (WTI) oil in the low-$70s in the third through fourth quarters of 2011 (Q311–Q411). That represents an approximate 25% decline from current levels. Does that mean that the North American economy will be in trouble?
Josef Schachter: That’s the key. When you get $4/gal. gasoline at the pump, or $1.25–$1.35/liter in Canada, you start seeing demand destruction. If we look at the weekly Energy Information Administration (EIA) data for the week ending June 3, we can see that demand for finished motor gasoline was 9.16 million barrels (Mbbl.)—down 268,000 barrels on the week. And year-to-date (YTD), it’s down 0.3% to 8.956 Mbbl. per week. So, we’re already seeing demand destruction in the States from the handle of $4/gal. In Canada, we’re seeing the same thing; and Europe, of course, is showing much weaker demand. Japan also is showing much weaker demand, and we have the tightening of credit in China. Quantitative easing 2 (QE2) is now out of the way, so the stimulus is gone in the U.S.
There is probably a $30/bbl premium in the price of WTI oil, and 50% of that relates to Middle East issues with about 900,000 barrels per day (bpd) that have been cut off from Libya. If we see the Libya issue resolved in the next three to six months with Muammar Gaddafi going out, that production will come back on and will remove the pressure of the Arab Spring premium. The other 50% is the hedge and commodity funds.
If we see weakness in the economy, the whole commodity board will come down and we’ll see the U.S. dollar rally. We believe oil prices will lose that $15/bbl premium held by speculators in commodities and exchange traded funds (ETFs). The combination of the two could take $30 off the price of WTI oil, which is just around $93.40 today (Ed Note: This article was written June 23rd/2012. September Crude closed at 88:50 July 24th). Remember, when you have weak economic conditions, you trade below fair value. Recall Q109, while the fair value price might have been $50 for oil, we traded in the low-$30s.
TER: You use technical analysis quite extensively in your research reports, more than many sellside analysts. What are the charts telling you?
JS: My background is fundamental. I have an accounting background and am a Chartered Financial Analyst (CFA), so I come at it from a fundamental point of view. But I have had healthy respect and training from the technicians during my +30 years in the business, so I do look at the charts. We were at $112/bbl of WTI, now we’re at $98— if it breaks $94 on the charts, so it’s going down and looks like low-$70s (again article written June 23rd). So, I think you must have respect for, and use all of, the disciplines. But I come at it from a supply/demand point of view; and, while the price of oil ran to $112 due to concerns about supply removal in the Middle East, that could be reversed if Libyan production comes back on because it’s a big producer.
TER: With $4/gal. gasoline, we’ve seen oil demand falling in the U.S. But what about natural gas, isn’t the reverse true? At the $4–$5 per-thousand-cubic-foot (Mcf) level, shouldn’t we be using a lot more gas? Isn’t that equivalent to about $1/gal. gasoline?
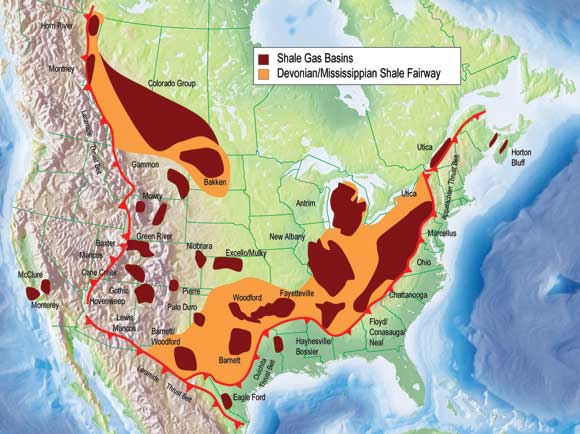
JS: Yes, we could see natural gas prices triple and still be the fuel of choice. The inventory picture has been high, but that’s coming down. Because of the Haynesville and the Marcellus and everything else, there was a perception that we have a natural-gas glut. We believe natural gas prices will go significantly above $5/Tcf this summer with big air-conditioning demand during the hurricane season. Over the winter of 2011–2012, we think NYMEX gas will trade north of $7/Mcf.
TER: Nat gas is quite a bit higher in Europe and Asia. Is there an arbitrage opportunity?
JS: There is currently no arbitrage capability, in terms of shipping natural gas from the United States to Europe or Asia. Remember, there are costs to do that. If prices in Japan are $10 or $12/Mcf and today we’re trading at $4.35/Mcf for NYMEX July, there’s an arbitrage there; but there are landed costs in building a facility. Cheniere Energy Partners L.P. (NYSE.A:CQP) and other companies are talking about this. It may cost $5/Mcf more to convert that into liquefied natural gas (LNG) and ship it to Japan due to distance, and it may not be enough of an arbitrage to attract the kind of capital needed.
TER: You’re bullish on natural gas and bearish on oil. Do you feel like gas prices will rise at the expense of oil, with investable dollars being redeployed into gas and gas stocks?
JS: That’s what we’ve been recommending to Maison’s institutional clients. If you look at some of the big-name oily stocks, they’ve already come down a bit from where they were. For instance, Suncor Energy Inc. (TSX.V:SU; NYSE:SU) was trading at $47 in February, and now it’s trading at $38. So, there’s been a bit of a haircut there. The big Canadian producer Imperial Oil Ltd. (TSX:IMO; NYSE.A:IMO) was $54 in February, when WTI oil was at $112/bbl, and now the stock is trading at $44.56.
So, we’ve already seen a correction in the oil names, and we think that will continue, especially if we see another $20–$30/bbl come off the price of oil. Gas stocks have done the reverse. At the beginning of the year, Encana Corp.(TSX:ECA; NYSE:ECA) was a $29 stock, and now it’s a $31 stock. That’s not a big move, but it’s gone up versus the oily names going down.
TER: Back in March, the Government of Quebec halted shale gas drilling until a safety evaluation could be completed. This could take up to two years and, with court challenges and environmentalists converging on this area as a battleground, it might take longer. What’s your feeling on this?
JS: There’s a pilot phase that will go on for the next two years. I believe six wells are forecast, two of which are being worked by a joint venture (JV) between Talisman Energy Inc. (TSX:TLM) andQuesterre Energy Corp. (TSX:QEC). They’re going to be monitored by the government, which will have people onsite. What the companies will have to do is deal with local people and environmentalists, get approval from the farmers and explain what’s going on. They’re going to measure the methane before and after they start drilling since the companies want to prove that they’re not increasing the amount of methane from their activity. So, the industry has to prove its environmental case.
Quebec has a history of environmental legislation for mines; but in the end, it does approve the mines if they go through the environmental hurdles. I think the case will be the same here with natural gas. Companies might not be able to drill close to Montreal or Quebec City, but that’s the same issue with New York. However, in our minds, there will be activity; it’s just a question of when it happens. Remember also, there’s an election in Quebec in two years; and I believe the government wants to wait until after the election on this issue. So, it’s going to take that two-year window or more.
TER: What are the plays that you’re recommending for investors today?
JS: We like companies in Western Canada, where there are multizone liquids-rich natural gas areas.
Oil is in some of the plays like the Cardium Formation or the Doe Creek. So, we like companies like Delphi Energy Corp. (TSX:DEE), Vero Energy Inc. (TSX:VRO) and Galleon Energy Inc. (TSX:GO). We also like some Canadian-domiciled companies dealing with international markets like Niko Resources Ltd. (TSX:NKO), which is in India, Indonesia, Kurdistan, Trinidad, Madagascar and a number of other places.
In the past, we’ve been fans of Sterling Resources Ltd. (TSX.V:SLG), which is in the North Sea, the Netherlands and offshore Romania; however, currently we are on the sidelines due to their ongoing difficulties in Romania. We like WesternZagros Resources Ltd. (TSX.V:WZR), which has just completed a very exciting well, Sarqala-1, in the Kurdistan region of Iraq and will spud another well, called Mil Qasim-1, in July. We like a company in Egypt, called Sea Dragon Energy Inc. (TSX.V:SDX). It has the same management team that was successful with Centurion Energy International Inc., which was acquired by Dana Gas PJSC (ADX:DANA) in 2007. A lot of Canadian-domiciled companies are taking the modern technologies around the world and are doing very well with that.
TER: You mentioned Delphi and WesternZagros, which are your top-two picks. One thing that jumps out at me is that neither of these companies has had spectacular returns. So, is this your contrarian gas play?
JS: Yes. DEE got hurt because of their gas bias, but they always had land with liquids-rich capability. For example, in 2009, Delphi was producing about 15% oil and 85% natural gas. This year, it’s going to do about 27% oil and liquids—and that number will go north of 30% by the end of the year. It’s going to generate over 50% of its revenue from oil and liquids; so cash flow will go up, and production volumes will go from 6,700 boe/d in Q109 to north of 9,500 boe/d by year-end. Delphi is doing the right things, in terms of the mix. It’s going after the liquids-rich capabilities on its land, but the company always has the dry gas sitting in its inventory; so, when gas prices go back to $7–$8/Mcf, Delphi can move those assets. In the meantime, it can increase its net asset value (NAV) and cash flow by going after the liquids. It’s similar to the gold business—when prices are low, you go after your best veins; and when prices are high, you go after your bad veins.
TER: Your target price on Delphi is $4, which implies a 60%–65% return, but I noticed the company’s NAV is $3.78. It sounds like a very conservative target price.
JS: Yes. And that’s because we’re looking for Delphi to trade at a ratio of its cash flows, and we’re looking at it annualizing about $0.60 in cash flow by Q411. The cash flow multiple should be no greater than the proven reserve life index (RLI); and, if you have seven-and-one-half years of proven reserves, you also have probable and possible reserves, tax pools and land value to protect the value for shareholders.
So, we take an approach in which a company’s maximum cash flow multiple should be equal to its proven RLI. However, we didn’t even use that in this case. So, you could argue that we may have an even higher target, but our view is to use a reasonable target that we can see makes sense. Then, if it gets to that target and the company is doing better than expected, we can always review it again and come up with a new target.
TER: Your other top pick was WesternZagros, on which you have a target price of $1.50. That represents a roughly 175% return. What are the risks here?
JS: Well, this is in Kurdistan and now the Baghdad and Kurdistan governments are getting their collective act together, in terms of allowing money to be paid to the players in the area, which makes a lot of sense to us. WesternZagros has a lot of cash on the balance sheet, so it has enough for the next phase of drilling. What we like about the company is that the Sarqala-1 well has tested at 9,444 bpd light, +40-degree oil. So, it may have a massive oil field there. WesternZagros’ biggest shareholders are George Soros and John Paulson. Thus, we have big, international investors that believe this company has a big land spread, very attractive base and has proven that there is light oil on it.
TER: You went to the SEPAC Oil & Gas Investor Showcase in Calgary at the end of May. What was the atmosphere there? What did you hear?
JS: If a company is in natural gas only, it’s not generating a lot of cash flow and not making any money. And if it has any debt, it has problems. So, almost every company was trying to draw attention to itself saying, “Let’s find the liquids-rich or oily stuff and use the new technologies to harvest our lands.” Nearly every company was carrying the flag of “liquids-oily” to draw attention.
From my perspective, they’re doing what they have to do in these tough times. But it is getting easier. The basin in Western Canada is gassier, with small pools where the new technologies will help with the oil recovery. But in the long run, we’re going to need a much higher natural gas price for the industry to be successful—not only to get a cash flow but also to start generating free cash flow and net income. That’s when people can see that it’s not just trading dollars in the industry, but also making real money.
TER: Can the small guys survive?
JS: Again, they’ve got to go get land where the big boys aren’t pushing up prices exorbitantly. That means they will have to go into areas that are not ‘hot.’ Everybody loves the Duvernay or the Cardium, but land prices are rising above $5,000/acre. A little company can’t do that today. So, it must have had the land in inventory that it holds or has farmed in from a big boy. But the key thing is that the company will have to be away from where the big boys are located. Companies like Delphi, Galleon and Vero were buying low-priced land in these hot areas before the big boys come in—and where the little guys now just can’t compete.
TER: That makes sense. Josef, do you have any further thoughts that you’d like to leave with our readers?
JS: Just that we’re cautious right now with QE2 over and with all the country risks in Europe. I think almost everybody agrees that Greece has problems that cannot be fixed. At some point, it will have to face the moment and resolve these issues with haircuts everywhere, which is deflationary. So, if that’s the case, and we have a weaker U.S. economy along with Europe, China and Japan, we think there’s a chance for a severe correction. So, we’re not saying investors should go out and buy things right away, but rather build up their buy lists.
Sometime this fall, the market could have a 10%, or even 30%, correction. I’m not sure which one it will be; it depends upon how serious the problems in Europe become. And, of course, Americans are facing their debt issues. So, if we do see a severe 30% correction, some stocks could go down much more than that; so, you want to be ready to be a buyer. We’re saying if you have oily names right now, sell them and lighten up your exposure. If you have to be exposed to energy, be in the natural gas-focused names, but sit there with some decent cash reserves underweighting the sector and be ready to be a buyer sometime this fall when the pain is over.
TER: Great advice. Thank you, Josef.
JS: Thank you.
After a successful investment stewardship at Richardson Greenshields of Canada Limited (RGCL), and the Royal Bank purchase of that firm, Josef set up his own investment advisory business, Schachter Asset Management Inc. (SAMI) in late 1996. Mr. Schachter has nearly 40 years of experience in the Canadian investment management industry. He was the market strategist and director at Richardson Greenshields, as well as a member of its Investment Policy Committee. He holds the Chartered Financial Analyst designation and is a past chairman of the Canadian Council of Financial Analysts.
Currently, Mr. Schachter and his research team provide oil and gas research coverage to the institutional clients of Maison Placements Canada and presents to, and consults, various industry companies and organizations. Mr. Schachter is a frequent guest on BNN and is regularly quoted in such news and financial publications as the Globe and Mail, National Post and Business Edge—the latter of which awarded Mr. Schachter its “Stock Picker of the Year” award in 2003, 2004 and 2007. He is also a regular on various radio shows including Michael Campbell’s “Money Talks.”
Want to read more exclusive Energy Report interviews like this? Sign up for our free e-newsletter, and you’ll learn when new articles have been published. To see a list of recent interviews with industry analysts and commentators, visit our Exclusive Interviews page.

The second of two periods of seasonal strength in the energy sector is approaching. The average optimal time is from July 24th to October 3rd. Thackray’s 2012 Investor’s Guide notes that a trade in the S&P Energy Index has been profitable in 10 of the past 15 periods.
Annual recurring reasons for seasonal strength include strong demand for energy used for air conditioning and declining refined product inventories when refiners are converting their production from gasoline for the summer driving season to heating oil for the winter heating season. Added to this year’s outlook is higher than average temperatures in North America this summer and forecasts for more of the same in August. In addition, U.S. heating oil and gasoline inventories already are at five year lows even before the annual conversion process has started setting the stage for significantly higher refined product prices this fall. Prices already have started to move higher. Since mid-June natural gas prices have jumped 42 per cent, wholesale gasoline prices have increased 16 per cent and heating oil prices have gained 16 percent.
International events also could impact crude oil and refined product prices. Iran has threatened on several occasions to shut down the Straits of Hormuz in response to the West’s growing sanctions designed to encouraging curtailment of Iran’s nuclear program. Most of the world’s crude oil shipments exported from the Middle East must pass through the Straits of Hormuz.
The Canadian energy sector could receive a boost this summer following news on Monday that China’s CNOOC made a “friendly” cash offer to acquire Nexen for US$15.1 billion. The offer came at a 61 per cent premium to Nexen’s closing price on Friday. The offer suggests that Canadian oil and gas producer stocks are undervalued and could prompt additional buying in the sector.
Ironically, energy equities and related ETFs have recorded only modest gains in July despite higher energy prices. Energy equities remain well below highs set in March and only began to outperform the S&P 500 Index and TSX Composite last week. Underperformance has been for good reason. West Texas Intermediate crude oil prices averaged US$88 per barrel in the second quarter, down from US$102 per barrel in the second quarter last year. Second quarter earnings and cash flow will be down substantially on a year-over-year basis. Investors have been reluctant to own the sector prior to the release of “difficult” second quarter results. The tip off will come this week when major Canadian and U.S. energy companies are scheduled to release results. If energy equity prices move higher despite bad news, the stage is set for a significant recovery by the sector into this fall.
On the charts, the sector on both sides of the border has an improving technical profile. The S&P Energy Index broke to a 10 week high on Friday, the Philadelphia Oil Services Index broke above a reverse head and shoulder pattern last week and the TSX Energy Index will complete a reverse head and shoulders pattern on a break above 245.05. Preferred strategy is to accumulate energy equities and related ETFs at current or lower prices for a seasonal trade lasting until October.
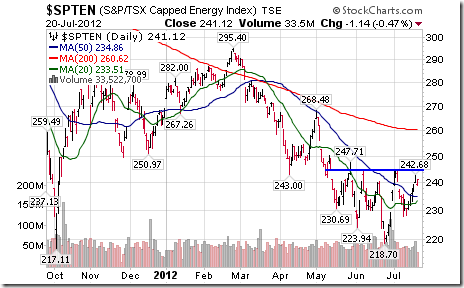
A wide variety of Exchange Traded Funds in the energy sector as well as crude oil, natural gas and gasoline are available in North American equity exchanges. U.S. exchanges list 30 Energy ETFs. A list is available at http://etfdb.com/etfdb-category/energy-equities. Another 24 U.S. based ETFs trade oil, gasoline and natural gas. A list is available at http://etfdb.com/etfdb-category/oil-gas. The most actively traded U.S. listed ETF is the Energy Select Sector SPDR (XLE $67.28). Canadian exchanges list seven energy equity ETFs and eleven oil and natural gas ETFs. The most actively traded Canadian equity ETF is iShares on the S&P/TSX Capped Energy Index (XEG $15.06 Cdn.).
Don Vialoux is the author of free daily reports on equity markets, sectors, commodities and Exchange Traded Funds. He is also a research analyst at Horizons Investment Management, offering research on Horizons Seasonal Rotation ETF (HAC-T). All of the views expressed herein are his personal views although they may be reflected in positions or transactions in the various client portfolios managed by Horizons Investment. Horizons Investment is the investment manager for the Horizons family of ETFs. Daily reports are available at http://www.timingthemarket.ca/
Stocks down another 104 points yesterday…measured by the Dow.
What’s going on…? What’s going on?
That was a song by Marvin Gaye. It was also the question the interviewer asked. Followed by, what’s going to happen next?
But those are questions no one can answer. All we can do is guess…speculate…and wonder.
“Deflation now. Inflation later” is what we’ve been saying for the last 4 years.
The interviewer seemed happy with the answer. And the elaboration:
“Japan now…but don’t be surprised when we end up in Argentina.”
What do Japan…Argentina…and the US all have in common? They can print money. And when their backs are to the wall, that is what they will do.
But that’s later, remember. Right now, investors are lending money to governments at the lowest rates in history. They do not ask anything more than to get the money back. Eventually. And since the US and Japan can print, they are confident that they’ll paid.
But what about Argentina? Turns out, Argentina borrowed in dollars too…and pledges to repay, in dollars. So, you might think you’d get the same interest yield in an Argentine bond as an American one.
But what’s this? The yield on the ‘Boden,’ which is what they call Argentina’s dollar bonds, is over 17% — which is more than 10 times what you get from a 10-year US note. What gives? Simple. Argentina can print pesos. It can’t print dollars. So investors are afraid that when time comes for repayment, the Argentines won’t have enough dollars on hand.
No such problem in the US. And as long as this recession or ‘contained depression’ continues…investors will probably continue to treat US debt like a mattress. You put your money in. You can get it out when you want. You don’t make anything. But you don’t lose anything either.
But how long will this Japan-like slowdown continue, our interviewer wanted to know?
“Hard to say,” was the reply. In terms of private sector debt, the downturn is taking out an amount equal to about 10% of GDP every year. But there’s still the equivalent of 100% of GDP of excess debt left to go before we’re down to ’70s levels.
If that’s where it is going, we’ve got another 10 years of travel — at this rate.
Meanwhile, in the near term, it looks like the US economy is headed into another recession. That’s what usually happens when retail sales go down for 3 months in a row.
Seventy percent of the US economy is consumption. So, when the consumers stop buying, the economy goes down. Lakshman Achuthan, who runs Economic Cycle Research Institution, says he thinks a recession has already begun.
And when the economy goes down, generally, stocks go down. The little sell-off we’ve seen so far is nothing. The Dow hit 13,000 in 1999. It has gone nowhere since. And now, it should begin to sink.
As mentioned, retail sales are falling…
Corporate profit estimates are going down…
The Chinese growth rate has dropped 6 quarters in a row…
America’s corn and soybean crops have failed…
Family income is in decline; never before has it gone down over such a long period (12 years)…
US bond yields are at their lowest ever, with the 10-year at 1.39%.
Came the question: “Well, what should our viewers do?”
“Sell stocks,” was the answer.
Regards,
Bill Bonner
for The Daily Reckoning

Since founding Agora Inc. in 1979, Bill Bonner has found success and garnered camaraderie in numerous communities and industries. A man of many talents, his entrepreneurial savvy, unique writings, philanthropic undertakings, and preservationist activities have all been recognized and awarded by some of America’s most respected authorities. Along with Addison Wiggin, his friend and colleague, Bill has written two New York Times best-selling books, Financial Reckoning Day and Empire of Debt. Both works have been critically acclaimed internationally. With political journalist Lila Rajiva, he wrote his third New York Times best-selling book, Mobs, Messiahs and Markets, which offers concrete advice on how to avoid the public spectacle of modern finance. Since 1999, Bill has been a daily contributor and the driving force behind The Daily Reckoning. Dice Have No Memory: Big Bets & Bad Economics from Paris to the Pampas, the newest book from Bill Bonner, is the definitive compendium of Bill’s daily reckonings from more than a decade: 1999-2010.
Special Report: Forget QE3 – America’s Going Bust, on the Road to Bankrupt Hell- If America had a credit card, it would get mercilessly cut up and thrown back in her face. The country’s basically broke and isn’t paying its debts. Harsh, but true. All of that – and how it could affect your family and your retirement – is revealed in this urgent video report. Don’t wait, watch now.

-
I know Mike is a very solid investor and respect his opinions very much. So if he says pay attention to this or that - I will.
~ Dale G.
-
I've started managing my own investments so view Michael's site as a one-stop shop from which to get information and perspectives.
~ Dave E.
-
Michael offers easy reading, honest, common sense information that anyone can use in a practical manner.
~ der_al.
-
A sane voice in a scrambled investment world.
~ Ed R.
Inside Edge Pro Contributors

Greg Weldon

Josef Schachter

Tyler Bollhorn

Ryan Irvine

Paul Beattie

Martin Straith

Patrick Ceresna

Mark Leibovit

James Thorne

Victor Adair