
Timing & trends
U.S. Market – While I’m certainly not bullish I would caution anyone who is thinking about shorting the market on the assumption something more than a 5% -10% fall is in the cards. The economy sucks and the geopolitical problems around the world are very serious.
However (Dislike using this hedging word found in so many market forecasters vocabulary which include if, but, maybe….), a lot of bad stuff has been thrown at this market and it bends but doesn’t break. I suspect the FED is getting close to pushing on the string yet again and there’s going to come a time when the “Don’t Worry, Be Happy” crowd on Wall Street (who always says it’s a good time to invest) shall decide it’s time to shift some of the enormous capital in bonds into stocks. Here again, I don’t anticipate a surge upwards but shorting here is the one move I think is among the worse among the choices.
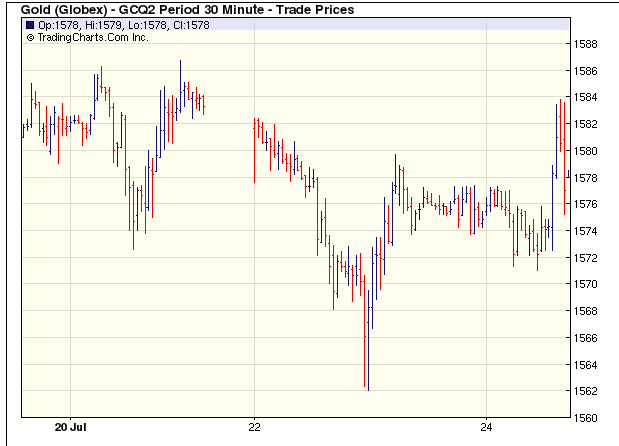
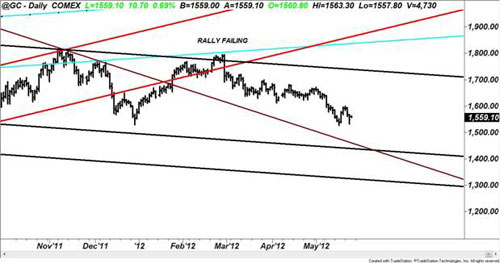
Gold – It may be hard to see with the naked eye, but gold has been building a base that I believe can lead to it taking out $1,650, which in my mind should signal the resumption of the climb in the “mother” of all gold bull markets. A seasonally favorable period for gold is just a few weeks away and if the perma-bears and gold haters (that’s basically 98% of the world) can’t get gold below $1,500 by then – it’s curtains for them (and I won’t be shedding a tear for them).
U.S. Dollar – It’s getting to the point where I would like to take a flyer on shorting Uncle Sam. I shall let you know if and when I do.
Bonds – I’m looking for the 10-yr. T-Bond to get down to a 1.25% yield. At that point I feel getting seriously short is all but certain.

Oil and Natural Gas – No change here.

Mining and Exploration Shares – The juniors are especially suggesting their wash-up is near complete. We actually started to see some bids come into the market late last week In case you forgot, a bid is where someone is actually willing to buy shares-lol).

Dog days of summer? Not much happening in the markets? Tight trading ranges? Yes, all are true. But that’s no reason to be complacent! Quiet markets and tight trading ranges can be very deceiving, often leading to surprises. (
(Ed Note: If you’d prefer to watch this presentation in Video go HERE)
The last couple of weeks since I last spoke with you by video haven’t seen much in the markets other than tight trading ranges, a lot of coiling up like a spring ready to break.
That’s somewhat understandable considering we’re almost in the dog days of summer. And there’s a lot of uncertainty about what’s happening in Europe and, of course, the latest developments in the Middle East with Iran and Syria.
The major trends have not changed so let’s go right to the charts.
Gold: Here is a fresh new chart of gold. As you can see, gold is largely going quite a bit sideways. It’s coiling up and that’s usually an indication of a substantial move coming.
I do believe that it will be to the downside. Nothing’s changed there.
My system signals continue to suggest a sharp move to the downside; however, in a tight trading like this anything goes. I wouldn’t be surprised to see one last rally out of gold, even up to $1,680, before the next leg down occurs. You can see right here there’s tremendous resistance overhead in gold between $1,680 and $1,700.
Bear in mind, I’m long-term very bullish on gold, but that next leg up in gold will not materialize until we get a solid test of long-term support down below $1,500, probably around the $1,400 level.
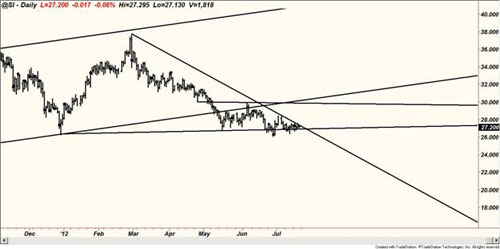
Silver: Silver, much like gold as you can see here, is really coiling up in a very tightly wound trading action here. Silver, like gold, could stage one last rally. However, I believe that we are still very likely to see $23 and $20 silver before silver’s long-term bull market reemerges.
You can see here it’s on the edge of doing something in this contracting triangle — we’re very close to perhaps a short-covering rally or a complete breakdown.
There isn’t much in the way of support once $26 is broken. There’s some minor technical support at $23, and then really no support until around the $20 level. So keep your eyes on both gold and silver. I think we’re close to some significant moves there despite the recent, very tight, sideways action.
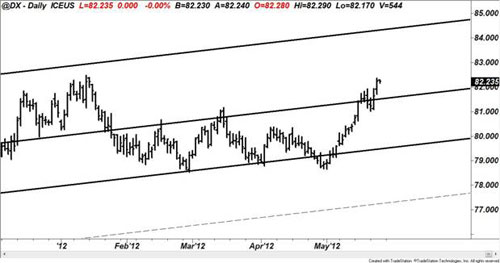
U.S. Dollar Index: The dollar is looking very healthy here, again, because the euro is so sickly. The dollar has had a nice uptrend, which I correctly forecast.
We’ve pulled back a little bit and we could pull back a little bit further basis the Dollar Index to about 83, but then we should see another leg higher to the 86, 87 level as Europe’s crisis continues to roll on.
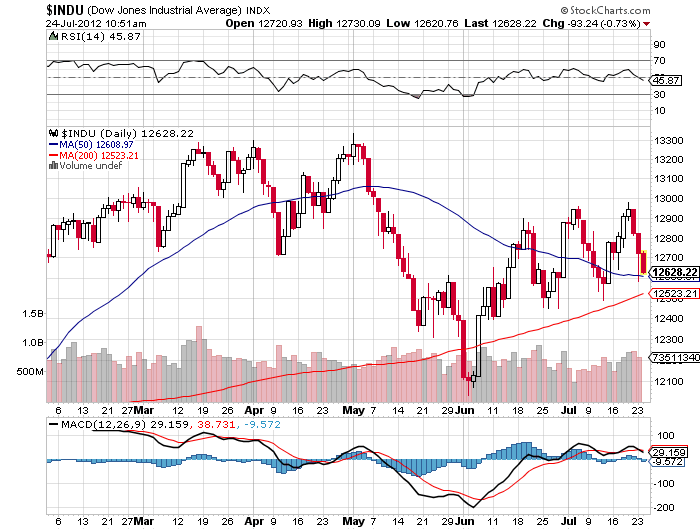
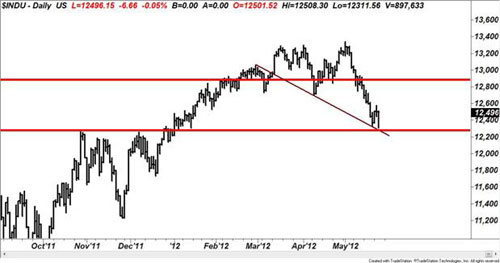
Dow Industrials: The Dow Industrials have been very resilient, which is a testament to what I’ve been telling you all along — that it is in a new long-term bull market; but short- and intermediate-term, the Dow is not acting that well.
The internals on the Dow Industrials are not very strong. The breath of the recent rally is not very healthy. Volume is lackluster. As you can see from this pattern here it’s really not, as Elliott Wave people would call it, impulsive to the upside.
This is a correction. And we are now at a very significant resistance level in the Dow. So I would not be surprised to see the Dow start to roll over.
I’m still looking for a test just below 12,000, 11,500, maybe even 11,000 down here, before the next big leg up in the Dow Industrials occurs.
As quiet as the markets have been in choppy, tight trading ranges over the last couple weeks, and the fact that we’re heading into the dog days of summer, I do recommend that you stay in touch with all my writings and keep abreast of the markets because, as you can see from these charts, things are coiling up and that’s usually a sign, a precursor, of some big moves ahead.
So stay tuned and have a good week.

From the iconic seventies rock band Jefferson Starship …
“If only you believed in miracles …
… like I believe …
… we’d get by.”
The US stock market is currently singing this song.
Indeed, we work our way backwards in today’s Money Monitor, starting with the markets, rather than the macro-data, by observing the chart on display below in which we plot the US S+P 500 stock index.
We focus on today’s upside breakout attempt, an event we anticipated as per yesterday’s Weldon LIVE. The US stock market is banking on a miracle …
… another monetary miracle, to be delivered by the Fed, via QEIII.
Evidence the daily chart on display below revealing that the benchmark US stock index (futures contract) is making a run at key overhead resistance defined by the July 5th intraday high of 1375.00 … in synch with support generated by a increasingly bullish moving average dynamic, and in line with the completed downside Fibonacci retracement.
Reviewing the chart of the S+P 500 exhibited at the bottom of the previous page, we spotlight the fact that the July 5th high of 1375 was established within the context of a key outside-downside reversal day.
Indeed, we observe that, currently, the S+P 500 is well below today’s intraday high, which did in fact ‘breach’ the July 5th high.
Food for thought …
… particularly when we can dissect the deluge of macro-economic data emanating from the US in the last week, and clearly conclude that DEFLATION is becoming increasingly dominant, as the primary macro-force.
Hence, it becomes an easy conclusion … the markets are pinning their hopes squarely on the shoulders of Ben Boom-Boom Bernanke.
The US stock market is riding on the wings of hope …
… and the rally could fly, for a while.
But at the end of the day … the US stock market is DEPENDENT on yet another monetary miracle from the Federal Reserve.
….read the entire 12 page report covering a breath of fascinating issues HERE.
Weldon’s research publications extends an invitation to sign up for a FREE TRIAL for thirty days.
Be sure to listen to Greg’s latest on Money Talks with Michael Campbell tomorrow at 9am PST. You can listen live or in podcast at CKNW.com
Weldon Financial produces independent research for the sophisticated investor and/or trader and offers investment management solutions that capitalize on global market trends. Greg Weldon is the founder and sole producer of all the research and operates his money management services as a registered Commodity Trading Advisor.
Weldon’s Money Monitor offers a very independent, objective view of the global markets by applying a top down market analysis and a bottom up technical analysis. Greg also publishes The Metal Monitor and The ETF Playbook offering specific focus on the precious metals markets (prices of Gold, Silver, etc.) and the world of Exchange Traded Funds, respectively. He has a creative and captivating writing style and his loyal readers have claimed that the ‘research pays for itself over time’.
The Global Macro-Discretionary Program manages money for individuals, joint, trust, corporate and partnership accounts. Mr. Weldon approaches his investment selections from a top-down macro-perspective and then applies his quantitative discipline from the bottom-up to execute his methodology, seeking to produce an absolute return while sharply focusing on risk management. This program invests in a diverse range of futures contracts across the commodity, currency, global stock index, and global fixed-income sectors. Weldon’s Commodity Long-Short Program takes a more quantitative approach, using our proprietary Momentum Trading Indicators, and invests strictly in the strongest ‘bullish’ and ‘bearish’ commodities.
….read the entire 12 page report covering a breath of fascinating issues HERE
Weldon’s research publications are explained in more detail in the Research section above including an invitation to sign up for a FREE TRIAL for thirty days.
One of Michael Campbell’s favorite analysts, Greg Weldon, is Michaels Guest Tomorrow on Money Talks.
From the iconic seventies rock band Jefferson Starship …
“If only you believed in miracles …
… like I believe …
… we’d get by.”
The US stock market is currently singing this song.
Indeed, we work our way backwards in today’s Money Monitor, starting with the markets, rather than the macro-data, by observing the chart on display below in which we plot the US S+P 500 stock index.
We focus on today’s upside breakout attempt, an event we anticipated as per yesterday’s Weldon LIVE. The US stock market is banking on a miracle …
… another monetary miracle, to be delivered by the Fed, via QEIII.
Evidence the daily chart on display below revealing that the benchmark US stock index (futures contract) is making a run at key overhead resistance defined by the July 5th intraday high of 1375.00 … in synch with support generated by a increasingly bullish moving average dynamic, and in line with the completed downside Fibonacci retracement.
Reviewing the chart of the S+P 500 exhibited at the bottom of the previous page, we spotlight the fact that the July 5th high of 1375 was established within the context of a key outside-downside reversal day.
Indeed, we observe that, currently, the S+P 500 is well below today’s intraday high, which did in fact ‘breach’ the July 5th high.
Food for thought …
… particularly when we can dissect the deluge of macro-economic data emanating from the US in the last week, and clearly conclude that DEFLATION is becoming increasingly dominant, as the primary macro-force.
Hence, it becomes an easy conclusion … the markets are pinning their hopes squarely on the shoulders of Ben Boom-Boom Bernanke.
The US stock market is riding on the wings of hope …
… and the rally could fly, for a while.
But at the end of the day … the US stock market is DEPENDENT on yet another monetary miracle from the Federal Reserve.
Be sure to listen to Greg’s latest on Money Talks with Michael Campbell tomorrow at 9am PST. You can listen live at CKNW.com
Weldon’s research publications extends an invitation to sign up for a FREE TRIAL for thirty days.
Weldon Financial produces independent research for the sophisticated investor and/or trader and offers investment management solutions that capitalize on global market trends. Greg Weldon is the founder and sole producer of all the research and operates his money management services as a registered Commodity Trading Advisor.
Weldon’s Money Monitor offers a very independent, objective view of the global markets by applying a top down market analysis and a bottom up technical analysis. Greg also publishes The Metal Monitor and The ETF Playbook offering specific focus on the precious metals markets (prices of Gold, Silver, etc.) and the world of Exchange Traded Funds, respectively. He has a creative and captivating writing style and his loyal readers have claimed that the ‘research pays for itself over time’.
The Global Macro-Discretionary Program manages money for individuals, joint, trust, corporate and partnership accounts. Mr. Weldon approaches his investment selections from a top-down macro-perspective and then applies his quantitative discipline from the bottom-up to execute his methodology, seeking to produce an absolute return while sharply focusing on risk management. This program invests in a diverse range of futures contracts across the commodity, currency, global stock index, and global fixed-income sectors. Weldon’s Commodity Long-Short Program takes a more quantitative approach, using our proprietary Momentum Trading Indicators, and invests strictly in the strongest ‘bullish’ and ‘bearish’ commodities.
Weldon’s research publications are explained in more detail in the Research section above including an invitation to sign up for a FREE TRIAL for thirty days.
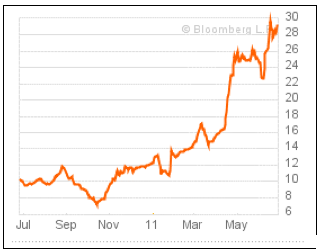
The most important chart in the market might be the chasm between commodities and stocks, as per the chart below. Either the former must rally or the latter will decline. The famous and very rich Jim Rogers said in an interview yesterday:
“the investing game is simple these days. I do believe I could count on one hand the number of times I’ve been presented with an investment opportunity that guarantees success no matter what direction the economy takes.” Rogers adds, “If the world economy gets better, I earn my money on commodities. If the global economy gets worse, then they will print more money and I will make money in commodities.” More of the whole interview HERE
(The CRB Commodite Index is Orange, The SP500 Index is White)

-
I know Mike is a very solid investor and respect his opinions very much. So if he says pay attention to this or that - I will.
~ Dale G.
-
I've started managing my own investments so view Michael's site as a one-stop shop from which to get information and perspectives.
~ Dave E.
-
Michael offers easy reading, honest, common sense information that anyone can use in a practical manner.
~ der_al.
-
A sane voice in a scrambled investment world.
~ Ed R.
Inside Edge Pro Contributors

Greg Weldon

Josef Schachter

Tyler Bollhorn

Ryan Irvine

Paul Beattie

Martin Straith

Patrick Ceresna

Mark Leibovit

James Thorne

Victor Adair