
Timing & trends
North American equity markets are believed to have reached an intermediate low on June 4th. However, macro and micro events (e.g second quarter reports) are expected to dampen enthusiasm for equities until the second half of July. Look for lots of volatility between now and then. This is typical of a market that is developing a base building pattern prior to an important intermediate move on the upside. Now is the time to do your homework on markets and sectors that are top purchase candidates after the base building period is complete.
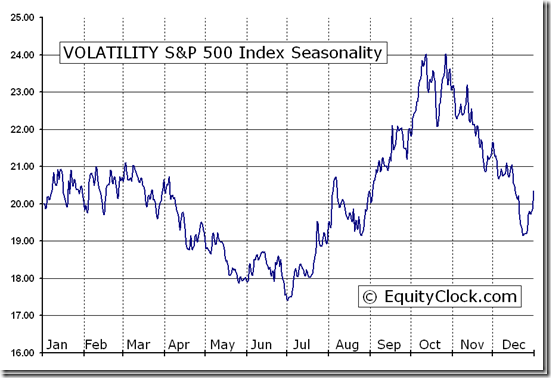
From Equity Clock: Its about to get Interesting – VOLATILITY S&P 500 Index (^VIX) Seasonal Chart
The spectacular response in equity and currency markets to news from Europe on Friday about a possible resolution of Europe’s credit crisis had a significant impact on short term technical indicators. Many markets and sectors at least moved above their 20 day moving average.
Significance of the Eurozone agreement is yet to be revealed. The two page document is the starting point for a plan. The devil is in the details.
Macro events will continue to impact equity markets this week. International events that could impact markets this week include China’s PMI on Sunday night, PMI indices from Switzerland, Italy, France, Germany, the United Kingdom and the Eurozone on Monday, Merkel and Monti meeting on Wednesday and Bank of England and Eurozone central bank interest rate announcements on Thursday.
Intermediate technical indicators improved, but were surprisingly muted. Many equity indices moved to the high end of their recent trading range, but failed to break above those levels. Above these levels lies a band of resistance. Tests of the band of resistance are expected to happen early this week.
Economic news this week is expected to confirm that economic growth in the U.S. continues to slow. The focus is on the employment report on Friday.
Earnings news is not a factor this week. However, the frequency of negative guidance prior to release of second quarter results has escalated and responses to negative guidance has been substantial. Analysts continue to lower consensus second quarter revenue and earnings estimates, sighting slowdowns in Europe and China and the negative impact of currency translation. Despite a year-over-year earnings gain of 33% by Apple, the largest S&P 500 company, S&P 500 companies are expected to report a year-over-year earnings decline of 0.7%.
Seasonal influences early in July are positive during the U.S. Independence day holiday and surrounding days. Main reason for strength is quarter-end money flows and positive anticipation of second quarter results. The former likely will happen, but the latter likely will not.
Cash on the sidelines remains substantial, but is unlikely to be invested until the market determines who will become the next U.S. President.
North American equity markets have a history of moving higher during the second half of a U.S. Presidential election year.
Volumes will be lighter than usual this week due to statutory holidays.
The S&P 500 Index gained 27.14 points (2.03%) last week with all of the gain occurring on Friday. Intermediate trend is down. The Index is testing the top of an eight week trading range between 1,266.74 and 1,363.46. The Index remains above its 20 and 200 day moving averages and moved above its 50 day moving average on Friday. Short term momentum indicators are neutral.

The TSX Composite Index gained 161.02 points (1.41%) last week. Intermediate trend is down. Seven week trading range is between 11,209.55 and 11,824.61. The Index remains below their 50 and 200 day moving averages, but moved above its 20 day moving average on Friday. Short term momentum indicators are neutral. Strength relative to the S&P 500 Index has returned to negative from a brief period at neutral.

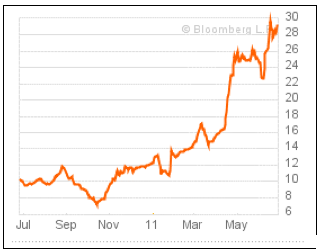
Crude Oil gained $4.84 per barrel (6.05%) last week. Intermediate trend is down. Crude remained below its 50 and 200 day moving averages, but moved above its 20 day moving average on Friday. Short term momentum indicators are recovering from oversold levels. Strength relative to the S&P 500 Index is negative, but showing early signs of change.

Gold gained $26.00 per ounce (1.65%) last week. More than the week’s gain was recorded on Friday. Intermediate trend is down. Seven week trading range is between $1,526.70 and $1,642.40. Gold remained below its 200 day moving average and closed just below its 20 and 50 day moving averages. Short term momentum indicators turned upward from oversold levels on Friday. Strength relative to the S&P 500 Index is neutral/slightly positive.

Go HERE for more of Don’s Vialoux’s Monday analysis of 45 Market Charts

Below, the euro — Is that a monster head & shoulders top that I see?
This is a monthly chart of the Dow going back two years. Note the volume dropping off bearishly on the climb from the September low. The diminishing volume suggests that the bear market will be extended and deceptive. I am using the monthly Dow to eliminate all intra-month movements, which could be confusing. I believe the continuing bear market will be expressed by a long series of monthly declines in the Dow — just as the rise from the September low was expressed by a series of rising Dow monthlies.
Below is a sensitive chart showing the percentage of NYSE stocks holding above their 50-day moving averages. The percentage now is down to 29.9%, meaning that 70% of the stocks on the NYSE are now trading BELOW their 50-day moving averages — and the percentage has been dropping off as we move along.
Despite these pictures of what is actually happening, I note that many big-name analysts are bullish. For instance, the famous Meredith Whitney states that she is “wildly bullish on the US.” She may be correct in her opinion, but I go by the stock market’s opinion. The chart just above hardly backs the case for “wild bullishness,” but if the evidence changes, I hope to be nimble and unprejudiced enough to change with it.
I’m not kidding myself, this is a devilishly difficult market to deal with or analyze. My work shows that we are in a tricky and deceptive bear market. The evidence, as I write, remains bearish. Furthermore, the economic news remains bearish, despite all the public relations efforts to give the news a bullish slant.

Interested in Subscribing? Go HERE
|
Russell began publishing Dow Theory Letters in 1958, and he has been writing the Letters ever since (never once having skipped a Letter). Dow Theory Letters is the oldest service continuously written by one person in the business. Russell gained wide recognition via a series of over 30 Dow Theory and technical articles that he wrote for Barron’s during the late-’50s through the ’90s. Through Barron’s and via word of mouth, he gained a wide following. Russell was the first (in 1960) to recommend gold stocks. He called the top of the 1949-’66 bull market. And almost to the day he called the bottom of the great 1972-’74 bear market, and the beginning of the great bull market which started in December 1974. The Letters, published every three weeks, cover the US stock market, foreign markets, bonds, precious metals, commodities, economics –plus Russell’s widely-followed comments and observations and stock market philosophy. In 1989 Russell took over Julian Snyder’s well-known advisory service, “International Moneyline”, a service which Mr. Synder ran from Switzerland. Then, in 1998 Russell took over the Zweig Forecast from famed market analyst, Martin Zweig. Russell has written articles and been quoted in such publications as Bloomberg magazine, Barron’s, Time, Newsweek, Money Magazine, the Wall Street Journal, the New York Times, Reuters, and others. Subscribers to Dow Theory Letters number over 12,000, hailing from all 50 states and dozens of overseas counties. A native New Yorker (born in 1924) Russell has lived through depressions and booms, through good times and bad, through war and peace. He was educated at Rutgers and received his BA at NYU. Russell flew as a combat bombardier on B-25 Mitchell Bombers with the 12th Air Force during World War II. One of the favorite features of the Letter is Russell’s daily Primary Trend Index (PTI), which is a proprietary index which has been included in the Letters since 1971. The PTI has been an amazingly accurate and useful guide to the trend of the market, and it often actually differs with Russell’s opinions. But Russell always defers to his PTI. Says Russell, “The PTI is a lot smarter than I am. It’s a great ego-deflator, as far as I’m concerned, and I’ve learned never to fight it.” Letters are published and mailed every three weeks. We offer a TRIAL (two consecutive up-to-date issues) for $1.00 (same price that was originally charged in 1958). Trials, please one time only. Mail your $1.00 check to: Dow Theory Letters, PO Box 1759, La Jolla, CA 92038 (annual cost of a subscription is $300, tax deductible if ordered through your business). IMPORTANT: As an added plus for subscribers, the latest Primary Trend Index (PTI) figure for the day will be posted on our web site — posting will take place a few hours after the close of the market. Also included will be Russell’s comments and observations on the day’s action along with critical market data. Each subscriber will be issued a private user name and password for entrance to the members area of the website. Investors Intelligence is the organization that monitors almost ALL market letters and then releases their widely-followed “percentage of bullish or bearish advisory services.” This is what Investors Intelligence says about Richard Russell’s Dow Theory Letters: “Richard Russell is by far the most interesting writer of all the services we get.” Feb. 19, 1999. Below are two of the most widely read articles published by Dow Theory Letters over the past 40 years. Request for these pieces have been received from dozens of organizations. Click on the titles to read the articles. |

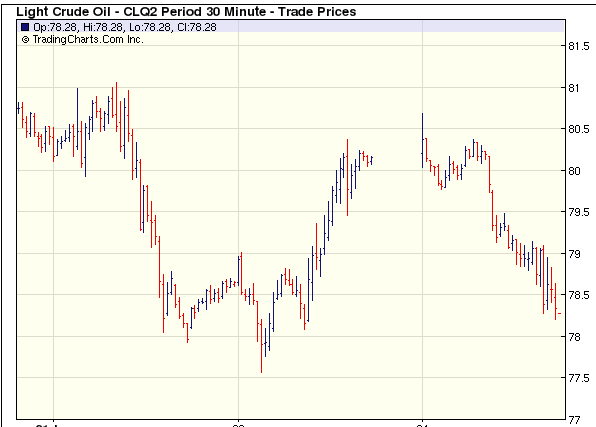
I divide my participation in the markets between my short term trading accounts and my long term savings accounts. I use my short term trading accounts to move in and out of the futures and options markets with positions that I may hold for a few days to a few months. I try to earn trading profits with these accounts but I also see this activity as “keeping my hand in” as I try to gauge what is going on day-to-day in the markets (See Charts Section below.)
My objective with my long term savings accounts is capital preservation and for the past couple of years I’ve been very conservative…mostly in cash…as I’m far more interested in hanging onto that money than in trying to earn a couple of extra percentage points by reaching for yield. My short term trading accounts and my long term savings accounts constitute ~95% of my net worth. Over the past couple of years I’ve diversified my currency exposure by swapping ~25% of my net worth into US$ at an average of ~9700 USDCAD.
I’ve also been pretty conservative with my short term trading accounts. I rarely use leverage and the manic-depressive mood swings of the markets have kept me defensive. Over the past few months I’ve realized that I have little ability to handicap the short term European political response to their growing debt crisis…and thus little ability to anticipate the risk-on/risk-off price swings that result from changing perceptions of the European political theater.
My long term view of what is happening in the world makes me comfortable to have my savings largely in cash. I think we’ve had a 30 year credit boom, the greatest in human history, and that produced a great boom in asset prices and a great willingness, by both borrowers and lenders, to finance risk. I think we are now in a major reversal of that 30 year credit boom, and that this reversal will play out over several years as leverage is wrung out of the markets. Assets that boomed the most on debt financing will likely fall the most as leverage is reduced. To quote Gary Shilling, we are in an “Age of Deleveraging” and I anticipate that deleveraging will grind on relentlessly, regardless of the rearguard actions of central banks and governments.
Perhaps one of the most painful consequences of “Way more money has been borrowed than will ever be repaid” is that “Way more promises have been made than will ever be kept.” It seems to me that politicians of all stripes will try to avoid or deny this problem….but the math is overwhelming…some promises are going to be broken…and some people are going to get hurt as a result of that.
The world economy seems to be falling back into a recession, or worse, as the deleveraging process continues…markets are pricing that in…weak credits have to pay more to borrow money while stronger credits pay less. Commodity prices remain under pressure. Increasing stress on the financial system seem likely to change our world in ways that we haven’t anticipated…and may be poorly prepared to deal with….for instance we will likely see widespread “new arrangements” for pension payouts.
My default position when I look at financial markets is skeptical…I don’t think of myself as a pessimist…but rather as a realist anticipating the inevitable consequences that come after 30 years of irrational exuberance – financed with other people’s money! I expect that one of the key social divides in our not-so-distant future will be “Who is going to pay?” Who is going to have their “entitlements” cut? Who is going to have their “taxes” raised?
Charts Section
(Note: I’m not a trading advisory service. I’m not going to detail my personal trades…but here are a few charts that I find interesting…)
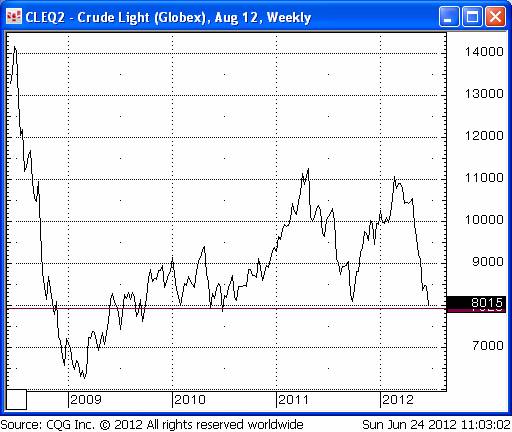
Crude: Short term oversold? Prices are at key support. Decline since Feb. anticipating global economic slowdown / reduced Iran tensions / increasing crude production / and maybe, “substitution” of crude demand with Nat Gas?
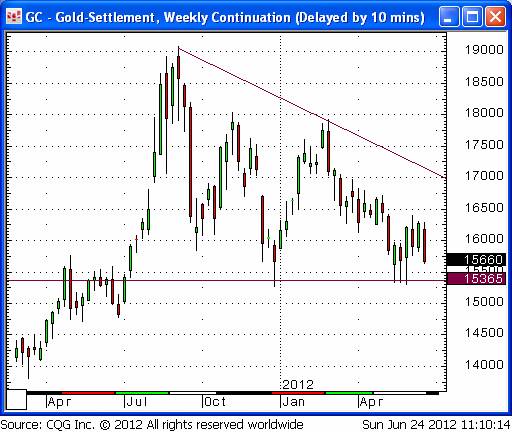
Gold: A test coming of key support levels ~ $1525/35? Downtrend from last September highs looks powerful
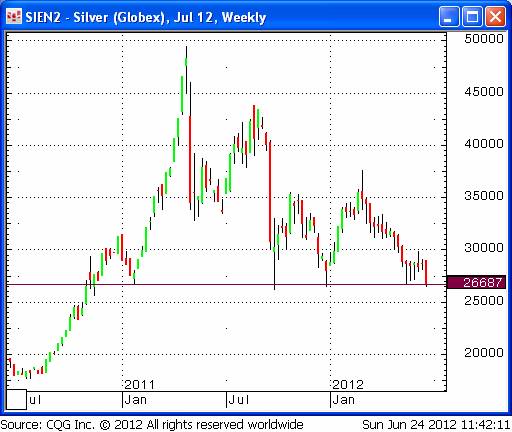
Silver: Right at key support levels…I’d expect a break below $25.
Silver/Gold ratio: continues down from Key Turn Date May 2, 2011. Not positive for “risk” trades.

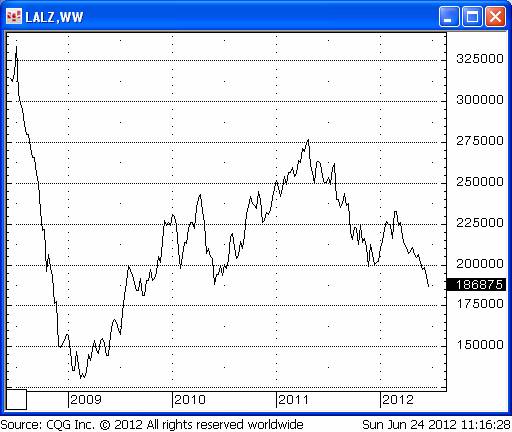
LME Aluminium: Often over-looked relative to copper. But it grinds lower from Key Turn Date May 3, 2011. Hearlding global economic slowdown?
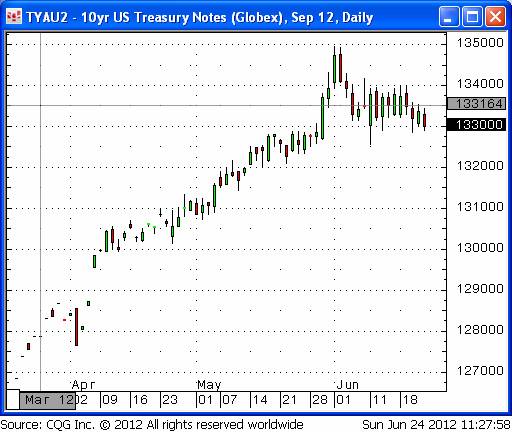
US Ten Year Note: Did we finally make a top in a 30 year bull market in bonds? Maybe…but selling powerful up-trends is rarely a profitable strategy!
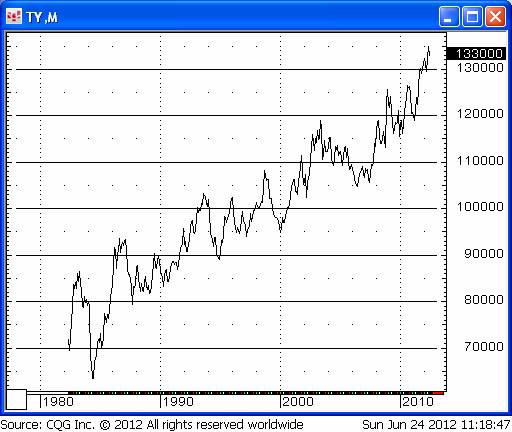
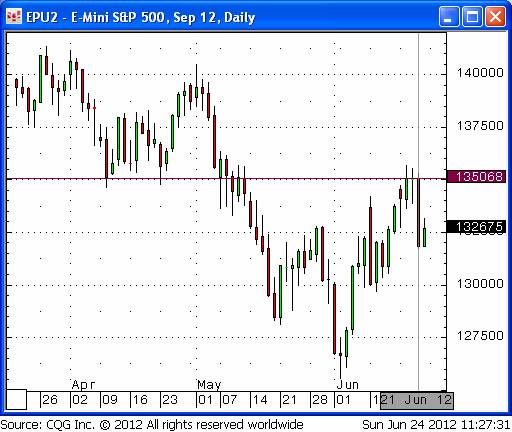
But it is interesting to note on the daily charts that the recent Turn Date of June1/June 4 remains intact and that TNote prices had their lowest close in a month even as the S+P reversed sharply from resistance this past week…
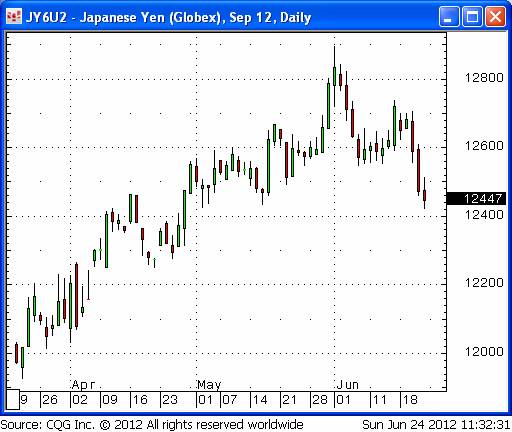
Japanese Yen: the Yen had its lowest close in nearly two months and the recent June 1/ June 4 turn date remains intact. Is the Yen finally starting its long predicted downtrend?

vadair@union-securities.com“>vadair@union-securities.com

TradersVideoPlaybook.com

-
I know Mike is a very solid investor and respect his opinions very much. So if he says pay attention to this or that - I will.
~ Dale G.
-
I've started managing my own investments so view Michael's site as a one-stop shop from which to get information and perspectives.
~ Dave E.
-
Michael offers easy reading, honest, common sense information that anyone can use in a practical manner.
~ der_al.
-
A sane voice in a scrambled investment world.
~ Ed R.
Inside Edge Pro Contributors

Greg Weldon

Josef Schachter

Tyler Bollhorn

Ryan Irvine

Paul Beattie

Martin Straith

Patrick Ceresna

Mark Leibovit

James Thorne

Victor Adair