
Timing & trends

Mark Spitznagel: The Austrians And The Swan – Birds Of A Different Feather
On Induction: If it looks like a swan, swims like a swan…
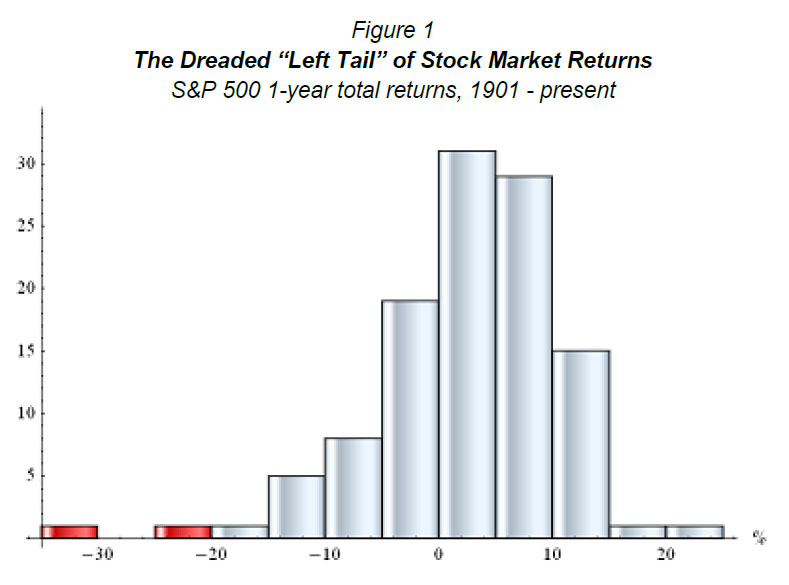
By now, everyone knows what a tail is. The concept has become rather ubiquitous, even to many for whom tails were considered inconsequential just over a few years ago. But do we really know one when we see one?
To review, a tail event—or, as it has come to be known, a black swan event—is an extreme event that happens with extreme infrequency (or, better yet, has never yet happened at all). The word “tail” refers to the outermost and relatively thin tail-like appendage of a frequency distribution (or probability density function). Stock market returns offer perhaps the best example:
 \
\
What is a black swan event, or tail event, in the stock market?
It depends on who’s asking.
To those familiar with Austrian capital theory, the impending U.S. stock market plunge (of even well
over 40%)—like pretty much all that came before in the past century—will certainly not be a Black
Swan, nor even a tail event.
Nonetheless, the black swan notion is paramount—in perception: Market participants’ failure to
expect a perfectly expected event—that is, they price in only Anglo swans despite the Viennese bird
lurking conspicuously in the weeds—much like what is happening today, brings tremendous
opportunity.
….read the entire analysis including charts HERE
“It is surprising that “Gloom” is being reported so soon after “Boom” was front page stuff. Understandably, “Ooops” had its moment, but really Earth-shaking gloom has yet to occur.”
SIGNS OF THE TIMES:
“Growth in loans to households and companies in the 17-nation euro area slowed in March as a cooling economy curbed demand for credit.”
“Euro-region unemployment rose to a 15-year high and manufacturing contracted for the ninth month.”
– Bloomberg, May 3
“Gloom Builds for Euro Zone, United States”
“Dampened Hopes for Gradual Recovery”
– Reuters, May 4
Perspective
Of the sectors we follow, base metal miners (SPTMN) provided the best lead to the sell-off in the senior stock indexes. We were looking for a rolling top centered around February and the SPTMN set its high in late January and failed on the test in February. Often, mining stocks lead the high in base metal prices and this was the case as metals (GYX) set their high in February.
As noted at the time, the gold sector (GDX) also set a high in early February and this year’s high for gold was at the end of the month. In retrospect, it was some five weeks ago that we concluded that the “opposite” action between golds and the big board was developing. This is important for the longer term.
However, the action is somewhat oversold and a pause or bounce in most sectors seems possible.
Commodities
Gasoline had a good run to a daily RSI of 90 at the end of February with the actual high at 3.43 at the end of March. This compares to the high of 3.42 in May, a year ago, and with 3.63 in 2008.
The plunge was to 2.91 on Monday, with an RSI at 29. That’s a big swing from very over bought to rather oversold, and a brief rally seems possible. The chart follows.
Seasonals have been running some weeks ahead of “normal” and it is uncertain how long the “summer driving” rally will last.
Base metals declined as well, but without the extreme swing of gasoline prices. Prices could briefly bounce, within what seems to be a cyclical bear that started in April 2011.
Soybeans and soybean meal were the last runners in the rally and, as noted last week, had accomplished an Upside Exhaustion reading. The rally for ‘beans started at 1094 in December and the high was 1512 last Thursday.
Agriculturals were delayed on the probable commodity rally from October to around February. Soybean complex did the best on the late rally, but these did not participate with the cyclical peak for most commodities set in 1Q2011. A test of the high is needed before the call can be made for another cyclical peak.
Sugar, corn, cotton and wheat have declined to 52-week lows.
The CRB reached 370 on last year’s excitement, which compares to this year’s at 326. The really heroic high of 474 was helped by the “Peak Oil” mania of 2008.
Currencies
The Canadian dollar set its really heroic high at 110 in late 2007 and plunged to 76.6 with the crash that ended in 2009. The high with last year’s excitement about commodities was 106, which compares to 102 reached this year.
It could trade in a narrow range for a number of weeks.
Action in the DX continues constructive, but it will take some time to rise through overhead resistance at the 80 level. A pause in the advance would assist most financial markets, including nominal prices for gold and silver.
Credit Markets
Generally, US spread markets remain benign while Mother Nature’s assault on castles in Spain is generating headlines – again. As the nearby chart shows, prices have declined in the past few days. Because of all of the engineered mark downs and other folderol, exact comparisons to the disaster of last August-September can’t be made.
But we can consider that April’s price improvement is the set up to the reversal in credit markets expected in May.
We have found that if there is a party in spread products in the first part of the year (Yes!) the seasonal change in May (???) can lead to a disaster later in the year (???).
The collapse of LTCM in August-September 1998 is the classic example of reversing spreads taking out a prestigious firm.
If history continues to guide, sovereign debt markets will drift into another calamity after mid-year. Our study on the subject was written about twenty years ago and we like to use it in a timely fashion. SOVEREIGN DEBT FOLLIES is attached. The sub title is “IT HAS TAUGHT US NOTHING”.
Last week’s view on the long bond was that the rally against setbacks in the stock market was appropriate, but that it was getting tired. And then the future added a couple of points. The price could decline a little as the orthodox investment world of stock and commodities firms somewhat.
Link to May 11th ‘Bob and Phil Show’ on TalkDigitalNetwork.com:
http://talkdigitalnetwork.com/2012/05/morgan-moves-markets/
Greek Bond Price

BOB HOYE
PUBLISHED BY INSTITUTIONAL ADVISORS
JUNE 29, 2011
(Previously Published February 23, 2010)
SOVEREIGN DEBT FOLLIES
“IT HAS TAUGHT US NOTHING”
Another episode of sovereign defaults seems to be well under way, which prompts the question about just how bad can it get? The above quotation is from a 1933 study of that example of government defaults and as the writer notes, it was preceded by a “new borrowing orgy”. The word “new” is important because the literature often includes the description “new financial era”. The first one, the South Sea Bubble, culminated in June 1720 and it has essentially been the model for five subsequent ones, including the example that completed in 2007.
Although the stock market attracts the most attention during a great financial mania, the action has included the equivalent mania of investors reaching for yield and brokers reaching for commissions. There is a typical path that defines a post-bubble contraction that includes widespread remorse and chagrin. In the credit markets this has included the collapse in sub-prime mortgages, the hit to corporate bonds and more recently the contraction is threatening the sovereign debt market. The focus has been on the PIIGS, but if the past is any guide this is the initial phase of another historical problem in sovereign debt.
During the New Era that culminated so extravagantly in 1825, London was the financial centre and the City floated issues by Russia, Prussia, Spain, and a number of Latin American countries as well as cities.
For example, Peruvian 6 percents were done at 88 in 1822 for a yield to maturity of 6.95%; then again at 82 for a 7.50% yield in 1824, and at 78 (7.85%) in 1825. Then the market became illiquid and eventually collapsed with the usual post-bubble deflation. Some 70 U.K. banks stopped payment and Rothschild assisted in preventing the Bank of England’s default.
With the usual swings in the business cycle, the contraction continued until the mid- 1840s.
The next long expansion ended with a mania of asset speculation in 1873. At the height of that mania and as credit markets were becoming stressed an important New York newspaper editorialized that nothing could go wrong. The main point was that the US did not have a central bank that would be constrained by the gold standard in accommodating the needs of Wall Street.
Instead there was confidence that the Treasury System and its admired secretary could issue massive amounts of credit by buying bonds out of the market.
While recklessness was rampant, there were rational comments. The Economist‘s April 27, 1872 edition advised:
“Avoid states which are constantly borrowing, which must therefore be paying off the interest on their old debt with the fresh loans.”
The progress of a disaster in sovereign debt in 1873 was nicely chronicled by headlines in The Economist:
June 7: “The Approaching Spanish Repudiation”
July 5: “[Spain] Making Arrangements for the Payment of Current Coupon”
August 2: “Spanish Interest Will Not Be Paid”
August 30: “Anarchy in Spain”
The Argentine crisis of 2001 was documented by headlines from a number of publications. It is worth noting that as late as June there was confidence “Appetite for Credit Risk has Improved Considerably”.
July 18, 2001: “Markets Laud Argentine Debt Accord – Calms Fears of Default”
August 3, 2001: “Flurry of International Contacts to Prevent [Argentina] Default”
December 14-20, 2001: “Angry Argentines Take Their Displeasure to the Streets”
“State of Siege”
“Looters Ravage Cities”
There seems to be a common pattern on the transit from confidence to dismay, and it will be interesting to see how it works out this time around. The distinction is that the 1873 example included many countries and as the historian, S.G. Checkland, wrote “Many half-barbarous states pressed eagerly for funds, and spent them with no display of wisdom.”
The Argentine problem in 2001 was not accompanied by insolvencies in a number of countries.
However, there is no question that the 1930s disaster in all lower-grade debt was part of a massive post-bubble contraction. It was reviewed in Foreign Bonds: An Autopsy, a rather appropriate title, published by Howland Swain Company in 1933:
“The fiscal history of Latin America … is replete with instances of governmental default. Borrowing and default follow each other with almost perfect regularity. When payment is resumed, the past is easily forgotten and a new borrowing orgy ensues. This process started at the beginning of this past century and has continued down to this present day. It has taught nothing.”
How bad can it get? Typically the post-bubble contraction afflicts all aspects of the financial markets – including sovereign debt. The process is devastating and continues until both lenders and borrowers vow to never be reckless again.
Ampersand
Sovereign Follies 2010:
January 14: “Greece Unveils Stability Program”
January 21: “Investors are concerned that Greece won’t be able to finance its budget deficit.”
February 14: “Years of unrestrained spending, cheap lending and failure to implement reform.”
February 17: “Greek Tragedy Averted, For Now”
February 24: “Greek Police, Protesters Clash”
April 11: “Emergency Aid Approved”
August 10: “Greek Debt Crisis Finally Over”
August 10: “Greece is one part of the crisis and it has faded from the headlines.”
2011:
May 29: “Thousands of protestors denounce Greece’s entire ruling class.”
June 28: “Greek Debt Crisis Leads to Mass Strike”
June 28: “Greece Faces ‘Suicide’ Vote on Austerity”
“Bankruptcies of governments have, on the whole, done less harm to mankind than their ability to raise loans.”
– Prof. R.H. Tawney, Religion And The Rise Of Capitalism, 1926
Two-Year Greek Government Notes
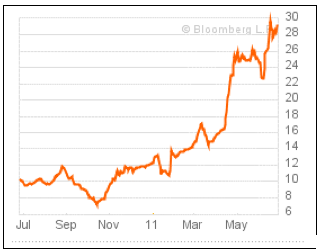
- August 10, 2010: “Greek Debt Crisis Finally Over”: Yield 9%.
- June 28, 2011: “Greece Faces ‘Suicide’ Vote on Austerity”: Yield 30%.
The United States, meanwhile, becomes a recipient of global capital flows when uncertainty shadows over developed‐nations’ capital markets and emerging market growth prospects.
So, from an equities perspective the US has outperformed global stock markets; and from a global growth perspective commodities have been beaten down.
From here, if you believe global growth will remain subdued and other fundamental risks will hurt economies and markets throughout the world, it’s tempting to expect US stocks will play catch‐up and move lower with global equities and commodities. After all, the Federal Reserve hasn’t brought new quantitative easing to the table and likely won’t for some time.
But it may be a bit premature to expect US equities will plunge. Likewise, this downturn in commodities may be getting a bit long in the tooth.

A clip from Mark’s premium service:
The stock market is rallying today on good US economic news and hopes Greece won’t leave the euro after comments from German Chancellor Angela Merkel. Nevertheless, traders are playing it safe and the market has given up most of its gains. The Dow was up as much as 90 points but is now up 47 or 0.4%. The S&P 500 is up 5 or 0.4% and the NASDAQ is up 5 or 0.2%.
Industrials are the biggest winners (XLI +0.5%) after GE (GE +4.1%) said its finance unit will pay a special dividend of $4.5 billion to the parent company this year.
Retailers are trading little changed (XRT +0.5% and RTH +0.1%) after Target (TGT +0.4%) reported better than expected earnings but JC Penney (JCP -17.0%) and Abercrombie & Fitch (ANF -12.9%) reported disappointing results.
Treasuries are down slightly after this morning’s good economic news and as traders shift into equities. Yet, Treasuries are holding up well considering the “good” news, showing that traders are still cautious about the economy and sovereign debt crisis in Europe. The long bond future is down 3/32 to 146 10/32.
The US Dollar Index hit is up for the thirteenth straight session, its longest run since 1985, after the US reported good economic news, in contrast to the troubles being suffered in Europe. The US Dollar Index is up 0.174 to 81.395 and hit a four month high of 81.573 this morning.
The European Central Bank said it will support Greek banks amid rumors that it was considering a freeze in funding.
Greece’s 10-year interest rate slipped 0.48% to 28.92%. Spain’s 10-year rate fell 0.05% to 6.30% and Italy’s by 0.3% to 5.83%.
The Euro is down 0.05% against the Dollar.
Precious metals are trading mostly lower as the Dollar rallies again. Gold is down 2.00 to 1542.30 after hitting a new 4 ½ month low of 1526.20 this morning. Gold is now testing support from the 1521.80 low set on December 29. Silver is down 0.10 to 27.62 after hitting a low of 27.13. Platinum is up 3 to 1430 after dropping to 1418. Palladium hit a 5 ½ month low of 586 this morning and is now down 3 to 588. Copper is down 0.0400 to 3.4775.
Oil is currently down 0.98 to 93.00 after hitting a new six-month low of 91.81 this morning.
The Energy Information Administration said crude inventories rose by 2.1 million barrels in the latest week, above expectations for a 1.5 million barrel increase. Gasoline inventories declined by 2.8 million barrels versus forecasts for a smaller 480,000 decrease. Distillate supplies fell by 1 million barrels versus forecasts for a 120,000 increase. In total, petroleum supplies fell by 1.7 million barrels while analysts expected an increase of 1.1 million barrels.
Housing starts rose 2.6% to a seasonally adjusted 717,000 in April. Economists expected starts of just 690,000.
Industrial production rose 1.1 percent in April, its biggest increase since December 2010 and well above forecasts of a 0.7% gain.
——————————————-
CANADIAN NEWS:
The Canadian market is trading mixed as equities rise but mining stocks remain under pressure. The TSX is up 35 or 0.3% but the TSX Venture is down 7 or 0.6%.
The Canadian Dollar is falling as traders buy US Dollar. FXC is down 0.36 to 98.39.
Manufacturing sales rose 1.9% in March, the biggest increase in six months.
——————————————-
From Yale Hirsch:
My 1987 Stock Trader’s Almanac was dedicated to THE NEW PROGNOSTICATORS.
Mark Leibovit was one of them. I evidently had insight as Timer Digest named Mark the
“Number One Market Timer for the 10-year period ending in 2007.”
For the 10 years ending 2009, he was #2 intermediate Market Timer.
He is also their #1 Gold Market timer for 2011.
This book should be REQUIRED READING for anyone who trades.
——————————————–
My book, ‘The Trader’s Book of Volume’ (published by McGraw-Hill) is now available.
Here is the link to Traders Press:
http://www.invest-store.com/vrtrader/
Here is the link to Amazon.com:
——————————————–
Mark Leibovit, From Timer Digest August 8, 2011 issue:”TIMER OF THE YEAR RACE AT JUNE 30 “We congratulate Mark Leibovit of VRTrader.com, the 2011 Mid-Year leader.
Mark Leibovit is also currently ranked #2 Gold Timer and was ranked #1 for the second-half of 2011.
VRTRADER.COM Trial Signup:
Here is the Special Trial Offer: Use this month to kick our tires. Pay 50% for the first 30 days (No refund) and sample our Silver or Platinum service and then decide what works best for you. If you aren’t 100% ready to move forward, simply email us to cancel one week before your 30 day 50% off trial subscription ends and it will be canceled and you will not be charged ANY FURTHER, no questions asked. Just send an email to mark.vrtrader@gmail.com or call 928-282-1275 to cancel. You will receive an emailed confirmation of your cancellation at that time.
The 30 day trial is allowed one time only. By taking this 30 day 50% trial, you agree to be charged the full cost of the monthly Silver or Platinum service (choose one only) at the end of the 30 day trial subscription period, unless you cancel first. The regular Silver monthly rate is $49.40 and the Silver quarterly rate is $133.50. The regular Platinum monthly rate is $129.95 and the Platinum quarterly rate is $350.85. The special trial 50% off trial rates are listed below. Sign up today!
There are no refunds or pro-rata refunds offered at VRTrader.com for any subscription. You are being offered a 50% discount for trying our service for the first 30 days only!

-
I know Mike is a very solid investor and respect his opinions very much. So if he says pay attention to this or that - I will.
~ Dale G.
-
I've started managing my own investments so view Michael's site as a one-stop shop from which to get information and perspectives.
~ Dave E.
-
Michael offers easy reading, honest, common sense information that anyone can use in a practical manner.
~ der_al.
-
A sane voice in a scrambled investment world.
~ Ed R.
Inside Edge Pro Contributors

Greg Weldon

Josef Schachter

Tyler Bollhorn

Ryan Irvine

Paul Beattie

Martin Straith

Patrick Ceresna

Mark Leibovit

James Thorne

Victor Adair