
Timing & trends
“There is only one side of the market and it is not the bull side or the bear side, but the right side.”
– Jesse Livermore
I guess it is no different this time. There are always more questions than answers. I guess the first question is: Are we finally seeing a change to the “all one market” liquidity-driven correlations in global markets?
For about seven years running, maybe more, it seemed there was only one market (and that market did the funding). Of course this period was qualified by the terms “risk on” or “risk off” … and still is. In effect, the ebb and flow of growth expectations, reinforced by market liquidity, drove risk assets. Risk assets are now considered a broad bundle including: stocks, commodities, and currencies (except for the US dollar, which was the major funding currency for this all-one-market move) which moved sharply higher in lock-step correlation.
This tightly correlated bundle of assets seems no longer to be acting as one big market, as you can see clearly in the chart below:
Dow Jones Industrial Average vs. Euro Stoxx 50 Index vs. CRB (commodities) index vs. EUR/USD Weekly:

Why has this changed? Why the divergence? Theories seem to abound; here are a few we think about … and then some reasons why we are skeptical:
I. Money is flowing out of Asia on decelerating Chinese growth and out of Europe on structural risk and must hide in the US market.
A. If money is flowing that freely into the US, why has the US dollar been such a dog? Shouldn’t it benefit from that flow? It hasn’t, at least not much.
B. If money is flowing from Europe on structural risk, why is the Euro supported?
1. And if long-term structural portfolio positions were that afraid of the euro, why is gold lagging, i.e. why isn’t it getting some of that haven flow?
C. If stock buyers site US economic growth momentum as their primary rationale, why are commodities prices not ticking higher accordingly?
D. If US economic growth is the driver, why are US bonds in the ozone still?
E. If the US stock move higher is based in large part to the rising probability the Fed gives us QE3, which makes sense, why isn’t the dollar in a tail spin, and why aren’t other risk assets following stocks?
To Read More CLICK HERE

IS THE CORRECTION OVER?
Precision timing for all time frames through a multi-dimensional approach to technical
analysis: Cycles – Breadth – P&F and Fibonacci price projections
and occasional Elliott Wave analysis
“By the Law of Periodical Repetition, everything which has happened once must happen again, and again, and again — and not capriciously, but at regular periods, and each thing in its own period, not another’s, and each obeying its own law… The same Nature which delights in periodical repetition in the sky is the Nature which orders the affairs of the earth. Let us not underrate the value of that hint.” ~ Mark Twain
Current Position of the Market
SPX: Very Long-term trend – The very-long-term cycles are down and, if they make their lows when expected (after this bull market is over) there will be another steep and prolonged decline into late 2014. It is probable, however, that the steep correction of 2007-2009 will have curtailed the full downward pressure potential of the 120-yr cycle.
SPX: Intermediate trend – The intermediate uptrend is still intact and the short-term correction could be over.
Analysis of the short-term trend is done on a daily basis with the help of hourly charts. It is an important adjunct to the analysis of daily and weekly charts which discusses the course of longer market trends.
Daily market analysis of the short term trend is reserved for subscribers. If you would like to sign up for a FREE 4-week trial period of daily comments, please let me know at ajg@cybertrails.com.
Market Overview
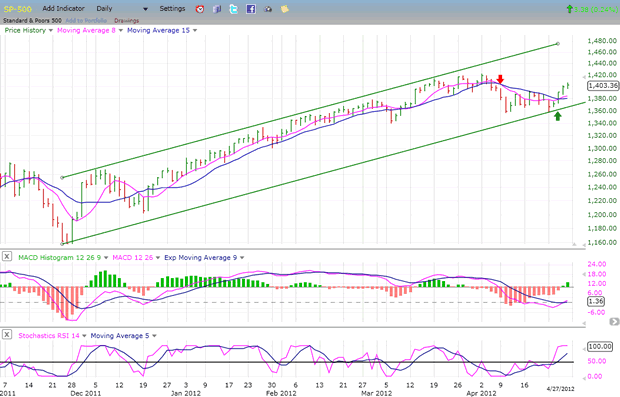
After last week’s SPX performance it’s possible that the market correction is over. The cycle low which was ideally due for next week may have come in about a week early, and could have been responsible for the spike down to 1359 and the subsequent rally. This would mean that the 1357 low of 4/10 has held and that the SPX could see higher prices before it is challenged again.
With this market action, my former scenario may have to be modified. The rally which started at 1359 last Monday met its initial Point & Figure projection of 1405 on Friday. It’s a good bet that we could get a correction now that this target has been reached. The type of correction will decide whether the cycle has truly bottomed early, or if it is still ahead of us. The reason why this is not certain is because there are other current cyclical factors which could explain the market’s behavior.
EW analysts are divided on the current structure. The view that 1359 was the end of wave 4 and that wave 5 is now underway is meeting with skepticism by those who believe that the corrective action which started at 1422 is not over. How the SPX corrects from 1405 should go a long way toward clarifying the structure.
Should this be the beginning of wave 5 from 1359, we should have just completed wave 1 of 5 at 1405 on Friday. After a corrective wave 2, the next wave should take us to about 1424/1427, and there is the potential for an ultimate move to about 1450. A P&F projection to that level is confirmed by several Fibonacci calculations — providing the SPX can rise above 1422. If the SPX cannot get above that level, it would force us to consider that we may only be dealing with an extension of the correction.
To Read More CLICK HERE

By: Nouf
The decline that we have seen over the past few weeks has been very corrective and does not support a strong break lower; the result was a strong reversal higher from our targets as expected. If you noticed the AUDUSD pair failed to take out its previous lows so held key support, as well as oil holding the $102 area. As long as you see other risk markets support US stocks I don’t see any evidence to support a bearish stance atm.
Oil and AUDUSD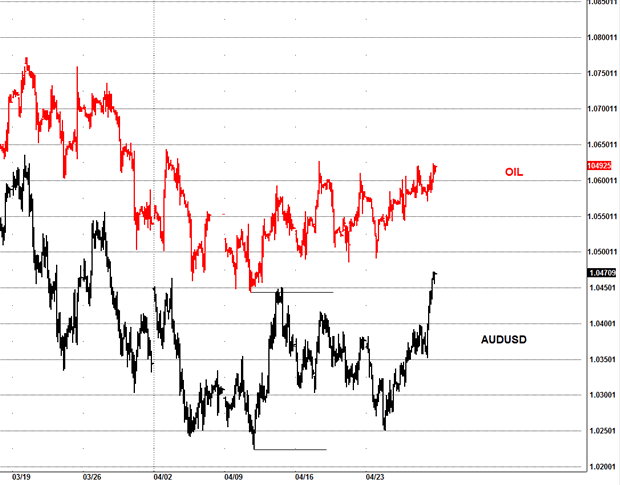
Simply put the bears never stood a chance, the trend remains up since the Oct 2011 lows and we need to respect that, the low is likely in although there is an alternative ideas in the markets to test those lows again we saw in the week, but that will only come on a breakdown of previous support areas.
NDX
Following on from last week’s report, we indeed got the new low I was expecting and covered our shorts at the lows, the NDX hit my target and reversed, thus confirming the decline likely completed and the bulls take the markets higher.
The target was 2636 as posted from last week’s report, it got triggered and the bulls really did make a stand, one would think they got my “special” areas in advance.
To Read More CLICK HERE
By: Eric Sprott & David Baker
This may not come as a surprise, but we’re still not seeing it. We’re not seeing a US recovery.
Here we are, well into 2012, and the fact remains that the US housing situation is still a bust. There is simply no housing recovery happening in the United States. US New Home Sales fell for the fourth time in a row month-overmonth in March, representing a seasonally-adjusted annual rate of 328,000, down from 353,000 in February.1 Do you know what the annual rate of New Home Sales was back in 2006? About 1.21 million.2 No recovery there.
Same goes for US Existing Home Sales, which fell unexpectedly by 2.6% in March to an annual rate of 4.48 million units.3 Again – would you care to know where they were in the same month back in 2006, before the financial system fell apart? Approximately 6.92 million units.4 No recovery there either.
Then there’s unemployment. Judging by all the recent earnings-release cheerleading, March’s jobs numbers seem to have been forgotten, but they were plainly weak. The US Labor Department showed US hiring slowing to a mere 120,000 new jobs in March, below expectations of 200,000+.5 That’s not a recovery. That’s simply weak data.
Same goes for the most recent jobless claims numbers, which have been running above 380,000 for the last two weeks, above the 375,000 threshold that supposedly signals future unemployment increases.6 Again – this is not positive data, this is weak data. How high will it have to go before the economists admit that it’s weak? 400,000? 425,000? We’re asking – we’d like to know.
Then there are US tax receipts, which continue to point in the same direction. If the US is recovering so strongly, then why are employment tax receipts only up 2%? ($484 billion fiscal year-to-date as of March 2012 vs. $475 billion over the same period to March 2011).7 A 2% increase is explainable by inflation alone, which was last reported running at 2.7% according to the Bureau of Labour Stastics.8 Shouldn’t the tax receipts be much higher than that? Wasn’t unemployment down so far this year? As the Associated Press plainly states, “The unemployment rate has fallen to 8.2% in March [2012] from 9.1% in August [2011]. Part of the drop was because people gave up looking for work. People who are out of work but not looking for jobs aren’t counted among the unemployed.”9 Oh! Sorry,… now the numbers make more sense. There hasn’t been any net new employment at all. Question: if everyone “gives up” looking for work next week, will the US unemployment rate go to zero? We’re asking – we’d like to know.
Other economic indicators exhibit the same downward momentum that the pundits are loath to acknowledge. For example, the Economic Cycle Research Institute’s (ECRI) Weekly Leading Indicator index, which had been rising from its 2011 lows earlier this year, has resumed its downtrend in April.10 More recently, US Durable Goods Orders were revealed to have dropped 4.2% in March, representing the largest decline since January 2009.11 To top it all off, China’s most recent Purchasing Managers Index (PMI) indicated that China’s manufacturing activity has now been in contraction for six months in a row.12
To Read More CLICK HERE
FIGURE 1: SPANISH BANKS – DEPOSIT AND EUROSYSTEM FUNDING (% OF TOTAL ASSETS), 1999 – FEB 2012
Submitted by
Eurozone: The “Lull” in the Eurozone debt crisis created by the LTRO loans is over as Spanish interest rates rise and European stocks (especially in periphery countries) fall.
The Eurozone debt crisis is a slow motion train wreck…the “authorities” have been merely postponing the inevitable…which is that “way more money has been borrowed than will ever be repaid.”
Austerity produces weaker economies that will not generate the revenue needed to cover debts and deficits and the social costs that come with weaker economies.
More lending, made on the premise that it will start a virtuous circle of strengthening economies and reduced deficits, doesn’t work and only makes the un-payable mountain of debt bigger.
The only way out for the over-indebted periphery countries is to “write off” huge debts…to default…to withdraw from the common currency…to declare bankruptcy…but this is what the entrenched Euro elite is so determined to avoid…so they postpone the inevitable…perhaps hoping for a miracle…perhaps believing that a full blown financial crisis will pave the way for political union…but the Germans may have second thoughts on that after their experiences with the expense of the East-West German political union….
Euro elections: the first French elections are this Sunday…with the run-off elections on May 6. Sarkozy is likely to lose to Hollande… the socialist who wants to “soak” the rich, lower, yes lower, the retirement age, re-negotiate treaties and basically do the socialist “tax and spend” program. He wants to change the mandate of the ECB from controlling inflation to promoting growth…expect the Germans to not be amused…a breakdown of political cooperation could lead to greater troubles in Eurozone. The Germans are facing a Hobson’s choice: blow up Europe…or pay an un-Godly price to keep it together….
To Read More CLICK HERE


-
I know Mike is a very solid investor and respect his opinions very much. So if he says pay attention to this or that - I will.
~ Dale G.
-
I've started managing my own investments so view Michael's site as a one-stop shop from which to get information and perspectives.
~ Dave E.
-
Michael offers easy reading, honest, common sense information that anyone can use in a practical manner.
~ der_al.
-
A sane voice in a scrambled investment world.
~ Ed R.
Inside Edge Pro Contributors

Greg Weldon

Josef Schachter

Tyler Bollhorn

Ryan Irvine

Paul Beattie

Martin Straith

Patrick Ceresna

Mark Leibovit

James Thorne

Victor Adair