
Timing & trends

Those familiar with the diamond industry know that few mineral discoveries can reap larger fortunes than an economic diamond mine.
A case in point is the Ekati diamond mine discovered in the Northwest Territories in 1991. Dia Met Minerals, which had a 29 per cent stake in the project that would become Ekati, saw its shares soar from $0.65 to $65.00 in the 18 months following the discovery.
Dia Met eventually sold its interest in Ekati for $800 million in 2001. To give you a sense of how lucrative the mine has been, consider that, despite having a capex of $900 million and being located in the Canadian barren lands, it paid back that total in just 18 months.
The discovery of Ekati set off a diamond rush that would put Canada on the map as a diamond destination.
But as analysts pore over the world’s current and future diamond production, it’s projected that demand will grow faster than supply. A recent Bain report forecasts that demand will grow by 4% annually while rough diamond production will only grow by 1% or less.
Clearly, more diamond mines need to be found to meet demand, but where will they come from?… CLICK for the full article


Paul Rejczak weighs in on a downtrending S&P 500, and gives his take on where it’s headed next.
The U.S. stock market indexes lost between 0.6 percent and 1.2 percent on Wednesday, extending their short-term downtrend, as investor sentiment worsened. The S&P 500 index got very close to the level of 2,800 before bouncing off that support level. It currently trades 1.9 percent below the January’s 26th record high of 2,872.87. The Dow Jones Industrial Average lost 0.6 percent and the Nasdaq Composite lost 1.2 percent on Wednesday…. CLICK for complete article


Iran’s supreme leader Ayatollah Ali Khamenei announced in a statement Monday that there would be neither war nor negotiations with the United States.
“Recently, U.S. officials have been talking blatantly about us. Beside sanctions, they are talking about war and negotiations,” the senior cleric wrote via his Twitter account in English.
He added, using all caps to close the statement, “In this regard, let me say a few words to the people: THERE WILL BE NO WAR, NOR WILL WE NEGOTIATE WITH THE U.S.” CLICK for complete article

“It’s a bizarre occurrence and it will not be resolved soon.”
Orders for Class 8 trucks in July jumped 187% from a year ago to 52,250 units, the highest number of monthly orders ever. These are the heavy trucks that haul a significant part of the goods-based economy across the US…. CLICK for complete article
It’s time for our annual August report, “Charts for the beach.” Each year we highlight five of our favorite charts we think consensus is currently overlooking. Remember to ask your RBA representative for your official RBA eyeglass cleaning cloth to keep your sunglasses spotless!
Profits (not GDP or politics) drive the stock market.
At RBA, we approach the current environment by staying disciplined, slowing down the investment process, and by staying dispassionate with respect to politics.
Along those lines, our first two charts show US real GDP and corporate profits through time. There has been considerable hoopla about the strength of GDP growth during the second quarter, but US real GDP growth remains within a slow-growth band that has existed since the bursting of the Technology bubble in 2000 (See Chart 1).
CHART 1:
US Real GDP
(QoQ % Jan. 1946 – Jul. 2018)
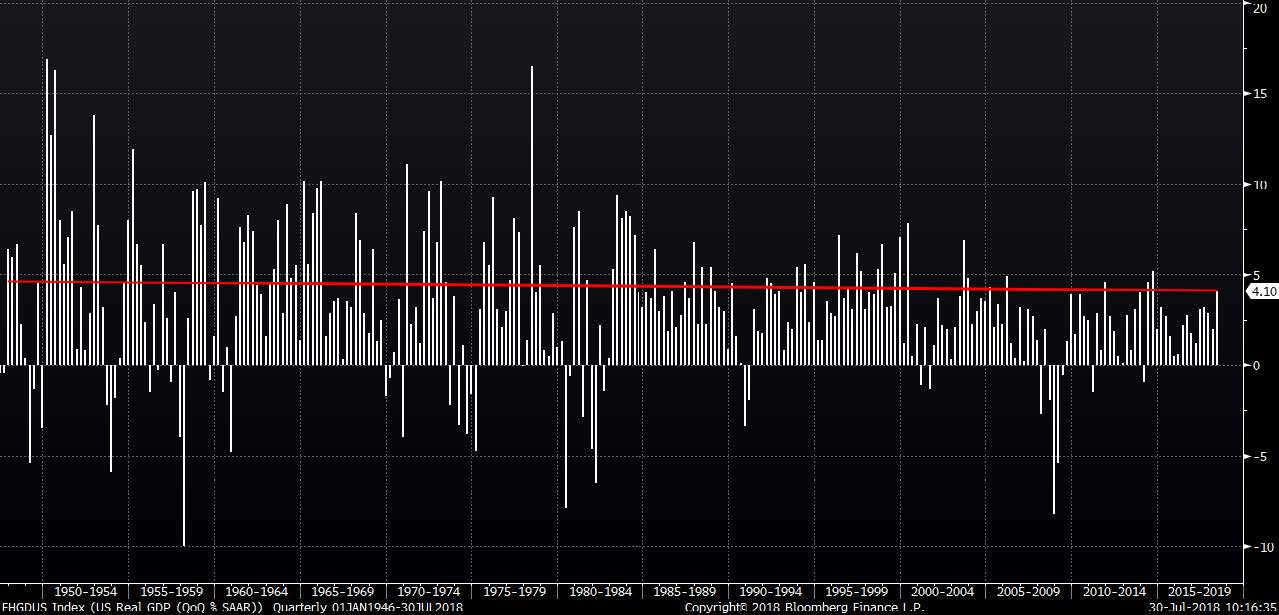
Source: Bloomberg Finance L.P.
Chart 2 helps explain why the US bull market has been so powerful despite continued anemic GDP growth by highlighting corporate profits as a percent of GDP. The corporate sector’s proportion of national income rose to all-time highs post-2010. This ratio has smartly rebounded, which has fueled the more recent leg of the bull market.
Contrary to popular belief, the corporate sector (upon which the stock market ultimately focuses) has been historically healthy relative to the overall economy. The combination of tremendous liquidity provided by the Federal Reserve and an historically healthy corporate sector seems to justify both the length and magnitude of the 9-year bull market.
CHART 2
US Corporate Profits as a Percentage of GDP
(4Q 1947 – 1Q 2018)
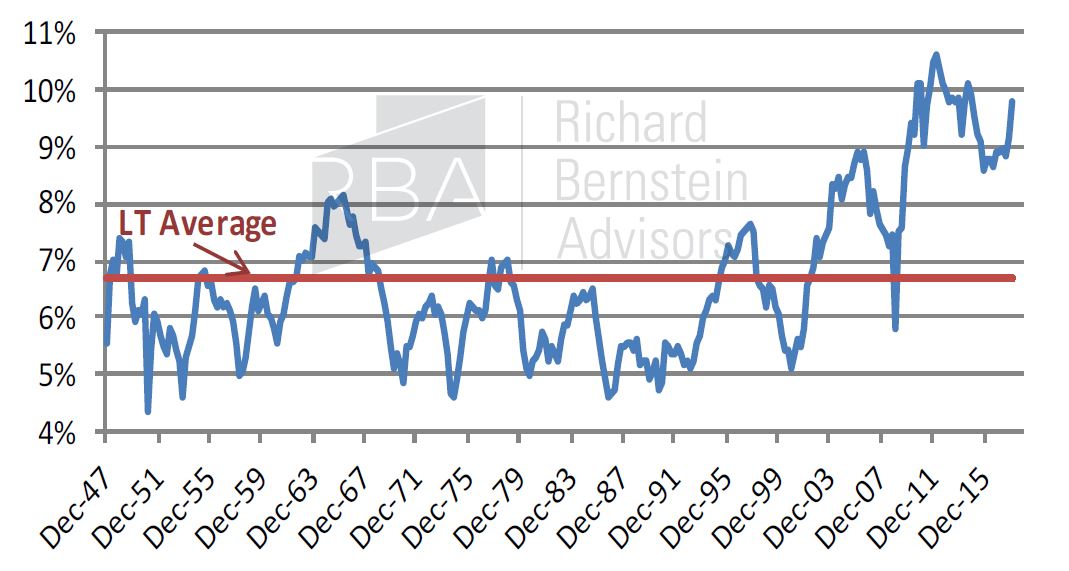
Source: Richard Bernstein Advisors LLC, BEA, Bloomberg Finance L.P.
We prefer fixed liabilities, not fixed income, during inflationary periods.
Data demonstrate that investors continue to focus on disinflationary asset classes and have yet to re-orient portfolios toward assets that outperform during periods of accelerating inflation. Unfortunately, inflation expectations troughed more than two years ago, and asset classes that benefit from accelerating nominal growth (stocks and commodities) have appreciated significantly whereas broad fixed- income has provided negative total return.
Chart 3 compares the returns of stocks, commodities, and various popular fixed-income benchmarks since July 2016. The ongoing popularity of income-oriented investments shows investors have yet to understand the implications of higher potential inflation.
Household and corporate balance sheets constructed with general combinations of fixed asset values and floating liabilities tend to outperform during periods of disinflation/deflation. However, a combination of floating assets and fixed liabilities has proven more beneficial during periods of inflation. FIXED-income is unlikely to be a successful core holding if we are correct and inflation continues to be higher than investors expect. Inflation is the kryptonite of income.
CHART 3
Stocks, Commodities and Fixed Income
(Total Returns Jul. 2016 – Jul. 2018
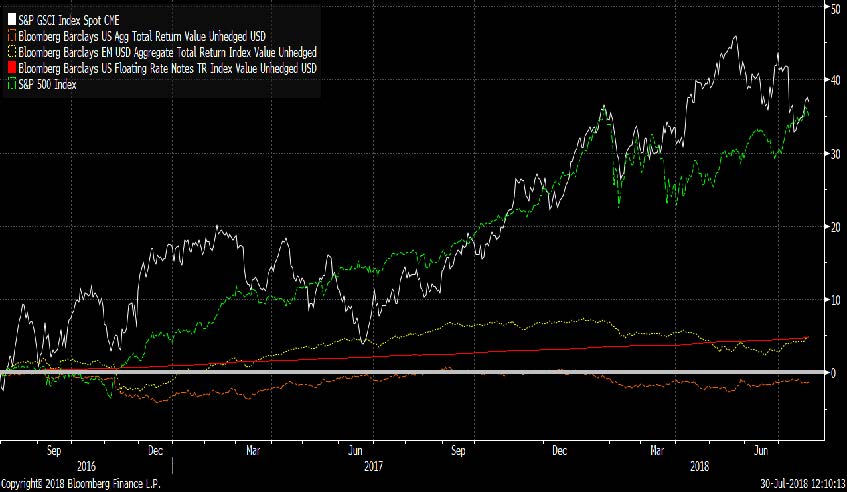
Source: Bloomberg Finance L.P. For Index descriptors, see “Index Descriptions” at end of document
Secular inflation?
We’re not wild about these types of charts, but Chart 4 compares the current cycle’s inflation with the secular period of inflation from the 60s and 70s. We are not showing this chart to suggest that inflation will follow a definitive pattern. Rather, we show it to demonstrate how benignly one of the worst inflationary periods in US history started. That might be worth considering simply because investors remain quite sanguine about inflation given the economic and policy backdrop. (http://www.rbadvisors.com/images/pdfs/ Overheating_Ahead.pdf).
CHART 4
Secular Inflation:
Feb. 1965 thru Mar. 1980 vs. Current
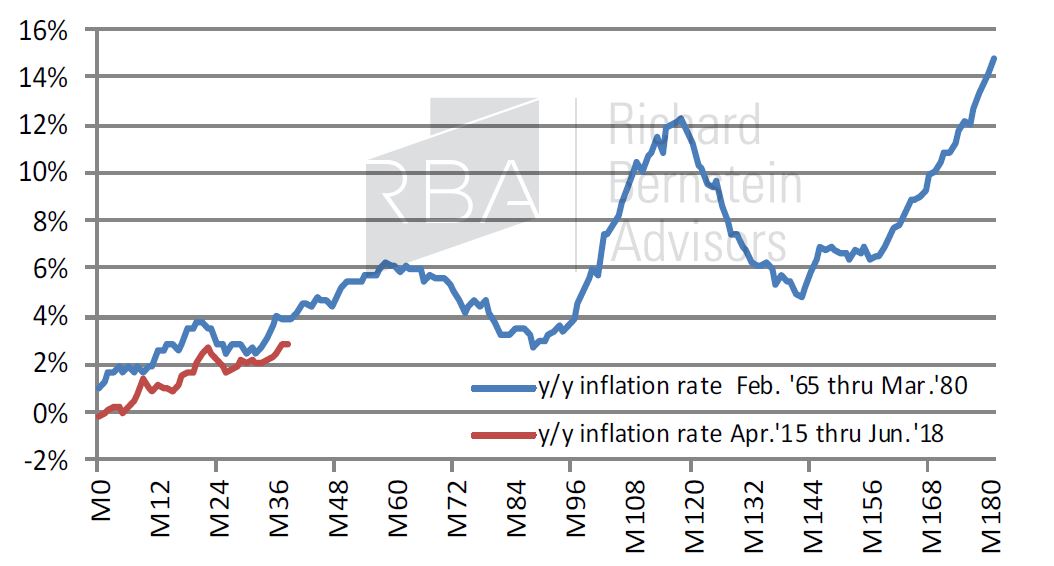
Source: Richard Bernstein Advisors LLC, Bloomberg Finance L.P.
Quick history lesson
RBA believes that there could be considerably more inflation than investors currently expect, but we do not believe there will be secular stagflation. Nonetheless, it is a good history lesson to review what asset classes and sectors outperformed during the stagflation of the late-1970s (see Table 1 on the following page).
TABLE 1
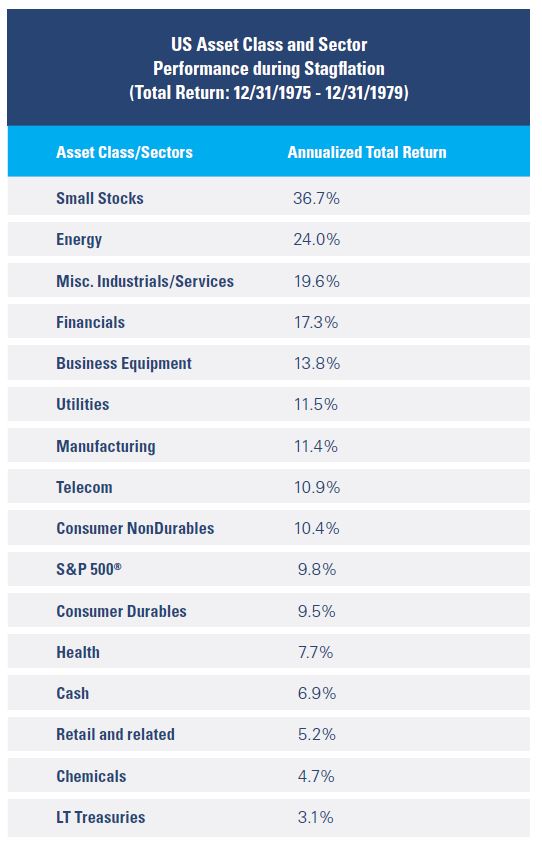
Source: Richard Bernstein Advisors LLC, Kenneth R. French, Morningstar Ibbotson SBBI
To learn more about RBA’s disciplined approach to macro investing, please contact your local RBA representative. www.rbadvisors.com/images/pdfs/Portfolio_Specialist_Map.pdf.
INDEX DESCRIPTIONS:
The following descriptions, while believed to be accurate, are in some cases abbreviated versions of more detailed or comprehensive definitions available from the sponsors or originators of the respective indices. Anyone interested in such further details is free to consult each such sponsor’s or originator’s website.
The past performance of an index is not a guarantee of future results.
Each index reflects an unmanaged universe of securities without any deduction for advisory fees or other expenses that would reduce actual returns, as well as the reinvestment of all income and dividends. An actual investment in the securities included in the index would require an investor to incur transaction costs, which would lower the performance results. Indices are not actively managed and investors cannot invest directly in the indices.
S&P 500®: Standard & Poor’s (S&P) 500® Index: The S&P 500® Index is an unmanaged, capitalization-weighted index designed to measure the performance of the broad US economy through changes in the aggregate market value of 500 stocks representing all major industries.
Commodities: S&P GSCI® Index: The S&P GSCI® seeks to provide investors with a reliable and publicly available benchmark for investment performance in the commodity markets, and is designed to be a “tradable” index. The index is calculated primarily on a world production-weighted basis and is comprised of the principal physical commodities that are the subject of active, liquid futures markets.
Bloomberg Barclays US Aggregate Bond Index: The Bloomberg Barclays US Aggregate Bond Index is a broad-based benchmark that measures the investment grade, US dollar-denominated, fixed-rate taxable bond market. The index includes Treasuries, government- related and corporate securities, MBS (agency fixed-rate and hybrid ARM pass-throughs), ABS and CMBS (agency and non-agency).
Bloomberg Barclays EM USD Aggregate Total Return Index: The Bloomberg Barclays Emerging Markets Hard Currency Aggregate Index is a hard currency Emerging Markets debt benchmark that includes USD-denominated debt from sovereign, quasi-sovereign, and corporate EM issuers.
Bloomberg Barclays US Floating Rate Notes Total Return Index Value Unhedged USD: The Bloomberg Barclays Capital US Floating Rate Notes Total Return Index Value Unhedged USD measures the performance of USD denominated, investment-grade, floating-rate notes across corporate and government-related sectors.
LT Treasury: Long-term Treasuries are represented by the Morningstar Ibbotson Long-Term Government Bonds Index Series which is composed to the greatest extent possible of a one bond portfolio with a term of approximately 20 years and a reasonably current coupon was used each year.
Small Stocks: Small Stocks are represented by the Morningstar Ibbotson Small Company Stocks Index Series which is composed of stocks making up the fifth quintile of the NYSE by market capitalization.
Cash: Cash is represented by the Morningstar Ibbotson US Treasury Bills Index Series which is composed of a one bill portfolio rebalanced monthly to the shortest-term bill having not less than one-month to maturity.
Sectors represented by the Fama French 12 Industry Series as described below.
Consumer Non Durables: Fama French NoDur: Consumer NonDurables—Food, Tobacco, Textiles, Apparel, Leather, Toys
Consumer Durables: Fama French Durbl: Consumer Durables—Cars, TV’s, Furniture, Household Appliances
Manufacturing: Fama French Manuf: Manufacturing—Machinery, Trucks, Planes, Off Furn, Paper, Com Printing
Energy: Fama French Enrgy: Oil, Gas, and Coal Extraction and Products
Chemicals: Fama French Chems: Chemicals and Allied Products
Business Equipment: Fama French BusEq: Business Equipment—Computers, Software, and Electronic Equipment
Telecom: Fama French Telcm: Telephone and Television Transmission
Utilities: Fama French Utils: Utilities
Retail and related: Fama French Shops: Wholesale, Retail, and Some Services (Laundries, Repair Shops)
Health: Fama French Hlth: Healthcare, Medical Equipment, and Drugs
Financials: Fama French Money: Finance
Misc. Industrials/Services: Fama French Other: Other —Mines, Constr, BldMt, Trans, Hotels, Bus Serv, Entertainment
© Copyright 2018 Richard Bernstein Advisors LLC. All rights reserved. PAST PERFORMANCE IS NO GUARANTEE OF FUTURE RESULTS

-
I know Mike is a very solid investor and respect his opinions very much. So if he says pay attention to this or that - I will.
~ Dale G.
-
I've started managing my own investments so view Michael's site as a one-stop shop from which to get information and perspectives.
~ Dave E.
-
Michael offers easy reading, honest, common sense information that anyone can use in a practical manner.
~ der_al.
-
A sane voice in a scrambled investment world.
~ Ed R.
Inside Edge Pro Contributors

Greg Weldon

Josef Schachter

Tyler Bollhorn

Ryan Irvine

Paul Beattie

Martin Straith

Patrick Ceresna

Mark Leibovit

James Thorne

Victor Adair