Timing & trends
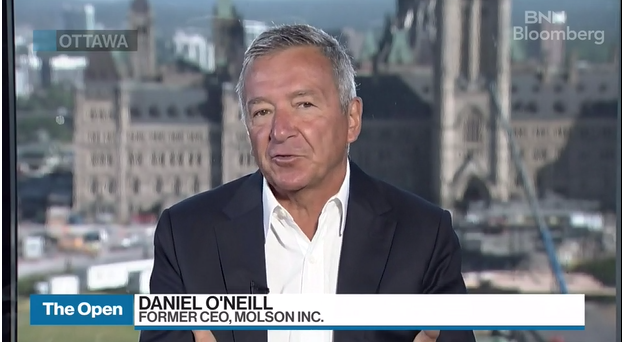
A former president and chief executive officer of Molson Inc. says most big brewers are likely exploring cannabis investments as they seek to stem declining sales amid fierce competition from craft beer makers.
“The youth that manages some of the beer companies will be much more open to do that. The older board members will probably be a little more hesitant,” Daniel O’Neill said in an interview with BNN Bloomberg Wednesday, when asked about the prospect…Click here for complete article

Getting ready for the shotgun starts at the Goldcorp Invitational in support of Special Olympics. Thanks for all your support! ~MC
You may be tired of hearing about Special Olympics but lucky for the 4,600 athletes with intellectual disabilities and their families – I’m not tired of looking for help. The reason is straightforward. Way too often children and adults with intellectual disabilities are overlooked, marginalized and isolated in our communities.
Special Olympics goes a long way to rectifying that by providing an opportunity to participate in a variety of sports, developmental programs and health screenings. Just as importantly, for many of our athletes Special Olympics provides the only connection to the community at large. It’s where they make friends. As one of our athletes said, “before I joined Special Olympics I didn’t know there were other people like me.”
I think it’s safe to say that for the vast majority of our athletes our programs end their isolation, build their self-esteem and have a profound impact on the quality of their lives and their families.
This is where you come in.
Once again I am participating in The Goldcorp Invitational Golf Tournament. (Why do I feel I should apologize in advance to all golfers?)
It’s one of only two public fundraisers in the year and hence is essential in enabling Special O to provide programs for kids as young as two. Obviously not everyone can participate in the golf tournament but we can all help by supporting bidding in our online auction.
It runs for only a week and closes on Thursday, June 28th. You can bid right through the evening when the auction closes. Not really different than if you were there, except you won’t have to hear me whine about my golf or see me in Laderhosen.
Here’s some sample auction items …
100 oz silver bar, 2 tickets to the 2018 Grey Cup in Edmonton, Monster DNA Carbon Headphones, 4 tickets to Bard on the Beach, 3 bottles of Terroir Wine, Chateau Whistler stay and golf – and so many more.
Warning: Ozzie’s got his eye on the Power Wheels 6 volt Corvette – and you will definitely be bidding against me on lots of other items – why? Because Special O athletes and their families deserve our support.
Click here to go to the auction site – and please start bidding.
Many thanks, Mike
Thanks for reading this – and I hope you can find the time to help out. Just bid anytime – day or night right through the auction on June 28th (ending about 7:45 PDT)
Happy bidding.
Ozzie

Everyone wants to buy at the absolute bottom in any market. Yet, most actually buy at the highs, expecting much higher prices, and then sell at the lows, while expecting even lower prices. The gold market is no different.
Back in 2011, when the metals were approaching their highs, most analysts were suggesting that investors keep buying gold as this would be their last opportunity before gold eclipses $2,000, never to look back again. Moreover, these same analysts remained bullish throughout the decline during 2012, 2013, 2014 and most of 2015. Amazingly, as we approached the end of 2015, these same analysts ultimately turned bearish, and were just as confident that gold would certainly break below $1,000 as they were confident that gold would certainly eclipse $2,000 in 2011. It truly is amazing how markets work against the masses.
Yet, in 2011, we saw that impending top coming, as we warned those following us in August of 2011:
“since we are most probably in the final stages of this parabolic fifth wave “blow-off-top,” I would seriously consider anything approaching the $1,915 level to be a potential target for a top at this time.”
Then again, at the end of 2015, we warned:
“As we move into 2016, I believe there is a greater than 80% probability that we finally see a long term bottom formed in the metals and miners and the long term bull market resumes. Those that followed our advice in 2011, and moved out of this market for the correction we expected, are now moving back into this market as we approach the long term bottom. In 2011, before gold even topped, we set our ideal target for this correction in the $700-$1,000 region in gold. We are now reaching our ideal target region, and the pattern we have developed over the last 4 years is just about complete. . . For those interested in my advice, I would highly suggest you start moving back into this market with your long term money . . .”
Moreover, we rolled out our EWT Miners Portfolio in September of 2015 to begin to buy miners we saw bottoming, in the expectation of the impending bottom to the complex.
So, as many were buying at the highs in 2011 at the urging of most analysts of the time, we were selling. And, as many were selling at the lows in 2015 at the urging of most analysts of the time, we were buying.
But, while we view the market as likely having bottomed in its long-term structure in 2015/2016, and having begun a multi-decade bull market, as I have outlined many times before, it does not mean we will be going up in a straight line. In fact, the last year and a half of sideways consolidation clearly supports this perspective.
You see, markets are not linear, so they go through periods of progression and regression. Only those who are gold bugs view gold as only supposed to be moving in one direction, whereas the only reason it could fall, in their mind, would be manipulation. And, I have addressed this view extensively in this article.
https://www.elliottwavetrader.net/p/analysis/Was-The-Metals-Market-Manipulated-To-Drop-From-To-201709194206284.html
So, if we understand that the metals will naturally go through periods of progression and regression, we can maintain a much healthier perspective on the market, which can keep us grounded during both the periods of progression and regression, understanding that each has its own place in the overall structure of gold’s movement.
This brings me to the point of this article. As you probably know, I view the metals as just starting a multi-decade bull market. In fact, if you have read my analysis through the years, you would know that I view the current set up in the metals in the same manner as Ralph Nelson Elliott viewed the Dow when it was around 100 (yes, 100) back in the 1941, as World War II was raging around him, when he provided the following prognostication:
[1941] should mark the final correction of the 13 year pattern of defeatism. This termination will also mark the beginning of a new Supercylce wave (V), comparable in many respects with the long [advance] from 1857 to 1929. Supercycle (V) is not expected to culminate until about 2012.
This was probably one of the best, if not the best, market call of all time. And, as I just noted, I view the set up in the mining complex in the same way Elliott viewed the Dow back in 1941.
But, again, I do not view this impending bull market as moving in one direction all the time. Rather, we will have periods of progression and regression. While I expect the next period of progression to begin quite soon, I feel that you may be able to keep your FOMO (Fear Of Missing Out) in check for a few more years, even though it may be tested later this year in 2018.
I would like to explain this perspective through the use of the daily ABX chart. As we all know, the ABX is arguably the leading mining company in the metals complex. So, I view it as providing a nice perspective regarding the potential progression and regression I see over the coming years in some of the larger miners.
As we can see, we have completed an initial 5 wave structure off the 2015 low in the ABX into the high of the summer of 2016. Since that time, we have pulled back in a very corrective, overlapping 2nd wave. Currently, I believe we are still working on the wave 1 of iii off the recent lows which we caught in our secondary “buy zone.” Based upon the current structure, it would suggest that it will take the rest of 2018 to complete this wave 1 (assuming we hold the bullish support highlighted on the 60-minute chart).
After we complete this wave 1 into the 20-22 region, I would assume we will see another long pullback in wave 2 during 2019 towards the 14-17 region. This would then likely set us up for a major break out in 2020, which will likely be pointing to at least the 40-46 region, with the potential to extend as high as the 57 region, depending upon extensions. And, that would only be for wave 3 of iii off the 2015 lows.
So, as you can see, while there can be some nice upside which we still expect in 2018, the real fireworks seem to be setting up for 2020 in the ABX, which we may be able to extrapolate to the rest of the complex.
This means that, while you will likely feel serious FOMO on the next rally that we expect can take hold into the end of 2018, you will likely have one more pullback/buying opportunity in 2019 before the main event takes hold in 2020.
As we continue to focus on the smaller degree time frames during the week, and as we track the next smaller degree break-out set up, I think it may benefit many of you to take a deep breath and focus on the larger perspectives in the market from time to time. While I believe we are setting up a major move in the mining complex in the coming years, I think the ABX shows us that the major money may not be made until 2020 and beyond.
So, for those of you who have been stressing during this last year and a half consolidation in the market, I have three words for you:
TAKE A CHILL!
See charts illustrating the wave counts on ABX.
Avi Gilburt is a widely followed Elliott Wave technical analyst and founder of ElliottWaveTrader.net (www.elliottwavetrader.net), a live Trading Room featuring his intraday market analysis (including emini S&P 500, metals, oil, USD & VXX), interactive member-analyst forum, and detailed library of Elliott Wave education.
Frank Holmes on how to handle the last stage in an up cycle of a bull market when prices can soar into a wild spike top. Frank also covers the current situation in Oil, Gold and why he finds domestic-focused small to mid-cap stocks so attractive right now – R. Zurrer for Money Talks

The U.S. inflation story made further inroads this month, with year-over-year price growth for consumers and producers alike hitting multiyear highs. U.S. consumer prices expanded at their strongest pace in more than six years, climbing to an annual change of 2.8 percent in May. Prices for final demand goods, meanwhile, grew 3.1 percent, their strongest annual surge since December 2011.
As you might expect, energy was the greatest contributor to higher prices in May, with fuel oil jumping more than 25 percent from the same month a year ago. The current average price for a gallon of regular gas nationwide was just under $3.00, compared to only $2.33 in June 2017, according to the American Automobile Association (AAA).
Inflation is set to get an even bigger jolt now that President Donald Trump has formally approved 25 percent tariffs on as much as $50 billion of Chinese goods. China has already announced retaliatory action. While I agree some targeted tariffs are welcome to address intellectual property theft, tariffs at the wholesale level are essentially regulations that threaten to undermine all the work Trump has done to supercharge the U.S. economy. They act as headwinds to further growth, which in turn makes gold look attractive as a safe haven investment.
Blaming OPEC
Let’s return to energy for a moment. Hot off the success of his historic summit with North Korea leader Kim Jong-un, Trump took a stab at foreign oil producers last week, tweeting:“Oil prices are too high, OPEC is at it again. Not good!”
The president isn’t wrong, but I believe he may be overselling the Organization of Petroleum Exporting Countries’ influence here. In May, the 14-member cartel added an extra 35,000 barrels per day (bpd) in output compared to the previous month, to reach a total of 31.8 million bpd. This is down from the average 32.6 million and 32.4 million bpd OPEC collectively produced in 2016 and 2017.
Venezuela’s output deteriorated once again, falling more than 42 percent in May to 1.4 million bpd, which is less than half of what it produced 20 years ago.
The beleaguered South American country didn’t have the biggest monthly decline among OPEC members, however—that title belonged to Nigeria, which saw its April-to-May production tumble 53.5 percent to 1.7 million bpd. Analysts predict output could fall further to 1.4 million bpd by July—a level not seen since 1988—as the country’s Nembe Creek Trunk Line (NCTL) has had to be closed recently to address product theft along its route.
OPEC will meet later this month and is widely expected to loosen production curbs as global demand strengthens. In the meantime, the U.S. continues to pump even more oil on a monthly basis, and by 2019 it could be producing more than 11 million bpd for the first time ever. This would make it the world’s top oil producer, above Russia.
Want to learn more? Watch this brief video featuring Samuel Pelaez, who outlines the six factors we use to select best-in-class oil and gas exploration and production companies!
Gold Glitters on Inflation Fears and U.S. Budget Imbalance
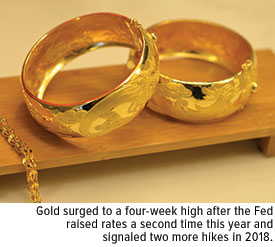 |
The inflation news helped support the price of gold, which traded as high as $1,309 an ounce last Thursday, its best intraday showing in four weeks.
The price jump came a day after the Federal Reserve lifted interest rates another 0.25 percent, the second time it has done so this year. Although rising rates have historically made the precious metal look less competitive, since it doesn’t offer a yield, gold markets could be forecasting slower economic growth as a result of higher borrowing costs, not to mention costlier servicing of corporate and government debt.
On that note, the Treasury Department announced last week that in the first eight months of the current fiscal year—October through May—the U.S. government deficit widened to a whopping $532 billion, or 23 percent more than the same eight-year period a year ago. That’s already more than the total deficits in fiscal years 2014 and 2015. Because of higher spending and lower revenues, it’s estimated that the deficit by the end of the fiscal year will balloon to $833 billion, which would be the greatest amount since 2012.
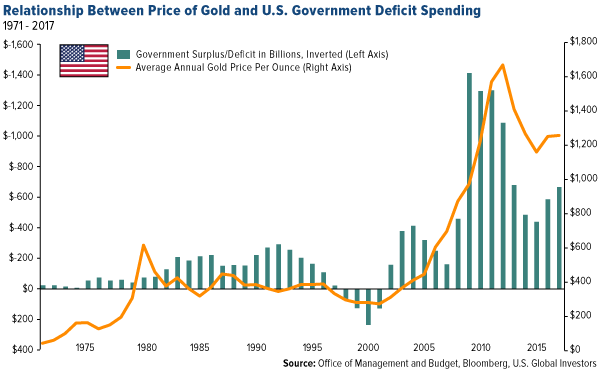
I believe this makes the investment case for gold and gold equities even more appealing as a store of value. In the chart below, notice how the price of gold has responded to government spending. I inverted the bars, representing surplus and deficit, to make the relationship more clear. In the years following the Clinton surplus of the late 90s, the difference between expenditure and revenue surged to new record amounts on the back of military spending in the Middle East and the multibillion-dollar bailouts of financial firms during the subprime mortgage crisis. Consequentially, the price of gold exploded.
Learn more about what’s driving the price of gold right now by clicking here!
How Close Are We to the End of the Business Cycle?
But back to the Fed. Besides lifting rates, the central bank has also signaled that we can expect two more hikes in 2018, suggesting it sees less and less need to accommodate a booming U.S. economy. Since the start of this particular rate hike cycle two and a half years ago, we haven’t yet seen four increases in a single calendar year.
This raises the question of how close we are to the end of the business cycle.
Rising rates, among other indicators, have often preceded the end of economic expansions and equity bull markets. Among other telltale signs: a flattening yield curve, record corporate and household debt, an overheated jobs market and increased mergers and acquisition (M&A) activity. So far this year, the value of global M&As has already reached $2 trillion, a new all-time high. The last two periods when M&As reached similar levels were in 2007 ($1.8 trillion) and in 2000 ($1.5 trillion), according to Reuters. Careful readers will note that those two years came immediately before the financial crisis and tech bubble.
Now, the world’s largest hedge fund, Bridgewater Associates, has reportedly turned bearish on “almost all financial assets,” according to one of its most recent notes to investors.
In the firm’s Daily Observations, co-CIO Greg Jensen writes that “2019 is setting up to be a dangerous year, as the fiscal stimulus rolls off while the impact of the Fed’s tightening will be peaking.”
Don’t Miss the Opportunities
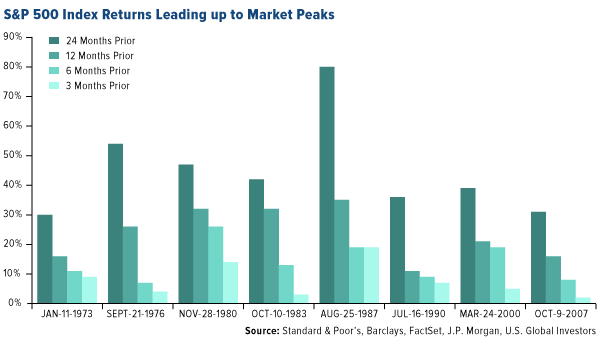
Be that as it may, calling the end of the cycle would be a fool’s errand and could result in missed opportunities, as J.P. Morgan’s Samantha Azzarello points out in a recent note to investors. Late-cycle returns can still be quite substantial, she says. Take a look at the chart below, which highlights returns 24 months, 12 months, six months and three months leading up to the past eight market peaks. Obviously returns were higher in the longer-term periods, but even the three-month periods delivered some attractive returns—returns that would be left on the table if skittish investors exited now. According to Azzarello, it’s important to “rebalance, stick to a plan and remember: get invested and stay invested.”
As further proof that many investors still see plenty of fuel in the tank, the June survey of fund managers conducted by Bank of America Merrill Lynch (BAML) found that equity investors are overweight U.S. stocks for the first time in 15 months. Commodity allocations are at their highest in eight years. And two-thirds of managers say the U.S. is the best region in the world right now for corporate profits, which is at a 17-year high.
That’s not to say there aren’t risks, however. Forty-two percent of survey participants said they believed corporations were overleveraged. That’s well above the peak of 32 percent from soon before the start of the financial crisis. Fund managers cited “trade war” as the biggest “tail risk” for markets at present.
This is largely why we find domestic-focused small to mid-cap stocks so attractive right now. These firms are well positioned to take advantage of Trump’s high-growth “America first” policies, yet because they don’t have as much exposure to foreign markets, they bypass many of the trade war pitfalls large multinationals must face. Since Election Day 2016, the small-cap Russell 2000 Index has outperformed the large-cap S&P 500 Index by more than 8.5 percent.
Get the scoop on small to mid-cap stocks by clicking here!
Rethinking Market Cap-Weighting
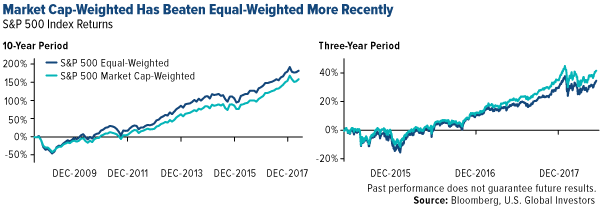
On a final note, I want to draw attention to a change we’ve observed in S&P 500 returns—specifically, the difference in performance between an equal-weighted basket of stocks and one that’s market cap-weighted. For the longer-term period, equal-weighting outperformed. But more recently, market cap-weighting has pulled ahead. This is the case for the one-year, three-year and five-year periods.
So why is this? Simply put, the phenomenally large FAANG stocks (Facebook, Apple, Amazon, Netflix and Google) have made the S&P 500 top heavy. Today, these five stocks represent a highly concentrated 12 percent of the S&P 500, nearly double from their share just five years ago. Apple alone represents 4 percent of the large-cap index.
Ten years ago, the FAANG stocks—excluding Facebook, which wasn’t public yet—had a combined market cap of $390 billion, according to FactSet data. In 2018, they’re valued at more than eight and half times that, or right around $3.32 trillion—a mind-boggling sum.
Market cap-weighted also means more money is disproportionately being reallocated to top winners such as Apple and Amazon, and so it becomes a self-fulling prophecy. This leaves you with too much exposure to companies that would be hardest hit in the event of a market downturn, and too little exposure to names and sectors that might rotate to the top in the next cycle.
Learn more about the domestic market by clicking here!
All opinions expressed and data provided are subject to change without notice. Some of these opinions may not be appropriate to every investor. By clicking the link(s) above, you will be directed to a third-party website(s). U.S. Global Investors does not endorse all information supplied by this/these website(s) and is not responsible for its/their content.
The S&P 500 Index is a market capitalization weighted index of the 500 largest U.S. publicly traded companies by market value. The Russell 2000 Index is a small-cap stock market index of the bottom 2,000 stocks in the Russell 3000 Index.
Holdings may change daily. Holdings are reported as of the most recent quarter-end. None of the securities mentioned in the article were held by any accounts managed by U.S. Global Investors as of 3/31/2018.

