
Timing & trends
 I am a proud Canadian. I love this country but I’m quite concerned about government tax policies that promote the idea that 1% should be able to subsidize the remaining 99%. I’m all for paying my fair share of taxes but when governments can literally seize more than 50% of your earnings, that is not fair. The problem with democracy is the notion “Our solution becomes your problem” is real if enough people support a particular platform.
The 1% notion is absurd. According to StatsCan, there are approximately 270,000 Canadians that would qualify for that category. Imagine the city of Saskatoon (250,000) subsidizing the rest of the country? The math and the premise simply don’t add up. I met with Finance Minister Bill Morneau at a business meeting in Toronto before Christmas and I asked how he can compare Canadians that are high income (professionals / small business owners) to the people like himself who have millions in net assets in and out of the country? His response is the average Canadian earns $50,000 per year so if you make over $200,000 per year, you’re rich. He believes a billionaire or someone who inherited their wealth are the same as your small business owner who have little assets but make a good income.
You may think someone that owns their own business that earns more than $200,000 is rich but consider they don’t qualify for EI, have no gold-plated pensions and they work a lifetime to hopefully sell their business to use as their pension when they retire. If the government takes $100,000 for income tax, the $100,000 left over isn’t much to live on and create a nest egg to retire based on the risk. The biggest difference between a small business owner and an employee is when an employee fails, they lose their job; when a small business owner fails, they lose their house.
As I said before, people have to pay their fair share of tax. That being said, we also believe that every Canadian should take advantage of any tax credit or deduction the government will provide you. We see three strategies:
1. Maximize your registered funds
2. Invest in opportunities that provide capital gains to reduce tax paid. This is one reason the public markets have had a run but it comes with volatility
3. Invest in little known provincial and federal tax credits that provide a way to invest in your local community by investing in innovative new economies
We have three strategies that use these little-known provincial and federal tax incentives / deductions but we will share one of those ideas with you. Alberta and BC have done one thing right; they have created tax incentive plans to help create diversified economies by allowing residents to invest in their own economy.
Please take a look at the 2-minute video on our website, as it will explain how you can receive up to 80% ROI (based on 50% tax bracket) in Year 1 of your investment thanks to this two part tax strategy. If you live in Alberta or BC, if you want to invest in innovative local businesses, visit us at triviewcapital.com to see if you qualify.
Sincerely,
Craig Burrows President, CEO
Triview Capital

 Must read: A report from someone who shorted this market and covered it right on the bottom February 9th. That is one hell of a trade.
Not only that but Peter Grandich has been correct being short the bonds and recently stated that he is as bullish as he has been in 34 years on Gold – Robert Zurrer
A Brief Look At The Markets by Peter Grandich
Stock Market – I had noted in my February 10th observation, that I had covered my short position on the morning of the 9th. I stated, “A significant reason for taking profits in my short positions was the personal technical work that I do, suggested the short-term selling was exhausted. Sure enough, the DJIA rallied 700 points from when I covered. I believe we can see the market rally back hard next week, as the first sell-offs in Parabolic Arc formations are almost always assumed to be buying opportunities.”
As I make this blog post, morning stock index futures indicate another 300 point rise to the already-huge rally since covering my shorts. I believe this qualifies as “rallying back hard”. The question is, was the previous sell-off just a blip or a true warning shot? If a picture is worth a thousand words, this photo should explain my answer:
- Bonds – While the stock market thinks it was just a momentary blip, the bond market has clearly viewed a major sea change and is acting accordingly. The POTUS has “joined the swamp” in insanely out-of-control spending and debt crisis, that just may make the can unable to be kicked down the road anymore. The warning shot will become this, if the 10-year T-Bond gets above (and stays) 3%

Dollar – Any questions?
%20100vw,%20300px">)
- I stated in my February 14th interview with Goldseek.com that, during my 34-year career in and around the financial arena, I never been more confident in a gold rally. I continue to point out how gold has been tracing-out a series of higher lows since early 2017, while the “Battle of The Bulge” resistance line for the bears remains the $1, 375 – $1,400 area. Now with any resemblance of fiscal responsibility being tossed aside by the POTUS, at a time when other bullish factors to own gold just keep increasing, I believe its “when” we get above (and stay there) $1,400, not if.
http://petergrandich.com/blog/
Last week, everyone focused on the stock market sell-off. Reasonably enough, given the pace of the declines. But the analysts failed to pay enough attention to the very important shift. That change may be more important than Trump’s victory in the presidential election. Will the critical switch make gold shine – or dull?
Three Important Legacies of Yellen’s Fed Tenure
A crucial change is behind us. Powell is the new boss. Yellen is out. For better or worse, she doesn’t serve as the Fed Chair any longer. Although economists rated Yellen’s tenure very highly, President Trump didn’t renominate her for the position. Rightly or not? We don’t care. Let journalists debate endlessly – we will analyze the crucial Yellen’s imprints on the Fed, which could affect the gold market in the future.
First, Yellen focused mostly on the labor market, not without some successes. We don’t attribute it solely to her, but the unemployment rate fell from 6.7 to 4.1 percent under her tenure. As a reminder, the Fed has a dual mandate: maximum employment and stable prices. Although many Fed officials used to worry about high inflation, she was different. Yellen didn’t fear the uptick in inflation as long as there was a slack in the labor market. She, thus, believed that ultra low interest rates could and should stay near zero for far longer than previously thought to combat unemployment. Yellen hiked them not earlier than in December 2015. Since then, she gradually raised them to the range of 1.25 percent to 1.5 percent, which is still very low. The gradual tightening was positive for gold, which would have likely struggled more, had monetary policy been more aggressive. If Jerome Powell continues this cautious policy, gold may shine, despite rising interest rates.
Second, Yellen managed to start the unwinding of the Fed’s massive balance sheet, without triggering stock market turmoil. After unconventional actions of Bernanke, she had to get back to normal monetary policy, but not too fast. She definitely succeeded. If anything, the Fed is behind the curve. This is why gold wasn’t strongly hit by the Fed’s tightening. The U.S. central bank raised interest rates a few times, but the financial conditions remained easy.
Third, Yellen mastered communication with the public. She held quarterly news conferences and smoothly telegraphed the Fed’s moves well in advance. Thanks to well-planned expectations guidance, Yellen – contrary to Bernanke who triggered a taper tantrum by his unexpected remarks in 2013 – avoided any major stumbles. The clear communication transformed gold’s reaction function. The yellow metal now reacts more to the changes in the rate hike expectations than to real monetary policy decisions. Sell the rumor, buy the fact – as one can see in the chart below.

Chart 1: Gold prices under Yellen’s Fed tenure
Jerome Powell – Great Continuator or Game Changer?
Jerome Powell is now the new Fed Chair. Analysts expect that he will continue Yellen’s stance. But will he? How you play depends on your opponent. Yellen faced a sluggish recovery. But Powell sees tax cuts, higher economic growth, very low unemployment and perhaps finally rising wages. He will have to deal with the accelerating inflation, so Powell could move faster on normalization. Actually, such a scenario scared some investors last week into deciding to sell their equities. As people weren’t sure what to expect of Powell, good economic data turned out once again to be bad news for the financial markets. Surprisingly strong payrolls make traders to worry that the Fed will tighten its stance more. Hence, unless Powell convinces the markets that he will continue Yellen’s gradual approach, gold may react paradoxically for a safe-haven: decline on bad news and rise on good news.
But will he intervene to calm the financial markets? We don’t bet on that. Greenspan cut interest rates after the stock market declined 35 percent in the three months after he became the Fed Chair, but the current downturn is much smaller. Actually, we have seen some rebound since Friday. Another paradox: the correction in stock prices may help Powell in doing his job, because lower equity prices could relieve concerns about the formation of dangerous asset bubbles.
Conclusions
The conclusion is clear: although the latest declines were a tough welcome for Powell, they may actually be helpful for him. He is expected to continue Yellen’s policy. It is generally true, but economic conditions changed as well as the composition of the FOMC in 2018. It is now more hawkish than last year.
Given these developments, the shift from Yellen to Powell may importantly strengthen the hawks among the Fed. Hence, unless the correction evolves into turmoil, we still expect three (or even four) hikes this year. Indeed, according to CME data, the Fed remains on track to lift the federal funds rate in March. The market odds of a hike are above 75 percent. Higher interest rates should theoretically be negative for gold. But the usual link seems to be broken now. The part of the answer is the U.S. dollar. Another issue is that we are in the late stages of the economic cycle – as the cycle matures, volatility increases and investors start to buy more gold as a hedge.
By Arkadiusz Sieron
US Stock Market
We will update global markets as well as the macro situation in NFTRH 486, but for this article I’d like to focus on the US stock market.
Let’s cut to the chase; the markets have finally fallen in line for those of us who manage markets, as opposed to dollar cost average into them through a money manager and then go about life, blissfully unaware. Much like during the 2015-2016 period, when the media were all but demanding investors go one way when the right way was the opposite (for example, we got bullish during the Brexit mini hysteria because sentiment, macro indicators and charts told us to) during the market top (that wasn’t).
But today the bliss is wearing off as the average person did not need to wait for his monthly statement to see that something went wrong with the up-melting market that was printing him money every month. Here is a look at the Google Trend for the search term “stock market crash”. Per Google’s computation method, the reading cannot go higher than 100.
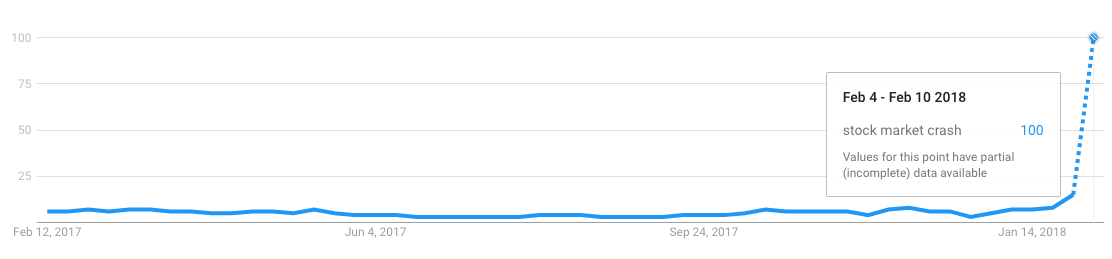
It’s a good bet that much of the new money, the ‘all-in and ready to make coin’ retail money summoned by the now-fiscally unrestrained economy and wooed by Donald Trump’s relentless stock cheer leading on Twitter, was pounding away at keyboards searching for what went wrong as well. Our handy graphic (courtesy of Sentimentrader) once again makes the point of who exactly got sucked in and likely, flushed.

But then came the relief on Friday, just as we had suspected earlier in the day when everything was red as a far as the eye could see. The linked post included a chart of the S&P 500, down another 1.4%, filling a gap and kissing the SMA 200. From the post…
Okay, a little play-by-play sports fans. I covered another short (on SOXL) and still have the bullish feelings (short-term only at this point) welling up within me. Can SPX go for the lower gap all in one big gulp? Well let me ask you this; how vigorously, how constantly, how emphatically did the president of the United States pump this market’s tires? I really do think this melt-down is emblematic of that asininery and it is doing a fine job of neutering it. Sure, it can go for that gap.
But SPX is at the SMA 200, sentiment is changing in a big way and I think the point has been made to any and all who had lapped up the jingoistic bullshit coming out of the White House.
I hesitate to write in a seedy newsletter writer style of ‘my subscribers were warned in advance and were kept out of harm’s way and ready to take advantage’ because I give NFTRH subcribers much more credit than that. They are not “my” subscribers. I am their market manager trying his best to help keep us all on the right side of the market’s probabilities.
Here is the current chart from that update. I did not wait for the rebound. I covered shorts when the market was red and then started adding long positions as SPX ground the SMA 200 and looked to hold it. All of this per the NFTRH Trade Log, which subscribers have access to but are encouraged to use for reference only, as I am no better than the next guy when it comes to daily trading. What I am good at is gauging charts and macro signals and then trying to allocate in accordance with them.

This weekly chart was created a few weeks ago for NFTRH’s Market Sentiment segment in order to make a visual point about the market’s post-Brexit history. In the post linked above a gap around 2460 is noted. The market held a small shelf of support at the SMA 200, but we are not out of the woods for the correction, folks. The up-melting trend has been killed and months of building hysteria are being addressed. The market’s long-term trends are fully intact however, so we can keep an open mind as to whether the long-term answer is bullish or bearish.

In a nod to the bear case, the above chart looks like another from recent history. That was silver in the spring of 2011, melting upward amid much hysteria about long-term interest rates and inflation (sound familiar?). So let’s at least acknowledge that when tuning out everything we think we know, a harsh break in a market after an extended, story-filled melt up has precedence as a bull ender. After covering all short positions I am long the market with a high level of dividend-paying cash equivalents (SHV, see Stupid Cash Holders) and some Treasury bonds. But the long orientation is likely a very temporary condition as I plan to manage the hell out of this event going forward. In short, the market is fun again because hard work done is being rewarded. Dart throwers are no longer rewarded.

The historical silver chart is a handy segue into a few words on the precious metals, which we have maintained are “in the mirror” to or left on the outside looking in at the party that has been going on in US and global stocks and the various macro risk ‘on’ trades.
Precious Metals
We have been very actively managing this sector lately, from the last ‘buy’ in mid-December for seasonal, sentiment and CoT reasons (the latest CoT data moved positive, with silver especially near a turning point) and as a part of an ‘inflation trade’. But that is not the real reason to be bullish the sector (see beware the inflationists). The real reason to be bullish the gold sector is when things fall apart and gold’s ratios to positive cyclical items like stocks, oil, industrial metals, etc. rise.
So you see, the fate of the risk ‘on’ stock market and relatively risk ‘on’ commodities and ‘inflation trade’, now being promoted once again using Bill Gross (along with fellow superstar Ray Dalio) feeds directly into the fate of the counter-cyclical gold sector. Ladies and Gentlemen, below once again, is our visual presentation in planetary form (because I like looking at it).
The important issues will be for gold to out perform stocks (was last week the first crack?), the economy to show signs of exhaustion (we are tracking a very sensitive indicator in NFTRH, which had a side benefit of alerting us to the coming trouble in the stock market even though I was using it as an economic indicator). By extension, confidence in the fiscally stimulated economy would eventually begin to erode, the flattening yield curve (noted as yield spreads on the graphic) would grind out a low and steepen, gold and silver (monetary & relatively monetary, respectively) would trounce cyclical commodities and so on…

While the detailed work is reserved for NFTRH Premium (we are managing a potential near-term low that will have flushed the inflationists), let’s take a look at a few constructive big pictures, which would become more than constructive if the stock market enters a bear market as was the case in 2001.
While the current stock market situation is much different from 2001 (a manic melt-up and break vs. a more traditional top) the theory is the same. The gold sector made its final bottom as the S&P 500 made its first ill-fated bounce of what would unfold into a bear market. Does history repeat exactly? No. Does it often rhyme? Oh yes.

Finally, big picture monthly charts of gold, silver and HUI that have kept us constructive on the sector pending all the post-2016 whipsaws.
Gold is knocking at the door of a new bull market, but we have noted that this will not come easily and it surely hasn’t. What the chart has going for it is rising volume interest, gently positive RSI, a positive AROON trend and a completely flattened out downtrend and fledgling upturn by ADX and its +DI above -DI. Another positive is the simple fact that the more times resistance is attacked by price, the weaker it tends to become. Gold is taking its 4th crack at it.

Silver has been in lock down vs. gold. But it can still be viewed as a leader in waiting for the precious metals, especially given its relatively positive CoT structure. RSI is just negative below 50, AROON is positive and ADX shows an exhausted downtrend, although -DI is still above +DI.
The real story of this chart, which shows the rest of the sorry post-bubble history from the 2011 chart above, is an extended bear market, sharp upturn in 2016 and what seems like a forever consolidation of that upturn. I can assure you it will not be forever. If this is a prelude to a bullish resolution the job of this consolidation will have been to grind away at the spirits of every last player who got bullish in 2016, thinking it was a new bull market (which it may well have been).

HUI is similar. The upward burst in 2016 has been ground away at for 1.5 years now. The former downtrend is completely eliminated but there is no sign yet of a new upturn.

Which brings us back around to the beginning of the article. Is the macro shifting per our 3 Amigosindicators (SPX vs. gold, long-term interest rates to their decades-old limiters and the end of the yield curve’s flattening)? The fate of the S&P 500, now bouncing as expected, will directly inform the view of the counter-cyclical gold sector.
Whether the resolution to the broad market is to be bullish or bearish, it is going to take active management and updating of macro indicators all along the way to said resolution. NFTRH stands ready and engaged, as I have not seen the likes of this phase since 2015, which was a time to separate the wheat from the chaff where market strategy is concerned.

Let’s not go into great detail about sentiment and internals indicators trying to ascertain something already fully in play. The stock market has finally cracked, making an A-B-C correction in micro time per a 30 minute chart. Sentiment is in play from the negative side, volatility is now intense and while we will gauge the macro regularly going forward, we also are in the realm of straight TA. So #486 is going to be a breeze for us this weekend as we get down mainly to more TA and less theory across various markets.

Table of Contents

Wrap Up (a basic summary based on conclusions from work done in this week’s report)
-
US Stock Market: So we had anticipated a bottom and a bounce. Last week the US market bottomed, bounced, dropped, bottomed and bounced again. SPX reversed on Friday from a logical point and this could get over bearish participants thinking “rut roh, why did I puke?” and starting to chase. I think this is the type of market where you buy a logical low and hope that a rally ensues or else don’t blindly chase the reactions.
-
There could well be another shoe to drop after a bounce plays out. Let’s watch sentiment and macro indicators to gauge the proceedings.
-
Market Internals: The few divergences we had, like those noted in the Semi sector manifested in a hum dinger of a correction. Now the market is finally in motion with herds running every which way. You can’t ask for better if you are like me. A market in a robo trend or melting up day after day is not fun. A market that is running on emotion and becoming volatile in both directions… is. When things smooth out we’ll again gauge internals.
-
3 Amigos: Stocks vs. Gold got whacked from a point lower than the ultimate target allowed for by the monthly chart. Let’s keep open minds both ways here and go week to week. 10yr yields are essentially at target and 30yr dwells below target, all with Gross & Dalio plastered across the media as poster boyz of the new bond bear (that isn’t quite yet). The yield curve unsurprisingly steepened with the market disturbance but remains in a long-term flattening trend.
-
Amigos bottom line: no confirmations of trend changes yet.
-
Global Stock Markets: In some cases egregiously overbought and correcting, like
the US. Also subject to bounce potentials like the US.
-
Commodities: USD-centric ‘Inflation trade’ still alive because USD is still bearish on its larger trends, despite bounce.
-
Precious Metals: Sector’s best ‘epic buy’ (ala Q4 2008) would be if the ‘inflation trade’ ends in global liquidation and the sector gets wiped out. But if stock markets are taking the 1st of more hits to come, this would be very supportive and if gold at least holds its own vs. commodities and silver leads gold, so much the better. Constructive here even if an inflationary phase grinds along.
-
Currencies: USD bearish but bouncing.
-
Sentiment: Sentiment got cleaned very well last week, to the point where a solid bounce across asset markets is not only possible, but likely. Friday’s reversal may have been the start. Let’s see how the pig comes out of the gate early this week.
US Stock Market
SPX and its fellows made an A-B-C correction (i.e. short-term down-up-down whipsaw) in micro time last week. The SMA 200, per the SPX chart is generally the line in the sand that sparked Friday’s bullish reversal. SPX has 2 significant gaps, one as noted above in the mid-2800s and the other as noted in an update in the mid-2400s.
Double Click For Larger Image


-
I know Mike is a very solid investor and respect his opinions very much. So if he says pay attention to this or that - I will.
~ Dale G.
-
I've started managing my own investments so view Michael's site as a one-stop shop from which to get information and perspectives.
~ Dave E.
-
Michael offers easy reading, honest, common sense information that anyone can use in a practical manner.
~ der_al.
-
A sane voice in a scrambled investment world.
~ Ed R.
Inside Edge Pro Contributors

Greg Weldon

Josef Schachter

Tyler Bollhorn

Ryan Irvine

Paul Beattie

Martin Straith

Patrick Ceresna

Mark Leibovit

James Thorne

Victor Adair