
Timing & trends

This past weekend, I discussed the surge in market exuberance in terms of both individual and professional investors. Of course, such surges in exuberance is generally indicative of the “capitulation phase” as the last of the “holdouts” finally jump back into a market which “can seemingly never go down.”
But therein lies the danger. It worth noting that despite the “hope” of more fiscal support for the markets, longer-term conditions currently persist which have led to rather sharp market reversions in the past.
“There are many factors from economic, monetary, geopolitical, and financial which have ignited each bubble, and bust, period throughout history. However, each bubble had in common the same extreme levels of confidence, exuberance, valuation and price extension that we see today. And they all ended the same, as well.”
Regardless, the market is currently ignoring such realities as the belief “this time is different” has become overwhelming pervasive. Importantly, such levels of exuberance have NEVER been resolved by a market that moved sideways.

Precious metals expert Michael Ballanger likes what he sees for gold in 2018’s first week of trading.

While the moniker for this missive is “Gold and Gold Miners,” I just sit back in absolute AWE as the global equity investors (otherwise known as “Stock jockeys”) have decided that “cash is TRASH!” and despite a massive “miss” in the employment numbers this morning, within seconds of the release, the spin doctors manning the equity trading desks deemed that number “bullish” because it is less inflationary and may cause the Fed to “pause.” So dollar-yen rallies, the USD index has a minor pop, gold sells off, and stocks come out of the gate up another 0.25% with all of the bubblicious bravado of a high school quarterback getting his first win.
The chart of the S&P shown below is a classic illustration of what occurs when global central banks open up the monetary spigots and flood the world financial markets with unchallenged credit and liability-free liquidity. It is this “inflationary spiral” that enhances “the replacement value of equities” and sends literally everything skyward. Since the two biggest collateral risks to the banks are real estate and stock buyback loans, it is no surprise that this tsunami of phony, counterfeit currency of all colors indiscriminate of flag has not only mitigated those risks but also floated the underlying collateral into the ozone layer. Don’t forget that even Ben Bernanke admitted that no one could predict the outcome of all of that “quantitative easing” that saved JPM and Goldman and Citi and BofA from disappearing from the face of the earth and now we are seeing what currency debasement exercises are truly all about. Record highs EVERYWHERE (except gold and silver) as monetary inflation sows its price inflation seeds.
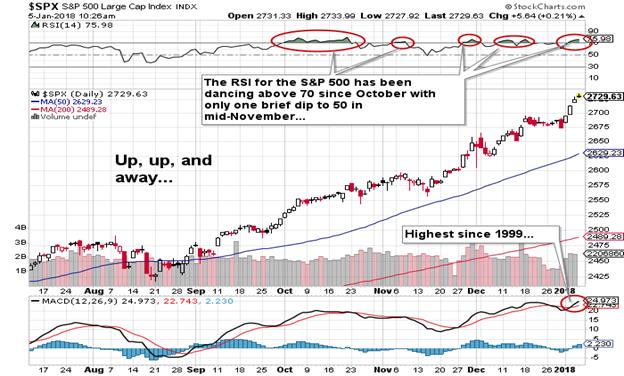
My buddy David Chapman was the first to predict this final-stage blow-off top or “melt-up” and is quick to remind me that RSI has stayed in the 70s for the S&P and NASDAQ for many, many weeks before succumbing to profit-taking and that if this truly is a new bull move for gold, the HUI [Amex Gold BUGS Index] (and the Gold and Gold Miner ETFs) can too stay elevated above 70 for quite awhile. I can’t recall the period of time when the RSI resided in or neared 70 for more than a few weeks before correcting but the S&P chart illustrates overbought conditions starting in the typically weak October period with RSI breaking above 70 six times by year-end. That, my friends, was too much liquidity chasing too few stocks—and it isn’t the “too few stocks” that should be deemed the scapegoat.
David Tepper came out this morning with the “stocks are as cheap today as they were in 2016” mantra, citing “extraordinarily low interest rates” and “low inflation” as the reasons for this call but as I hurled a half-eaten Western sandwich at the monitor sending Fido and the missus running for the sanctuary of locked powder rooms and subterranean foxholes, the sounds of exploding coffee mugs and shattering ceramic plates reverberating throughout the halls, I was immediately screaming back at him that he should “come down off that cloud of reefer smoke” and recognize that low yields are a function of one thing and one thing alone—government intervention. The “low inflation” meme is a function of manufactured CPI and PPI numbers not even remotely close to reality. However, stocks are now gunning for Dow 26,000 so my emotive protests and vitriolic outbursts are useless and a waste of time and breath. I am NOT playing in the Wall Street cesspool and there is NOTHING that will deter me.
Another headline that caught me off guard tonight was the ZeroHedge article stating that incoming Fed Chairman Jerome Powell has admitted that “The Fed Has A Short Volatility Position” and it can be accessed here. This incredible admission basically throws down the gauntlet and says “Do we manipulate markets? Of COURSE we do or stocks would CRASH!” Read the part in the article where he says that Fed behavior is “encouraging risk-taking” and then let’s have a debate over why market forecasters (including technical analysts) stand zero chance in calling a top to this current fiasco. Not one CNBC commentator could ever offer anything of value other than predicting when the Fed was going to cease and desist in tampering with what should be free market economics. Earnings, cash flow, price-to-book, price-to-sales, dividends—wrap them all up and throw them into the waste bin of stock market analysis whose traditional tools have gone the way of the buggy whip, the corset, and the trusted Hollywood executive.
I thought to myself that the very second that Powell allowed that statement to be entered into the FOMC minutes, it was the final thumb-nosing of the die-hard free market advocates like me. The blatancy of that admission is due now to be followed up with a comment like “Why on earth would anyone not want to own stocks?” And Donald Trumps tweeting that “Dow 30,000 is next” really sounds like the passions of a true swamp-drainer, doesn’t it? Lastly, to read all of this and maintain that gold and silver are NOT interfered with by the 33 Liberty Street robots is to maintain that the world is flat and Trump still has all his hair.
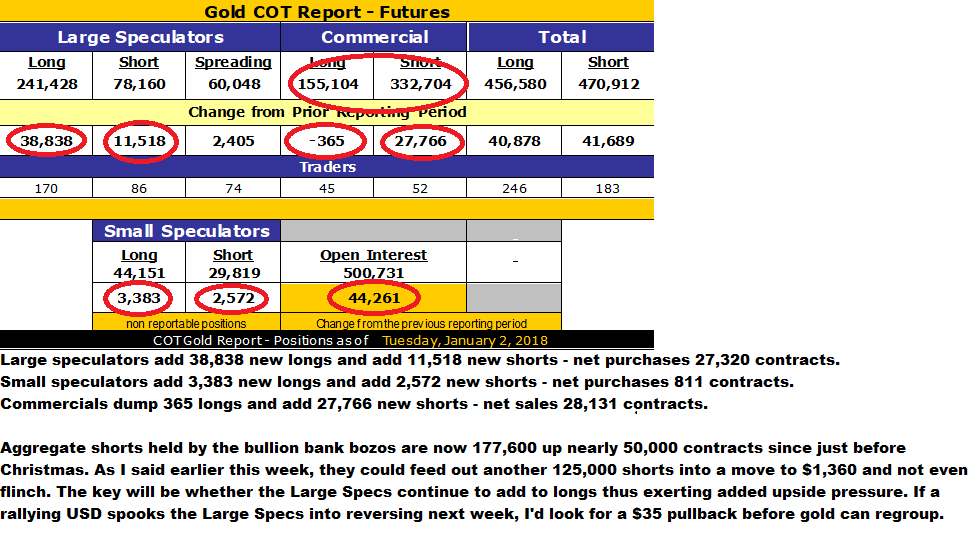
Tonight’s COT was pretty much as expected for gold with the Commercials providing all of the supply sought after by the big speculator accounts such as technical funds and of course the hedgies. I still look for a strong January but as I said in the above COT notes, this could turn south in a heartbeat so call options have been trimmed to reflect zero costs and leverage has now been removed. I have a $17.50 stop on the remaining JNUG (Direxion Daily Junior Gold Miners Bull 3X ETF) and a $32 stop on NUGT (Direxion Daily Gold Miners Bull 3X ETF). I would not short gold or silver in here despite the return of Commercial trader hostilities because there appears to be some serious money piling into the long side. Even the COT report showed that gross longs by the Large Specs was 11,072 contracts greater then gross sales by the bullion banks and that is pretty impressive.
With everything in full “melt-up mode,” one might have expected that the gold and silver stocks would be able to join in the fun but as we have discussed countless times, with the cryptos on fire and small caps finally participating, the competition remains fierce keeping the HUI under 200 and mildly lower on the day.
All in all, to close out the first trading week of 2018 north of $1,320 bodes well for our sector. If we can apply the “January Barometer” to gold, a close above $1,320 January 15 and a subsequent higher close at month-end would be a superb omen for the balance of the year. In fact, it has been such an abnormally decent week that I looked down to see Fido resting in the hallway and my partner out of the powder room and puttering in the kitchen. It would appear that she was rooting around in the drawers looking for that old venerable rolling pin she affectionately named “The Attitude Changer.”
I will now be forced to pray for better markets or retrieve my old leather hockey helmet from the attic. Such is the lot of the precious metals bull.
Originally trained during the inflationary 1970s, Michael Ballanger is a graduate of Saint Louis University where he earned a Bachelor of Science in finance and a Bachelor of Art in marketing before completing post-graduate work at the Wharton School of Finance. With more than 30 years of experience as a junior mining and exploration specialist, as well as a solid background in corporate finance, Ballanger’s adherence to the concept of “Hard Assets” allows him to focus the practice on selecting opportunities in the global resource sector with emphasis on the precious metals exploration and development sector. Ballanger takes great pleasure in visiting mineral properties around the globe in the never-ending hunt for early-stage opportunities.
Disclosure:
1) Statements and opinions expressed are the opinions of Michael Ballanger and not of Streetwise Reports or its officers. Michael Ballanger is wholly responsible for the validity of the statements. Streetwise Reports was not involved in any aspect of the article preparation. Michael Ballanger was not paid by Streetwise Reports LLC for this article. Streetwise Reports was not paid by the author to publish or syndicate this article.
2) This article does not constitute investment advice. Each reader is encouraged to consult with his or her individual financial professional and any action a reader takes as a result of information presented here is his or her own responsibility. By opening this page, each reader accepts and agrees to Streetwise Reports’ terms of use and full legal disclaimer. This article is not a solicitation for investment. Streetwise Reports does not render general or specific investment advice and the information on Streetwise Reports should not be considered a recommendation to buy or sell any security. Streetwise Reports does not endorse or recommend the business, products, services or securities of any company mentioned on Streetwise Reports.
3) From time to time, Streetwise Reports LLC and its directors, officers, employees or members of their families, as well as persons interviewed for articles and interviews on the site, may have a long or short position in securities mentioned. Directors, officers, employees or members of their immediate families are prohibited from making purchases and/or sales of those securities in the open market or otherwise from the time of the interview or the decision to write an article, until one week after the publication of the interview or article.
Charts and images courtesy of Michael Ballanger.

Enjoy the good times while you can because when the economy BLOWS UP this next time, there is no plan B. Sure, we could see massive monetary printing by Central Banks to continue the madness a bit longer after the market crashes, but this won’t be a long-term solution. Rather, the U.S. and global economies will contract to a level we have never experienced before. We are most certainly in unchartered territory.
 Before I get into my analysis and the reasons we are heading towards the Seneca Cliff, I wanted to share the following information. I haven’t posted much material over the past week because I decided to spend a bit of quality time with family. Furthermore, a good friend of mine past away which put me in a state of reflection. This close friend was also very knowledgeable about our current economic predicament and was a big believer in owning gold and silver. So, it was a quite a shame to lose someone close by who I could chat with about these issues.
While some of my family members know about my work, I don’t really discuss it with them. If they ever have a question, I will try to answer it, but I found out years ago that it was a waste of time to try and impose my knowledge upon them. Which is the very reason I started my SRSrocco Report website… LOL. So, now I have a venue to get my analysis out to the public. I don’t care about reaching everyone, but rather to provide important information to those who are OPEN to it.
As I have stated before, I receive communications from individuals all across the world and from all different occupations. The common theme I receive from these individuals, who stumbled upon my website, is that they say, “IT’S MUCH WORSE THAN YOU REALIZE.” Unfortunately, I cannot share publically the information that they have provided, but I can tell you that the GRAND FACADE will come crashing down to the shock and surprise by the masses.
However, I can tell you one individual has contacted me with data suggesting that one of the largest shale oil companies in the United States has been fudging its numbers for the past several years. I have had nearly a half a dozen phone conversations with this individual and the evidence points to serious fraudulent activity. And let me tell you this individual is no conspiracy nut, he was a Senior-Level person in the company. When this information becomes public, it could be the next ENRON. If so, that will destroy the investor trust in the U.S. Shale Energy Industry. Virtually overnight, we could see a collapse of capital investment in an industry that hasn’t really made any profits since it started producing shale oil and gas nearly a decade ago.
Unfortunately, I continue to read articles and receive emails from individuals who believe that the vast U.S. shale energy resources will make the U.S. energy independent. I am completely surprised by the lack of wisdom of supposedly highly intelligent individuals who should know better. Furthermore, it seems to be that the debate is not about discussing facts and reason, but rather between the TRUTH & LIES.
Thus, there is a big disconnect between individuals with CHARACTER, INTEGRITY, and TRUTH versus those who don’t care about increasing the debt to produce shale energy. According to these individuals, they don’t care if someone gets stuck with the debt if it allowed them to make money or for Americans to enjoy low-priced gasoline. This is exactly what is wrong with the world today. The world has become so big; we don’t care about screwing someone else in order to make a buck. If it isn’t our money, then the hell with them.
So, to debate someone with that sort of mentality, it’s a total waste of time. You cannot debate an individual based on facts and truth if they come from a position of fraudulent activity and lies. Just like oil and water, they don’t mix. I can tell you; I see this all over the internet… even in the alternative media community. Of course, these individuals will reply that they are correct. However, their position is flawed because their ideology is also flawed.
Here is a piece of advice. Don’t waste time debating individuals who don’t base their ideas on truth and sound data. The only reason I do it via my articles is to prove why their analysis is flawed because people are still making up their minds. I don’t do it to change the mind of the analysts, (example, CPM Group’s Jeff Christian), but to provide information that helps individuals understand the reality of dire energy predicament we are facing because it all comes down to the energy.
That being said, I haven’t received a reply from Jeff Christian in regards to my article, CPM Group’s Jeff Christian Responds “NEGATIVELY” To The SRSrocco Report On Silver Investment Demand. After my first article, Jeff left some choice words in a comment, which motivated me to reply. Of course, Jeff didn’t reply to the second article because I gather he realizes that the FACTS & DATA prove their gold and silver price analysis has been flawed for 40 years. So, it’s better for Jeff Christian and the CPM Group to keep quiet as they want to continue selling their Gold and Silver Yearbooks to the industry.
The Fundamentals Point To The GREAT DELEVERAGING Of The Economy… Dead Ahead
While the mainstream media and financial networks suggest that THIS TIME IS DIFFERENT for the markets…. it isn’t. The fundamentals of the markets are so out-of-whack, I am amazed people can’t see it. This is also true for the Bitcoin and cryptocurrency market. While a small group of crypto-investors have made a killing, it’s mostly digital wealth. While I don’t have a problem with someone making profits investing in cryptocurrencies, I do have a problem when they believe this technology is the wave of the future. For some strange reason, they must believe in the ENERGY TOOTH FAIRY.
While some of these cryptocurrency analysts (or supposed analysts) believe that we are heading into a new high-tech world where we no longer have to work, just live phat on our Billions in Bitcoin profits, the Falling EROI – Energy Returned On Investment never sleeps. That’s correct; it continues to erode our modern way of living each passing day. Unfortunately, adding more technology does not solve our energy predicament, it just makes it worse.
Also, individuals who believe in FREE ENERGY technology or supposed advanced ALIEN ENERGY technology hand-me-downs, to save the day… you are grasping at straws. Now, I am not trying to change anyone’s mind who believes in free energy or alien technology, but all I ask is that you stay alive for another 5-10 years to see the mistake of your ways. Yes, that may sound a bit confident or arrogant, but empires have come and gone in the past. The current one is no different.
Let’s first look at the NYSE margin debt. According to the chart by the Advisor Perspectives, the New York Stock Exchange margin debt is at new record high:
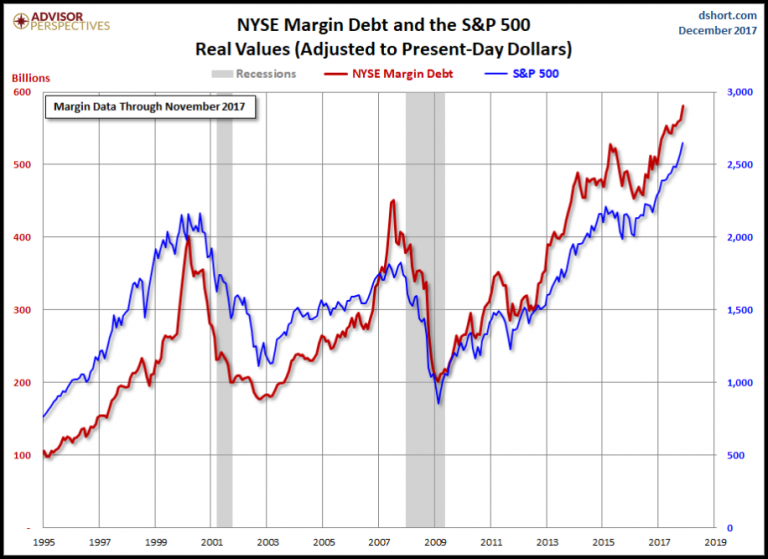
As we can see, the NYSE margin debt (by traders) is nearly $600 billion versus $400 billion in 1999 and $450 billion in 2007. Which means the NYSE margin debt is 33% higher than the level it was right before the 2008 U.S. Housing and Banking collapse. If we look at the 1999 and 2007 NYSE margin debt graph lines (RED), we can spot a huge spike right before they both peaked. If this is the way it will happen in the current trend, then we will likely see a huge spike and stock market MELT-UP before it peaks and collapses.
You know…. the last chance for the really stupid traders to get SUCKED in.
So, as the NYSE margin debt reaches new record territory, so has the VIX Index and the stock market. Yesterday, the VIX Index (measures volatility in the markets) closed at a new record low of “9”, while the Dow Jones Index ended the day at a record high of 24,922 points:
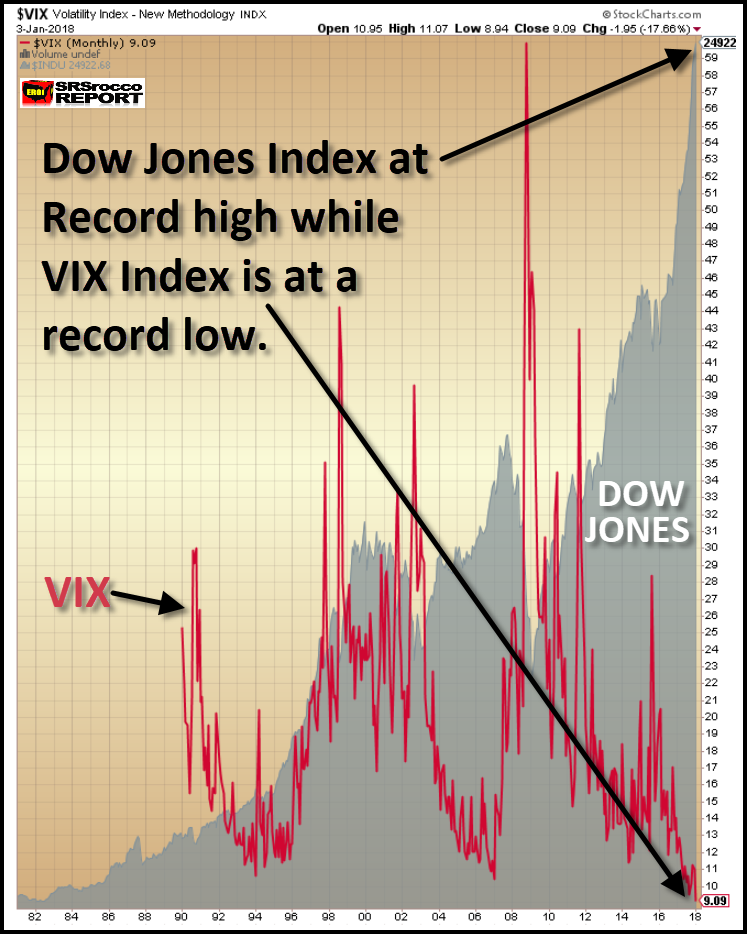
Today, the Dow Jones Index has reached another record at 25,100. Just like the cryptocurrency market, the only direction is HIGHER. Who knows how low the VIX Index will go and how high the Dow Jones will reach, but my gut tells me that this will be the year that the fun finally ends.
Of course, if we have new record highs in the stock markets, we should see the same with the U.S. Retirement Market:
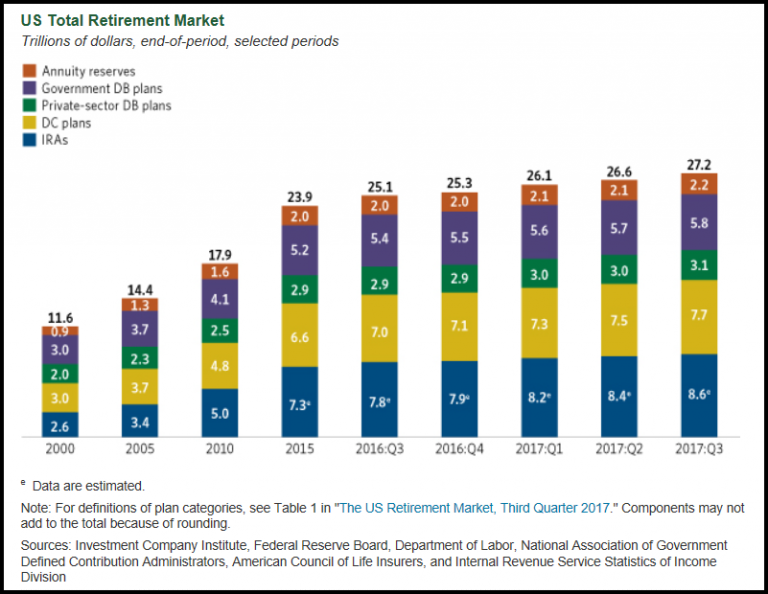
According to the ICI – Investment Company Institute, the U.S. Retirement Market hit a new record at $27.2 trillion in the third quarter of 2017. I would imagine the U.S. Retirement Market will surpass the $28 trillion mark in 2018. When Americans feel rich via their investments, it makes them also feel good about buying more crap they don’t really need or can afford.
You see, frugality has been totally erased from Americans’ mindset. By being frugal, I am talking about being extremely wise and cautious about spending ones fiat currency. Being frugal is one of the most important aspects of a successful household. However, if frugality were reintroduced to Americans, then the entire economy would collapse overnight. Why? Because, the U.S. economic model is based on buying as much as we can on debt and credit. If we moved back to being frugal or buying only with cash, then 95-98% of the U.S. economy would disintegrate.
What is quite interesting about the U.S. stock and retirement market is that their values have skyrocketed while our energy consumption has remained flat since 2000. This wasn’t the case from the 1950-2000 period. As U.S. energy consumption increased, so did the value of the stock market. This was also true for world GDP:
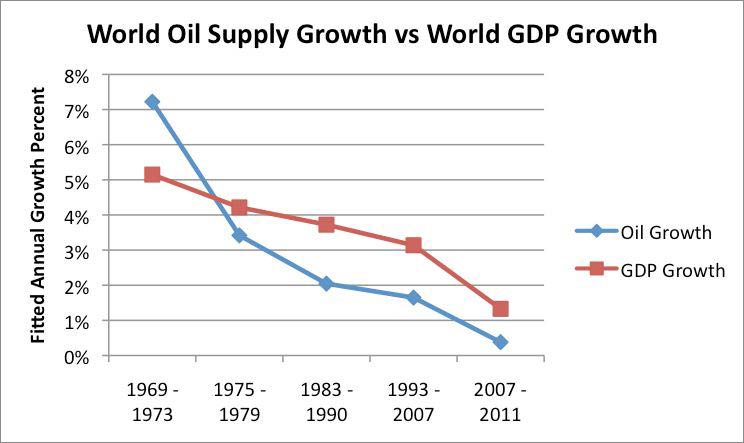
Global GDP growth increased in percentage in line with world oil production growth. However, it was different for the United States. While total U.S. energy consumption remained flat since 2000, the value of stock and retirement markets skyrocketed higher:
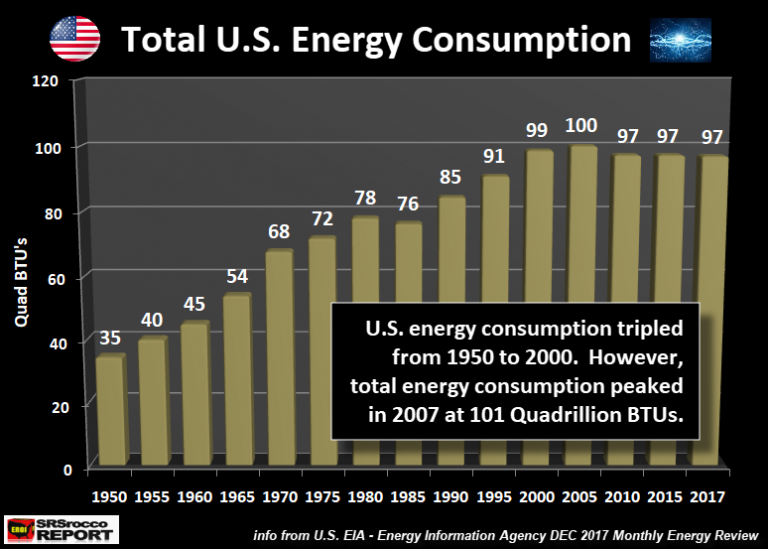
This chart shows total U.S. energy consumption in Quadrillion BTUs. As we can see, total U.S. energy consumption tripled from 35 Quad BTUs in 1950 to 99 Quad BTUs in 2000. However, total energy consumption has been virtually flat ever since 2000 while the value of the U.S. Retirement Market has increased from $11.6 trillion to $27.2 trillion and the Dow Jones Index has surged from 11,000 to 25,000 points currently. Both markets are up approximately 130% since 2000 while energy consumption is flat.
That is most certainly a neat trick by the Fed and Wall Street Banks. Of course, there will be individuals who say the value of STOCKS, BONDS, and REAL ESTATE can rise on flat energy consumption. They can say that because they are completely FOS… FULL OF SHITE. Pardon my French.
When we look at the world in digital values instead of energy data, we can come up with virtually anything. The value of stocks, bonds, and real estate have been wildly inflated due to Central Bank money printing and the tremendous increase in debt. If an individual stayed awake during their economic classes in high school or college, NET WORTH comes from subtracting DEBTS from ASSETS. However, today… we don’t worry about the debts. We only look at the assets. This is like eating all the junk food during the holidays and not worrying about the way it comes out the other end.
Americans have deluded themselves into believing that crap that is put on our dinner plate is good for us. So, why should we blame them if they forget about debts and only look at assets? It makes perfect sense when LIES and FRAUDULENT activity are the predominant ideology in society.
When The Markets Crack, So Will The Price Of Oil… and with it, The Economy
If you have been reading my analysis on energy, you would understand that oil is the KEY FACTOR to the health of our economy. It doesn’t matter if we were to come up with some new energy technology like cold fusion or thorium energy reactors, they don’t solve our LIQUID ENERGY PREDICAMENT. The world doesn’t run on electricity; it runs on liquid oil. If you remember anything, that is one not to forget.
Regardless, I have looked over cold fusion and thorium reactors (along with many other “silver-bullet” energy-saving technologies), and they just don’t work. Yes, I would imagine some individuals will send me information to the contrary, but the fact remains… our retail markets are based on the just-in-time inventory system. That system needs liquid fuels to function, not electricity. So, when liquid energy runs into trouble, the world economy runs into trouble.
While I have presented a lot of articles and analysis on the Great U.S. Shale Energy Ponzi Scheme, I am not going to focus on that today. Rather, let’s look at the oil price and its dynamics going forward. As I have mentioned, I believe the price of oil will trend lower even though we may experience price spikes. My realization of the continued falling oil price came from the Thermodynamic work of Bedford Hill (TheHillsGroup.org) and Louis Arnoux. While some do not agree with the findings of The Hill’s Group or Louis Arnoux, the only error I can see in their work is the timing of the Thermodynamic Oil Collapse. And that is really not an error as they stated their calculations are based on the “Average Barrel of oil.” Thus, there is room for improvement of their model as well as a degree of accuracy… but not much.
If we look at the current oil price chart, it seems as if it is heading back towards $65 (200-month moving average-BLUE LINE) and then up to $100:
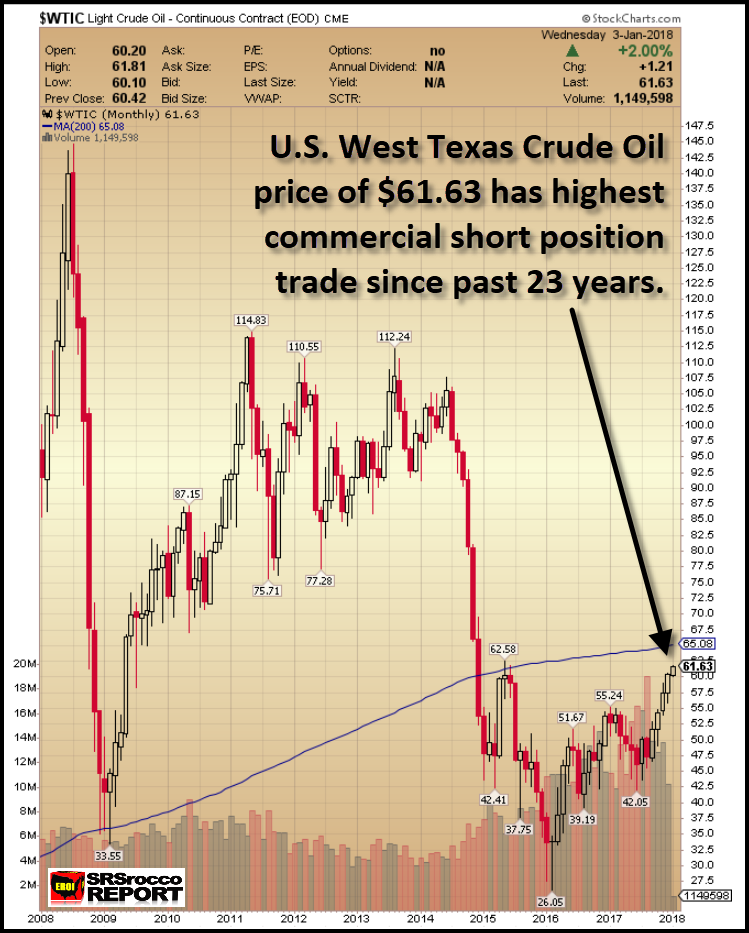
However, the COT Report (Commitment of Traders) shows a much different setup. The amount of commercial short positions in the oil market is the highest going back 23 years. Furthermore, the current 644,000 commercial short positions are even higher right before the price fell from $105 in 2014:
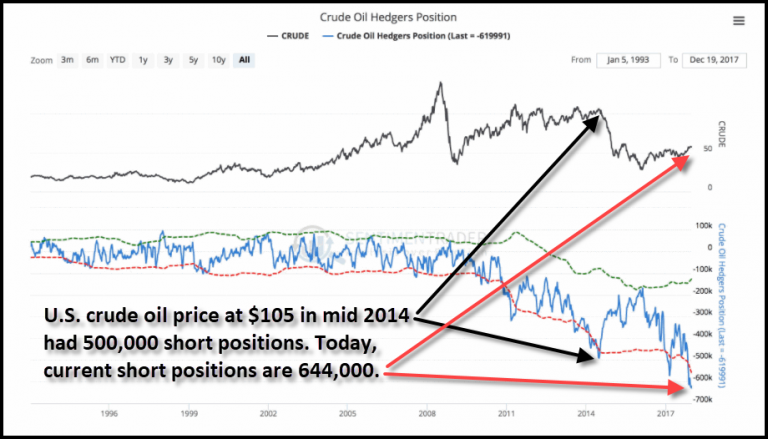
You will notice when the price of oil was at $105 in 2014, the commercial shorts (hedgers positions) were approximately 500,000 contracts. Today at $62, the current commercial short positions are 644,000 (the chart above is two weeks old). Furthermore, when the price of oil fell from $105 down to a low of $26 at the beginning of 2016, the commercial short positions fell to a low of 180,000 contacts. So, it looks like the oil price is being set up for one hell of a fall.
Now, the interesting part of the equation is this… will the oil price fall when the markets crack, or before? Regardless, if we look at all the indicators (VIX Index record low, Stock Market Record High, NYSE margin debt record high or commercial short positions on oil at a record high), we can plainly see that the LEVERAGE is getting out of hand.
These indicators and others give me the impression that the economy and markets are going to BLOW UP in 2018.
Moreover, this setup already took place in the market back in 1987. While I have written about this in a previous article, I wanted to show it using the oil price from 1984-1988. Very few people knew that the oil price dropped like a rock from $31 in 1985 to a low of $10 in 1986:
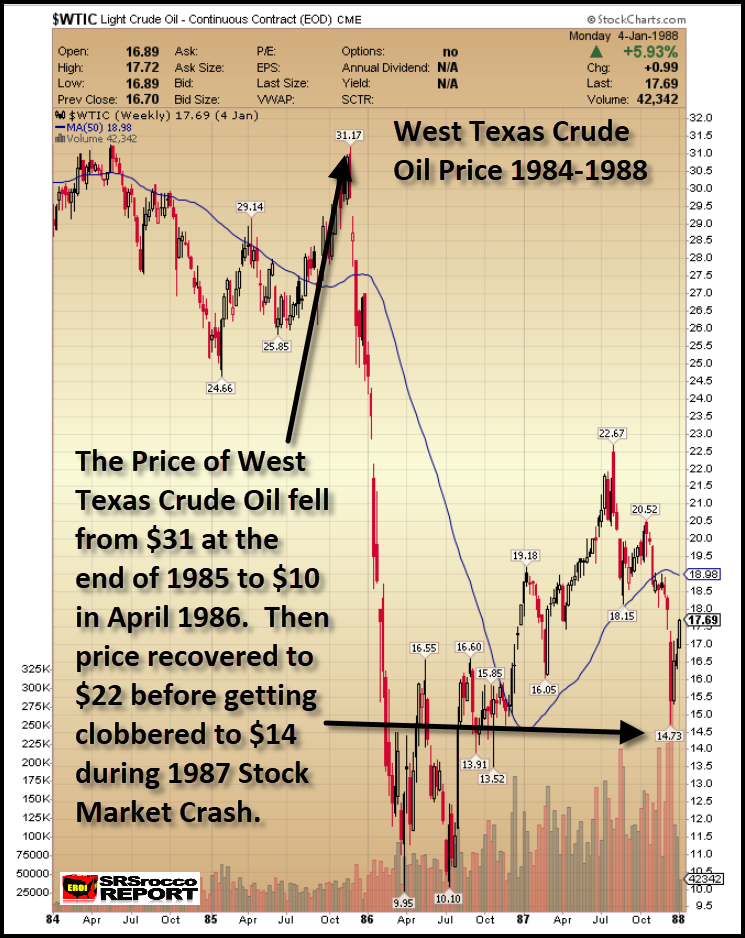
The decline in the price of oil from $31 to $10 was quite similar to what happened in 2014 when the price fell from $105 to a low of $26 in 2016. Also, the oil price recovery in both periods was quite similar as well. From July 1986 to August 1987 and from January 2016 to January 2018, the oil price (and economy) recovered. The oil price more than doubled from its low in 1986 ($10-$22) and 2016 ($26 to $62).
However, a few months before the infamous BLACK MONDAY Stock Market Crash on Oct 19, 1987, the oil price peaked and declined by nearly 20% ($22 down to $18). So, are we going to see a similar pattern this time around? Will the warning shot be the peak and decline of the oil price as it’s currently being set up by the record amount of commercial short positions? These are all very good questions in which I have no answer, but clearly, history does repeat itself.
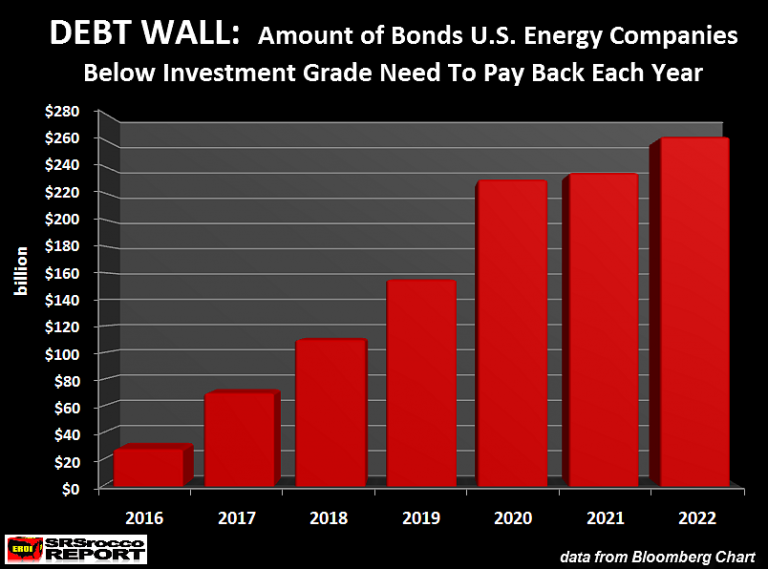
Either way, the indicators are pointing to one hell of a deleveraging of the markets. Investors need to understand when the oil price heads south once again; it will likely be the death-knell for the already weak U.S. Shale Oil Industry. We must remember, when the markets were collapsing in 2008, the U.S. oil industry was still in relatively good shape. Today, most of the shale companies have debt up to their eyeballs. Once again, here is the chart of the coming ENERGY DEBT WALL:
The tactic used by the Shale Energy Industry was to take investor money and push back the PAYBACK as far as possible. The intent was to BAMBOOZLE as many SUCKERS as possible before anyone realized just how unprofitable it was to produce shale oil and gas. A perfect example of this is the poster child of what’s wrong with the shale oil industry… Continental Resources.
Before Continental Resources embarked on the Great U.S. Shale Ponzi Scheme, the company only had $165 million in debt (2007) and was paying an annual interest payment (on their debt) of $13 million. Fast forward to today, Continental now has over $6.6 billion in long-term debt and will likely pay over $300 million in their interest expense this year.
This is precisely why Continental Resources announced the issuance of $1 billion in new Bonds so they could pay off existing ones that were coming due. And get this. The SUCKERS who purchased the $1 billion of new bonds, will not be paid back until 2028… LOL.
The POOR SLOBS that purchased those Continental bonds need to read about the Fiasco that happened to BHP Billiton when they blew over $50 billion in their investment in the wonderful U.S. Shale Ponzi Scheme.
I would like to remind investors that the definition of a PONZI SCHEME is to use new investor money to pay off existing ones. This is exactly what is taking place in the U.S. Shale Energy Industry. Because Continental has pushed back the payback period for ten years, they have received additional funds to continue the facade a bit longer. It is quite likely that Continental Resources will no longer be around in ten years to pay back that debt.
But why should that matter? Why should the CEO care about the debt if he made $millions and was able to sell most of his stock before the public realized what a worthless PIECE OF GARBAGE shale oil and gas have been?? Again, this is the fabric of our society. As long as some other SMUCK get’s stuck with the bill…… who gives a RATS AZZ??
To tell you the truth, when the markets finally crack, and the real carnage rips through the U.S. economy, we only have ourselves to blame. There are no pointing fingers when we are all involved. Especially the Bitcoin and cryptocurrency fanatics. I hate to say it, but those who believe they are going to get rich on CRYPTOS so they don’t have to work anymore…… let me provide you with my famous saying.
GOD HATH A SENSE OF HUMOR…..
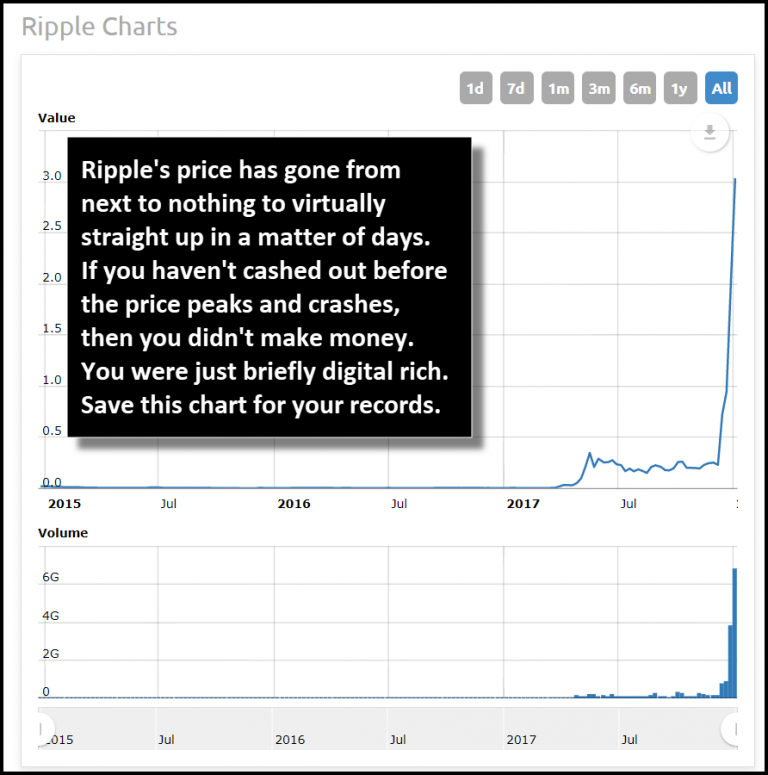
Currently, the cryptocurrency that is now stealing the show is Ripple. Anyone who bought Ripple a year ago for $0.005 a piece is salivating on the profits they have in their account. I would imagine the BOOZE and MONEY SPENDING are really flowing. However, if you look at Ripple’s chart and you don’t see a problem…. you might want to check yourself in and get an MRI brain scan:
There’s a lot more that I can say about Ripple and the other cryptocurrencies, but either you get it, or you don’t. Those that don’t get it now… will likely get it shortly. Unfortunately, the cryptos won’t be the new technology that will change our world for the better. Rather, they will be another Tulip Mania that we can add to the growing list.
In conclusion, the U.S. and world economies are heading towards one heck of a crash. What happens when this occurs, it’s anyone’s guess. Likely, the Central Banks will step in with their magic and print money like crazy. However, this is not a long-term solution. If you haven’t bought some physical gold and silver insurance yet and are waiting to time the markets, GOOD LUCK WITH THAT.
Lastly, I wanted to personally thank all those who have supported and continue to support the SRSrocco Report site. Your generous support allows me the opportunity to continue putting out the analysis and articles. As I have mentioned, I will be soon putting out new Youtube Videos that I believe will help explain some of these concepts better.
Check back for new articles and updates at the SRSrocco Report.
Special edition:
The Edelson Institute
Outlook for 2018
Contents
- 2017 Was Big. Can 2018 Be Bigger?
- 6 Bears Growling at the Door
- 7 Bulls Pawing at the Floor
- Two Charts to Warm Your Heart
- Oil Bubbles Up
- Copper Shines on China Demand
- What About Gold
- Areas of Interest in 2018
2017 Was Big. Can 2018 Be Bigger?
It is the best of markets. But according to some, it is the worst of markets.
The S&P 500 gained 20% in 2017. But there are those who say it’s on the precipice.
Commodities are booming. But some say they’re about to get shredded.
Crypto currencies are the next best thing … or cryptos are already over.
It’s a confusing world out there. I wouldn’t blame you for being confused. Or even scared.
No one can predict the future with precision. But I can tell you this with great confidence: I think there are some extraordinary opportunities on the table. Ones that, if you miss, you may regret for the rest of your life.
If you aren’t in this market, your odds of missing out on the good days will hurt more than missing out on the bad days.
Now, I’m not some perma-bull Wall Street pumper. It’s simple math.
Per an analysis by Calamos Investments, $10,000 invested in the S&P 500 at the start of 1996 would’ve grown to $43,930 by the end of 2016. An 8.19% annualized return. That assumes a buy-and-hold strategy. Plus, it assumes staying in the market through the Tech Wreck of 2000-’02 and the great crisis of 2007-’09.
However, if you take out the five best days over that time frame, the return shrinks to an annualized gain of 5.99%.
Those big days, when they come, can be extraordinary. And you have to be positioned before they occur.
More recently, breaking it down to individual markets, we saw some of those big days in 2017 in tech (especially semiconductors) … healthcare … defense stocks … banks. And the industry that the rest of the market would like to ignore — cannabis!
And 2018 looks awesome. Not only for cannabis, but for a whole bunch of things I’m going to tell you about today …
Investors see 6 bears growling at the door.
But are they real? Will they bite?
First, let’s deal with what many investors perceive as the “elephant in the room.” That is, the fear that the broader market is overvalued. And along the way, let’s tackle each of the bear arguments that are commonly made.
Bear argument #1: Retail investors are “all-in” and there’s no more money coming into the market.
True, net margin debt in New York Stock Exchange customer accounts hit the highest level in data going back to 2003. And yes, this is typically associated with market tops.
But as I’ll explain in a moment, there’s a lot of new money coming from other sources.
Bear argument #2: U.S. stocks are overvalued compared to foreign markets.
Schroder Investment Management says that the S&P 500 is at its most overbought level in 22 years. And it put out a chart showing the S&P 500 against other global markets. The red means overvalued …

Sure! Absolutely! In fact, this reflects precisely what we have been predicting all along:
Flight capital is flowing out of global markets into the U.S. and should continue to do so. In other words, U.S. stocks will get MORE overvalued relative to foreign stocks. And this is the other major source of money that’s boosting the U.S. market.
 Bear argument #3: The Fed has started to unwind its massive, multitrillion-dollar, QE bond-buying program. You’ll remember that the Fed’s balance sheet grew from about $1 trillion in 2008 to $4.5 trillion today.
This is associated with the rise in stock prices we saw at the same time. So when the Fed unwinds … then what?
The Fed started unwinding already, in October, at a rate of $10 billion per month. This will rise every quarter until it hits $20 billion and $30 billion per month.
This will almost certainly lower bond prices and raise interest rates. Some corporations, foreign and domestic, carry debt leveraged to those interest rates. So, this could spark all sorts of trouble for them.
But investors are vastly premature in anticipating the impact of rising rates for several reasons:
-
The Fed has already been unwinding for three months already. And nothing bad has happened yet.
-
The world’s leading companies are flush with cash and are not strangling in debt.
- Interest rates are so low right now that, even if they double, interest costs at most corporations will still be a small fraction of their expenses. Rising interest rates won’t start to take a substantial bite out of corporate profits until they reach much higher levels.
Bear argument #4: President Trump has repeatedly threatened to withdraw from the North American Free Trade Agreement, which might hurt economic growth in North America. His economic and diplomatic advisers persuaded him to delay trade actions in 2017. But, say the bears, 2018 could be different.
The reality: Trump could tinker with NAFTA and trade agreements. But disruptive changes are very unlikely. Moreover, as I’ll explain in a moment, the U.S. contribution to global growth is a lot smaller than most people think.
Bear argument #5: Former FBI Director Robert Mueller’s investigation has snared Trump associates … and could entangle the President himself. At the very least, this would stoke market volatility. It could also trigger a constitutional crisis.
That’s politics. In hard dollars, however, the billions of consumers and hundreds of thousands of businesses that make up the global economy don’t seem to care. They continue to spend and invest regardless of politics.
Bear argument #6: North Korea. Russia. NATO. China. The Middle East. All sorts of overseas problems could affect global markets, and therefore, our markets.
But the facts so far show that the primary affect is mostly bullish: The more trouble we see overseas, the greater the flow of fear money into U.S. stocks and real estate.
Are there enough partial truths in the bear arguments to rile investors? Absolutely! Could they precipitate a sharp market correction? Of course.
But before you reach for a bottle of whiskey, let me show you how the bullish forces are far more powerful …
7 Bulls Pawing at the Floor
 Bullish force #1: Earnings. The estimated earnings per share of the companies in the S&P 500 Index is $114.70. That’s very good.
Plus, earnings are expected to grow by 18% in 2018 to $135.40. That’s even better.
Michael Kramer of Mott Capital lays out the bull case: Since the fourth quarter of 2013 — admittedly a relatively short time frame — the S&P 500 has been trading around 23 times trailing earnings. Since 1988, just over 21.5 times on average.
The S&P 500 is currently trading at 19.8 times 2018 estimates. But at 21.5 times, he estimates the index would move up to 2,910. And if the S&P 500 makes it up to a 23-times average, that means the S&P 500 could hit 3,100 in 2018.
This would be a 15% gain from year-end 2017.
Bullish force #2: 20 years of consolidation (pent-up buying power).
 This chart from Ciovacco Capital tells the story …
It shows a breakout that puts 20 long years of stock market action behind us. So, it would be perfectly within reason to expect the ensuing rise to also span many long years.
Look at it this way …
For two decades, many investors hesitated to buy stocks for fear of bear markets and crashes. And throughout that period, no one could say with any degree of certainty who would ultimately win the bull-bear debate. Now, the debate is over. The bulls are clearly the victors. And all those investors who missed the move so far — whether individuals or institutions … whether domestic or foreign — are looking for the next opportunity to get in.
And here’s a factoid for you. The S&P 500 closed on a “perfect year” — 12 consecutive months of higher closing prices in a calendar year.
The last time this happened? Never.
Bullish force #3: Lower corporate taxes. You know this. But let me say it again:
The GOP plan calls for a permanent reduction in the federal corporate tax rate from 35% to 21%. That’s a whopping 40% tax break and rocket fuel for corporate earnings in 2018.
 The new tax law also includes a one-time, 12% tax on corporate cash held overseas. This could encourage companies to repatriate hundreds of billions of dollars. Some of that cash would be funneled into dividends, buybacks and capital spending.
Bullish force #4: Odds of a recession are falling. That’s according to the Conference Board’s Leading Economic Index. This index has, prior to seven of the past eight recessions, dipped below zero “with few false alarms.”
Now the index is far from zero and rising. This suggests the odds of a recession are receding, not growing.
Bullish force #5: Economic boom. Global growth is improving. According to the World Bank, the global economy is expected to average a Real GDP growth rate of 2.8% between 2017 and 2019.
As you might expect, China will lead the way. It is set to contribute 35% of the world’s expected economic growth in that time frame. The U.S., meanwhile, contributes only 17.9% of the growth. So even in the unlikely event that changes in NAFTA put a damper on the North American economy, the impact will on global growth will be buffered.
Other forecasters are even more optimistic, at least in the short term. Respected forecasters at PwC put global growth at 3.7%. That’s the fastest rate in seven years.
Closer to home, U.S. economic growth in the third quarter of 2017 was 3.3%. That’s the fastest pace in three years.
This is a key reason our colleague Michael Carr expects “More Double-Digit Gains Ahead in 2018.”
 Bullish force #6:Renewable Renaissance. Renewable power now accounts for the majority of growth in global electricity output.
The chart above from the International Energy Agency (IEA) shows how dramatic this change has been since the early 2000s. Back in 2004, renewable energy accounted for just one-fifth of the growth in the electric energy worldwide. Now it’s about three-fifths of the growth. That’s a big deal.
By 2022, renewable energy output is expected to be bigger than the entire electricity consumption of China, India and Germany combined.
And it could accelerate faster, as the cost of renewable energy continues to fall. Meanwhile, the faster renewables grow, the faster new technologies are introduced. And that adds to economic growth.
This is something new the world has never seen before.
Bullish force #7: The Electric Vehicle Megatrend. We are seeing a massive shift in personal transportation. The last time we saw something like this was at the beginning of the 20th century. Then, horse power was on the way out, and internal combustion engine (ICE) transportation was on the way in.
Now, we’re at the end of the “ICE age,” as the world shifts full-bore into the electric vehicle megatrend.
I’ve written many columns about this. Here, here, here and here, for starters. And it’s important to note that all estimates of the growth of the EV megatrend have been too conservative.
That said, the latest from BCC Research says that the global market for electric vehicles will grow from $75.7 billion in 2017 to around $127.7 billion by 2022. That’s a compound annual growth rate (CAGR) of 11.0% for the period of 2017-’22.
This creates multiple spin-off booms — not only in the mining of energy metals, and the building of lithium ion batteries … but also in all sorts of related industries and technologies.
Two Charts to Warm Your Heart
We can’t just count on history repeating itself. We have to be ready for the new opportunities. And that brings me to two charts I posted last week.
You saw them, right?
Well, in case you didn’t, let’s start with this one …
 This is a chart I snagged from Bloomberg and posted to The Edelson Institutesite in a column titled: “Your Once-in-a-Generation Buying Opportunity.”
This chart compares the Standard & Poor’s GSCI Total Return Index, which tracks 24 raw materials, against the S&P 500.
It shows us that commodities haven’t been this cheap compared to stocks since 1999. A generation is 25 years. So, this is as close as we’ll get to a once-in-a-generation buying opportunity.
As I said in my article:
There are two ways this chart could resolve.
-
Stocks could get a lot cheaper. But our work at The Edelson Institute tells us that, despite the ever-present chance of a correction, stocks are going higher — potentially much higher.
- Commodities could go higher, even faster. Indeed, we’re already seeing this start to happen — the first sparks of what is likely to be a great bull run.
Now, let’s add another chart to that. Here’s a chart I posted to Twitter on Thursday …
 It’s the CRB Index, which tracks a basket of 19 commodities: Aluminum, Cocoa, Coffee, Copper, Corn, Cotton, Crude Oil, Gold, Heating Oil, Lean Hogs, Live Cattle, Natural Gas, Nickel, Orange Juice, RBOB Gasoline, Silver, Soybeans, Sugar and Wheat.
So, it’s a good measure of what’s happening in the commodities market.
See that cup-and-handle pattern on the chart?
Let’s dip our toes in the technical pond for bit. A bullish resolution (breakout) from this pattern would give us an initial target in commodities that is 13% higher than recent prices.
That’s the initial target. It could go much higher.
Let’s look at two commodities in particular: oil and copper.
Oil Bubbles Up
At the end of 2017, the price of West Texas Intermediate, the U.S. crude oil benchmark, pushed above $60 per barrel for the first time in two years. This is despite a parade of doom-and-gloom callers in the mainstream media.
I will point out that we gave you the straight line on why oil was going higher. Here’s one example.
Here’s the key: The Organization of the Petroleum Exporting Countries (OPEC) and a Russian coalition of non-OPEC exporters were able to make production cuts stick.
At the same time, geopolitical tensions in the Middle East and pipeline disruptions from the North Sea to Canada and Libya added more heat.
Finally, global oil demand is growing. Not just for oil, but also for copper …
Copper Shines on China Demand
Our esteemed colleague Matt Badiali hits the nail on the head: “2018 Will Be a Fantastic Year for Copper Miners.”
China has shut down its top copper producer, Jiangxi Copper Co., as part of its war on smog. At the same time, China’s imports of finished copper are soaring. Up 19% year-over-year in November.
China is the world’s largest consumer of industrial metals. It accounts for nearly half of global copper and aluminum demand, estimated at around 23 million tonnes and 62 million tonnes, respectively, for next year.
No wonder copper just jumped to a 3.5-year high! It’s the longest winning streak for the metal in nearly 30 years.
And this bullish story has a long way to run …
 Along with demand, there are problems with supply. There are over 30 labor contracts, covering around 5 million metric tons of mine supply, due to expire next year. Most of them are in Chile and Peru. That could mean strikes at large copper-producing mines in those countries.
And that means that this next chart of copper could see its trajectory continue …
I was telling you about “China’s Copper Tsunami” early in 2017. That story looks likely to grow in intensity.
What About Gold?
We are in a seasonally strong time for gold. And this is laid over strong demand from central banks, including Russian and Chinese central banks.
But the main force driving gold prices higher (for now) is a weakening U.S. dollar.
The U.S. dollar just clocked its steepest annual decline in more than a decade, and its first yearly loss since 2012. While The Edelson Institute expects the dollar to recover in 2018, the first half of the year could see more downside.
And that means more upside for gold. Let me show you two charts on that.

The first chart shows the relationship between gold (the yellow line) and the U.S. dollar/Japanese yen cross-trade. You can see that, as one goes up, the other goes down. I call this relationship “the seesaw of pain.
The second chart, from Optima Investments, shows the longer-term price action in the U.S. Dollar Index INVERTED. And that’s above a chart of gold futures.

You can see that they’re both ready to break out of chart patterns. These patterns, if triggered, could send gold blasting higher.
Why is the dollar weakening? Well, you know that the stock market is an expectations game, right? The currency/forex markets are doubly so.
On an absolute basis, there is no reason any currency in the world should be strengthening vs. the dollar. The Fed hiked rates three times in 2017. It is hinting at hiking three more times in 2018. No other major central bank is even close to doing this, especially not the ECB and BOJ, both of which have ongoing QE programs.
However, the market has already priced in those absolute policies. Right now, that means the second derivative, or the rate of change of change, is driving currencies.
What’s that mean? The market views the chances of the ECB and BOJ getting incrementally more hawkish as greater than the chances of the Fed getting more hawkish.
Put another way, the market is reflecting the view that there’s a better chance we get a hawkish surprise from the BOJ (via dialed-back accommodation) or the ECB (via an abrupt end to QE) than we do from the Fed.
 One last chart: One that shows that, beyond what happens with the U.S. dollar, the bigger picture for gold remains incredibly bullish.
This is due to cyclical factors. Gold went through a 5 ½-year-long bear market. During that time, new exploration dried up. Meanwhile, existing mines — having delivered up unrenewable resources — are seeing grades and remaining gold reserves go lower.
It’s a cyclical supply/demand squeeze that should mean much higher prices for gold.
Our precious metals positions in my Supercycle Investor trading service are doing well. Every single one of them is up from the initial recommendation. I expect we’ll do a lot more going forward in 2018.
Areas of Interest in 2018
Big, long-term cycles can sometimes turn slowly. But onward they roll.
In 2018, we’ll place more bets to ride the big cycles — and the massive megatrends — that are evident to anyone with eyes.
Hard work, including boots-on-the-ground research and a systematic approach to investing, should give us an edge over other investors.
Here are areas of interest I find quite appealing in 2018 …
-
Precious Metals: The new bull market that began at the beginning of 2016 seems to be coming out of a correction. The next leg could be quite exciting.
-
Base Metals: Some feed into global growth, some are part of the energy metals boom. Almost all are moving higher.
- Energy Metals: Cobalt, lithium, nickel, copper. Also graphite, which is not a metal, but is vital to li-on batteries. And as Matt Badiali reminded us last week, don’t forget uranium, the “Hated Commodity That Could Make Huge Gains in 2018.”
-
Cannabis: Massive markets are opening up in 2018: California first, then Canada. We’ll also see New Jersey legalize recreational marijuana, and that’s a big state. Michigan is moving ahead. And Massachusetts, which legalized last year, will finally put legislation in place to make it happen. These stocks have enjoyed great runs; a correction is likely. But a correction could lead to a great buying opportunity.
-
Cybersecurity: 2018 will see the first AI hacking programs that are more talented than human beings. That should really scare anyone with electronic money. (All of us.) Jeff Yastine tells you more in “Cyberattacks Prove That No One is Safe.”
-
Electronic Payments: The wave of the future.
-
Blockchain and crypto currencies: An important building block and opportunity in electronic payments.
-
Defense: The war cycles are shifting into higher gear.
-
Renewable Energy and Renewable Tech: Two areas that should see massive growth in 2018.
-
Oil and Gas: This isn’t going away anytime soon. Oilfield tech could be of particular interest.
- Robots: This includes drones. One of the growth areas of the next decade. Automation could affect 375 million jobs by 2030, according to a new report from McKinsey & Co.
As you can see, this gives us plenty to play with. Going forward, I’ll put together a list of playable ETFs in each of these areas. And subscribers can look for specific stock recommendations when applicable to their publications.
Looking forward to a profitable 2018 with you.
All the best,
Sean Brodrick
 Throughout history, political, financial, and military leaders have sought to create empires. Westerners often think of ancient Rome as the first empire. Later, other empires formed for a time. Spain became an empire, courtesy of its Armada, its conquest of the New World, and the gold and silver extracted from the West. Great Britain owned the 19th century but lost its empire due largely to costly wars. The US took over in the 20th century and, like Rome, rose as a republic, with minimal central control, but is now crumbling under its own governmental weight.
Invariably, the last people to understand the collapse of an empire are those who live within it. As a British subject, I remember my younger years, when, even though the British Empire was well and truly over, many of my fellow Brits were still behaving in a pompous manner as though British “superiority” still existed. Not so, today. (You can only pretend for so long.)
But this does suggest that those who live within the present empire—the US—will be the last to truly understand that the game is all but over. Americans seem to be hopeful that the dramatic decline is a temporary setback from which they will rebound.

-
I know Mike is a very solid investor and respect his opinions very much. So if he says pay attention to this or that - I will.
~ Dale G.
-
I've started managing my own investments so view Michael's site as a one-stop shop from which to get information and perspectives.
~ Dave E.
-
Michael offers easy reading, honest, common sense information that anyone can use in a practical manner.
~ der_al.
-
A sane voice in a scrambled investment world.
~ Ed R.
Inside Edge Pro Contributors

Greg Weldon

Josef Schachter

Tyler Bollhorn

Ryan Irvine

Paul Beattie

Martin Straith

Patrick Ceresna

Mark Leibovit

James Thorne

Victor Adair