
Timing & trends
The metals have been exhibiting as an actor in a soap opera would. They have taken us to the edge of our emotions on each and every swing, as they take us to the edge of each of our support and resistance regions, and then turn. But, I think many of you have lost the focus of the forest due to your concentration on the leaves. So, this week, I am going to open with our discussion of the leaves, and then focus on the forest. It’s time to get serious about this complex.
Ultimately, my point will be that anyone who is serious about this complex should look upon this market today as we did back towards the end of 2015, and look for buying opportunities, while keeping in mind the potential for that dreaded one more lower low. And, sometimes, the market surprises us and does not provide us with the lower low, and simply takes off. Either way, it’s time to prepare.
For the last several weeks, those that have reviewed my charts would have seen the clearly marked blue box support on my 8-minute GDX between 20.89-21.26. Moreover, we have been noting that should this support hold, we can see a strong rally off this region, and it can mark the long-term bottom in this complex. This past week, the market touched a low of 21.27, and began what seemed to be a strong rally.
(While I have been doing this for many years, I can honestly say I am still amazed at the accuracy of the turning points that Elliott Wave, coupled with our Fibonacci Pinball method, is able to provide us time and again, as we bottomed within one penny of our noted IMPORTANT support level, and the rallied to within pennies of our noted resistance.)
However, our analysis last weekend also noted that as long as 22.30 is respected as resistance, we have no initial indications of a longer-term bottom being in place. Moreover, the rally through 22.30 should have taken shape as an impulsive structure, and, to be honest, the rally off this past week’s lows counts best as a 3-wave rally in GLD, silver and the GDX.
So, yes, this action is still signaling strong potential for the dreaded one more lower low yet to be seen. But, with the manner in which the market reacted this past week, I caused me to modify my more “bearish” count in GDX to be looking for not two more lower lows, but, now, only one. As you can see, my primary count now views the rally we experienced this past week as an a-wave of wave 4 of an ending diagonal c-wave. That means we can see another rally to take us to at least 22.85 (a=c), with the potential of taking us as high as the 23.50 region (c=1.618*a) for wave 4.
I will note that the scenario I have been outlining the last few months of two lower lows pointing down to the 17-19 region is still “technically” on my radar as long as we remain below 22.30. But, I think the current micro set up is pointing to the GDX imminently breaking out over that level to invalidate that potential. So, consider that if we break 21.27 before we are able to break out over 22.35, it keeps that potential pattern alive. But, for now, I have taken it off my GDX daily chart as one of the top two potentials from a probabilistic sense, and it will only come back should we break down below 21.27 in the coming week.
Now, I am quite certain many of you are reading this and asking yourself “but can’t we simply break out from here?” And, the answer is that it is possible. But, since I do not have clear 5 wave structures off the recent lows (especially not in silver), we can view it as a 1-2, i-ii off the recent lows, which would portend a very strong rally about to be seen in the complex. And, since the pullback off this past week’s highs looks more corrective, I am going to look higher as long as we do not approach last week’s lows. In fact, I am starting to get the same sense of FOMO (Fear Of Missing Out) that I was “feeling” back towards the end of 2015 when I was strongly suggesting people be buying for the longer term.
So, this brings me to the discussion of the forest. It is really easy to get caught up in the micro-counts on these charts. It is also really easy to feel dejected or indifferent to this market due to this year and a half long pullback/consolidation we have been experiencing. So, it is time to remember that we are tracking a 2nd wave pullback off what we believe to be the VERY long-term lows struck in this complex.
As Frost & Prechter noted, “[s]econd waves often retrace so much of wave one that most of the profits gained up to that time are eroded away by the time it ends. . . At this point, investors are thoroughly convinced that the bear market is back to stay.”
Now, I think we have all read how a sizeable segment in the market is convinced that we are likely heading much, much lower in this complex. So, it does seem as though the character of a 2nd wave is exhibiting itself quite well during this decline we have been experiencing, especially since we broke the upper support back in September of 2017.
Therefore, for those investors that have a time horizon of longer than a few months, I suggest you look at the daily GDX and ABX charts. As you can see, my primary expectation is that we can surely see one more lower low in the complex, assuming the ideal pattern plays out in the coming months. However, as those who have experience in this complex know, sometimes the market does not provide us with that ideal lower low. We certainly have the minimum number of waves in place to support a complete 2nd wave structure. But, as I noted in late 2015, now is the time to be looking to deploy your capital, again, as long as your time horizon is longer than the next few months, as 2018 looks to be setting up as a very strong year for the metals complex.
See charts illustrating the wave counts on the Silver, GDX, GLD & ABX. (First published on Sunday Dec 17 for members)
Avi Gilburt is a widely followed Elliott Wave technical analyst and author of ElliottWaveTrader.net (www.elliottwavetrader.net), a live Trading Room featuring his intraday market analysis (including emini S&P 500, metals, oil, USD & VXX), interactive member-analyst forum, and detailed library of Elliott Wave education.

Listen – HERE Mp3 download.
Highlights
- Brimming with holiday cheer, Bob Hoye of Institutional Advisors rejoins the show with comments on the global financial bubble.
- The Dow could be approaching an ultimate peak – current valuations are stretched beyond those of the last equities market top of 2000.
- Bitcoin recently eclipsed the total value of Wal-mart, which should make for enlightening discussion around the holiday dinner table.
- As relatives learn that their disenfranchised Junior, Grandma Kettle and Uncle Fester, who have long shared the privilege of residing in the palatial household basement, suddenly hold enough BTC to pay off the mortgages of the entire neighborhood, a big spike in popularity is anticipated.
- One compelling BTC price estimate is $180,000.
- Gold hedge funds are turning away from PMs to Bitcoin to boost profits. Since the institutional money is finally pouring into the BTC realm.
- Bitcoin / altcoin miners are literally printing money, with the expressed blessings of the Fed / Treasury, as hubris filled authorities consider cryptos merely a commodity.
- Both the guest / host concur that the PMs offer solid relative values, with silver the more enticing of the two.
- The TEZOS ICO** with a minimum investment of $250 recently launched in pre-ICO skyrocketed to $12 (Figure 1.1.).
- Investors could reap a 20 fold increase in the $250 investment.
- Futures are trading on BitMEX for pennies using 100x’s leverage or no leverage at all, plus BitHTC.
- Berkshire Hathaway Shares trade for $300,000 – where is the Bitcoin Bubble when Bitcoin is 20 times cheaper?
- The much anticipated B2X fork will take place around December 28th!
$4,000 * 450M / 10M = $180,000
Now that gold hedge funds are turning to Bitcoin to boost profits, will the new institutional interest transfer to the herd as usual, resulting in a feeding frenzy, catapulting price into the vicinity of $100k? Berkshire Hathaway Shares trade for $300,000 – where is the Bitcoin Bubble when Bitcoin is 20 times cheaper? Bitcoin / altcoin miners are literally printing money with the expressed blessing of the Fed / Treasury, as authorities in their hubris consider cryptos only a commodity, not real money. Both the guest / host concur that the PMs offer solid relative values, with silver the more enticing of the two – both anticipate a new bull market rally in the sector.
Figure 1.1. TEZOS pre-ICO futures on HitBTC

Note: Graph prepared by Chris G. Waltzek – courtesy of HitBTC.

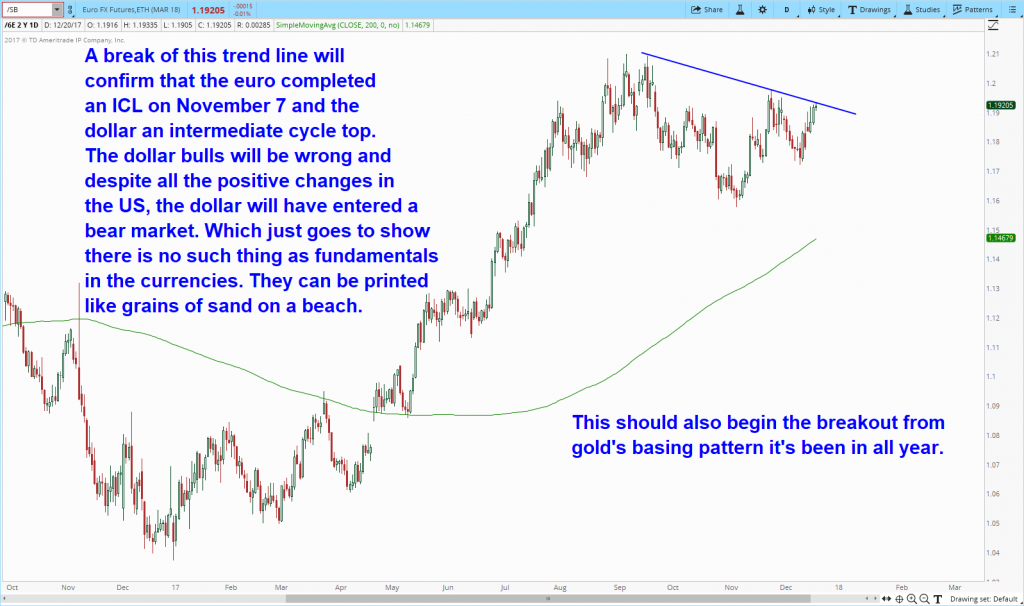
A break of this trend line will confirm that the Euro has entered a bull market and the dollar has entered a bear market. Gold is expected to finally be released from its year-long basing pattern.
One of the traditional push backs against attempts to predict “black swan” events is that they are by default unpredictable, rendering the entire exercise moot. However, for the second year in a row, Nomura’s Bilal Hafeez has found a loophole, or rather loop-animal: the grey swan.
As Hafeez writes, while he would like to be able to predict black swans, by definition that is impossible. “However, its close cousin the grey swan can be foreseen. These are the unlikely but impactful events that, in our opinion, lie outside the usual base case and risk scenarios of the analyst community. So as we did last year we have put on our creative hats and have come up with 10 potential grey swan events for 2018.“
For the purpose of this exercise, Nomura avoided the more widely discussed – and more probable scenarios such as the Italian elections, US Impeachment risk, North Korea conflict, which it covered in its event risk radar series, and has instead selected topics that have not been as widely discussed.
“Needless to say, none of them are our base case, but we think it is better to be prepared than not.”
So without further adoNomura’s potential grey swan events for 2018 include:
…also from Zerohedge:
“They Are Sleepwalking Into A Major Correction”: One Trader Expects A Violent Move In Bunds
The last week has seen the metals and miners drop down into support regions. As I write this, we are sitting just over major support for most of the charts I follow.
Whereas the GDX likely provides the cleanest picture of the market potential right now, I will be providing you guidance about the GDX in my analysis below. And, while I maintain a strong bullish bias for 2018, the action we see in the coming weeks will tell us when we can begin to take a more immediate bullish perspective.
Anecdotal and other sentiment indications
The whipsaw continues. Most in the complex don’t know whether they are coming or going right now. One day we go up, another day we go down. And, many have become quite bearish again, with many even calling for lows below those seen in 2015.
My last article on metals, which was about whether the metals market is truly manipulated, certainly generated some heated debate. And, anyone who has an opinion about the issue usually has a very emotional perspective on the issue, which is often on display in the comment section.
But, the ones who seem to have the most vociferous reactions are the true gold bugs. In their world perspective, gold should never be down. Rather, gold should only be rising, so any drop in the gold price can only be due to manipulation. And, no matter how much evidence you present to them that they are being manipulated to maintain their beliefs more than the market is actually manipulated, they don their blinders and continue in their manipulation mantra.
The truth is that most market participants really do not understand the metals market. Many believe it is hedge against inflation. Many believe it is a hedge against market volatility. In fact, I even read an article a few weeks ago that claimed that weather will impact the price of gold. So, many seem to believe in fallacies about gold, and I have written extensively about this in the past.
But, there are few markets that are more clearly driven by market sentiment, and it is only clear to those who maintain an open mind about the metals. And, as I write this, we are at an inflection point in sentiment.
Price pattern sentiment indications and upcoming expectations
While I would absolutely love to know what the future holds with certainty, unfortunately, certainty does not exist. Well, then again, as a retired tax attorney and accountant, there is an old joke I used to really appreciate:
There are three things in life which are certain: Death, taxes, and tax reform.
But, I digress.
While many expect analysts to be clairvoyant, it is simply not the case. If an analyst is good at what they do, the greatest value they can bring to those who follow their work is to be able to identify turning points in the market. And, for those that have followed us for years, you know we have done quite well in furtherance of this goal.
So, this brings me to my point: we are now at a point where the metals CAN see a significant turn.
Rather than going into all the detail of what I am seeing across the complex, I am going to distill my perspective down to one chart – the GDX.
Article written December 14th

Once we broke below the upper support region we were keying in on back in September of 2017, I have been hyper-focused on a test of the 21 region in the GDX. This region will determine whether the market can see a much deeper pullback, or if we are just about done with the pullback, and the next major rally phase can begin.
Should we hold the 21 region in the GDX in the coming days, and see a rally back over 22.30, that is the first indication we may have a longer-term bottom in place. We would then need to move through the 23.20 level in impulsive fashion to provide further confirmation of a longer-term bottom being in place.
However, any sustained break down below 21 in the coming week or so will maintain the pressure on price to the downside, even if we bounce back up towards the 21.25-21.90 region.
In fact, a break down towards the 20 region, which bounces back towards the 21.50 region, is a short opportunity, using a stop just over the 22.30 region. As long as we remain below the 22 region on that bounce, it will likely be pointing us down to the 18.50-19.50 region first, then bounce back towards the 21 region, and then follow through down to the 17-18 region in the coming months before a long term bottom can be seen.
So, while my crystal ball is in the shop, and I am unable to tell you exactly what WILL happen in the coming weeks, I have provided you with a game plan as to how I see the potential larger moves coming in the GDX in the coming months. Just take note that we are at a major inflection point as I write this update. And, the one thing I see as a high probability right now is that we are about to see some larger degree moves starting in the coming week or two, and the 21-22 region will be the key to where we see a longer-term bottom in this complex, which will then set up the next major break out rally.
By Avi Gilburt, ElliottWaveTrader.net

-
I know Mike is a very solid investor and respect his opinions very much. So if he says pay attention to this or that - I will.
~ Dale G.
-
I've started managing my own investments so view Michael's site as a one-stop shop from which to get information and perspectives.
~ Dave E.
-
Michael offers easy reading, honest, common sense information that anyone can use in a practical manner.
~ der_al.
-
A sane voice in a scrambled investment world.
~ Ed R.
Inside Edge Pro Contributors

Greg Weldon

Josef Schachter

Tyler Bollhorn

Ryan Irvine

Paul Beattie

Martin Straith

Patrick Ceresna

Mark Leibovit

James Thorne

Victor Adair