
Timing & trends
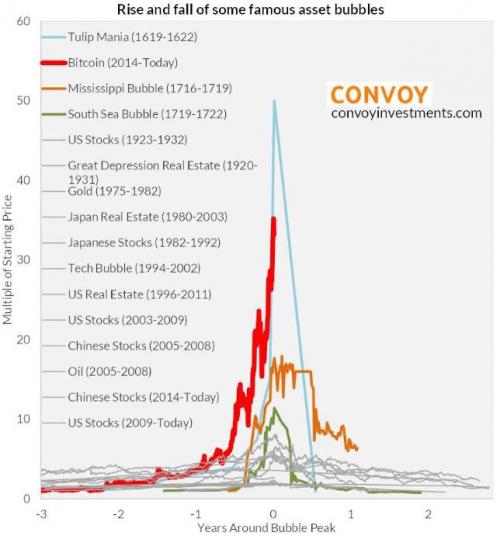
One month ago, a chart from Convoy Investments went viral for showing that among all of the world’s most famous asset bubbles, bitcoin was only lagging the infamous 17th century “Tulip Mania.”
One month later, the price of bitcoin has exploded even higher, and so it is time to refresh where in the global bubble race bitcoin now stands….
….also from ZeroHedge:
Deutsche: “We Are Almost At The Point Beyond Which There Will Be No More Bubbles”
“spiraling leverage cannot continue indefinitely. At some point, the bubble becomes too big and cannot be subsumed by a bigger bubble – the damage of its burst would become irreparable. Therefore, when that moment comes — and we believe that moment is now – the market is facing a following dilemma.”
- Permanent state of exception: We continue to operate in a regulated environment. Leverage is limited, but care is taken not to overconfine the system so we avoid the Japanese scenario. While this appears as a prudent approach to reality, it implies giving up all the ideas of unlimited growth, something that made US economy look better than the rest of the world. Compared to what we have seen before, this means settling for much less than this country is used to aspiring. Although a reasonable proposition, it is emotionally a difficult choice that is and will remain subject to substantial political manipulation. It is unlikely that populist narrative will not continue to challenge this choice [ZH: hey, one can just blame the Russians, right?]
- Flirting with high tail risk : Deregulation and deficit spending could result exactly due to abandoning the first path, as its direct challenge, under political pressure that American economy can restore its old status and resume its pace of the previous decades. This is a serious tail risk as it is playing against the backdrop of considerable overhang of the post-2008 one-side positioning. Central banks are massively short convexity in this scenario. Any inflationary maneuver, or anything that would be a bear steepener of the curve, could force disorderly unwind of the bond trade and reinforce the trend thus creating another crisis from which there could be no way out.
- Forced deleveraging: An overly hawkish Fed forces rates higher and triggers a disorderly unwind of the bond trade, thus forcing the system to deleverage. This is the policy mistake.
The Deutsche Banker’s conclusion was stark and certainly dramatic:
…..read the conclusion & the rest of the article HERE

Each quarter, Credit Bubble Bulletin’s Doug Noland posts a “flow of funds” report that analyzes the debt and securities markets data released by the Fed in its Z.1 Report. It’s always shocking to see the numbers we’re dealing with, but even more so lately as history’s biggest financial bubble starts to dwarf its predecessors.
Here’s some of the scarier data in chart form, with Noland’s commentary:
To the naked eye, percentage debt growth figures for the most part don’t appear alarming. But there’s several unusual factors to keep in mind. First, the outstanding stock of debt has grown so enormous that huge Credit expansions (such as Q3’s) don’t register as large percentage gains. Second, overall system debt growth continues to be restrained by historically low interest-rates and market yields. Debt simply is not being compounded as it would in a normal rate environment. And third, it’s a global Bubble and a large proportion of global Credit growth is occurring in China, Asia and the emerging markets. U.S. securities markets continue to be a big target of international flows.
With global Bubble Dynamics a dominant characteristic of this cycle, it’s appropriate to place Rest of World (ROW) data near the top of Flow of Funds analysis. ROW holdings of U.S. Financial Assets jumped $724 billion (nominal) during the quarter to a record $26.347 TN. This puts growth over the most recent three quarters at a staggering $2.124 TN (16% annualized). What part of these flows has been associated with ongoing rapid expansion of global central bank Credit? It’s worth recalling that ROW holdings ended 2007 at $14.705 TN and 1999 at $5.639 TN. As a percentage of GDP, ROW holdings of U.S. Financial Assets ended 1999 at 57%, 2007 at 100%, and Q3 2017 at a record 135%.
Meanwhile, the Fed’s Domestic Financial Sectors category expanded assets SAAR $2.841 TN during Q3 to a record $95.213 TN. In nominal dollars, the Financial Sector boosted assets a notable $5.085 TN over the past three quarters, almost 8% annualized growth. Notably, the sector’s holdings of Debt Securities surged a nominal $775 billion in three quarters to a record $25.425 TN. Pension Funds were a huge buyer of Treasuries during the quarter (SAAR $1.075 TN). Over the past three quarters, the Financial Sector boosted holdings of Corporate & Foreign Bonds by nominal $427 billion to $8.026 TN. More very big numbers.
One doesn’t have to look much beyond the booming Rest of World and Domestic Financial Sector to explain ongoing over-liquefied securities markets. The numbers confirm a historic financial Bubble.
Total Equities Securities jumped $1.229 TN during the quarter to a record $43.969 TN, with a one-year gain of $5.923 TN (16.4%). Equities jumped to a record 224% of GDP, compared to 181% at the end of Q3 2007 and 202% to end 1999. Debt Securities gained $171 billion during Q3 to a record $42.385 TN, with a one-year gain of $1.080 TN. At 217% of GDP, Debt Securities remain just below the record 223% recorded in 2013.
This puts Total (Debt & Equities) Securities up $1.400 TN during the quarter to a record $86.080 TN. Total Securities inflated $7.003 TN, or 9.1%, over the past year. Total Securities experienced cycle tops of $55.261 TN during Q3 2007 and $36.017 TN to end March 2000. Total Securities ended Q3 2017 at a record 441% of GDP. This outshines the previous cycle peaks of 379% for Q3 2007 and 359% at Q1 2000. One more way to look at post-crisis securities market inflation: Total Securities ended Q3 $30.819 TN, or 56%, higher than the previous cycle peak in Q3 2007.
There’s no doubt that financial sector leveraging and foreign flows (especially through the purchase of U.S. securities) continue to play an integral role in the U.S. Bubble. Inflating asset prices and resulting bubbling U.S. Household Net Worth are instrumental in fueling the overall U.S. Bubble Economy.
As we think ahead to 2018, the question becomes how vulnerable U.S. securities markets are to waning QE and reduced central bank Credit expansion. Inflating a Bubble creates vulnerability to any slowdown in underlying Credit and attendant financial flows. And it’s the final parabolic speculative blow-off that seals a Bubble’s fate. It ensures market dependency to unusually large and inevitably unsustainable flows. The Fed’s latest Z.1 report does a nice job of illuminating the historic scope of the U.S. securities Bubble. U.S. securities markets have been on the receiving end of extraordinary international flows, while inflating securities and asset prices have spurred rapid financial sector expansion.


Note that in the two “% of GDP” charts today’s numbers are compared to the previous two bubble peaks when things had gotten so far out of hand that the following year saw massive financial crises. So the fact that we’ve blown through those two previous records portends interesting times ahead.
To sum up Noland’s analysis, the US, along with the rest of the world, has entered full Ponzi, where credit has to continue to rise at unprecedented rates to keep the system from imploding. But the more credit we take on, the more fragile the system becomes. A sudden decline in equities or bonds, geopolitical tensions escalating, cryptocurrencies threatening fiat currencies, you name it, can crack the façade of normality that rising asset prices create.
 1. Jack Crooks: Gold quiet period about to end?
“Major U.S. stock indexes have been historically quiet this year. Now, that inactivity has spreadto the precious metals market. Gold stayed in a $34.50 trading range in November, the lowest gap between its high and low in any month since October 2005, according to the Journal’s Market Data Group.”
We believe this low volatility period is about to change for the shiny metal.
2. Technically Speaking: This Is Nuts
Since the election, markets have accelerated the pace of the advance. The advance has had two main story lines to support the bullish narrative.
3. The Unprecedented Moneymaking Potential of This New Technical Pattern
While everyone’s been talking about the Dow’s third major milestone this year – breaking the 24,000 mark – I’m focusing on something else…
You see, there’s a new technical pattern forming in a couple of department store stocks. If it’s true and you catch it at the right time, you can make a lot of money.

Todd Market Forecast for Friday December 8, 2017
Available Mon- Friday after 3:00 Pacific.
DOW + 118 on 499 net advances
NASDAQ COMP + 27 on 330 net advances
SHORT TERM TREND Bullish
INTERMEDIATE TERM Bullish
STOCKS : The market was greeted with a better than expected non farm payroll number and the result was a rally. In the old days, you might have seen a drop on a good report because it was feared that the Fed might be more tempted to raise rates
But, this Fed is fairly dovish and doesn’t like to surprise the financial markets. Right now a quarter point increase is anticipated at the FOMC meeting next Wednesday and this is pretty much baked into the cake.
Traders are back on board after getting sucker punched by ABC’s Brian Ross who was suspended for bad reporting. You may recall it was his false story that caused a 350 point decline and stopped us out of a good position. I hope some of you will send him a letter. I know I am.
GOLD: Gold was down another $3. Yesterday I semi joked that the bitcoin rage had robbed it of its speculators, but today several people were echoing that theme. Are they reading my letter without paying for it?
CHART: The S&P 500 made another all time closing high on Friday and there is nothing more bullish than an uptrending market. We also like the fact that the advance decline line confirmed the action by also making an all time high. Breadth normally deteriorates before a top of any significance.

BOTTOM LINE: (Trading)
Our intermediate term system is on a buy.
System 7 We are in cash. We bought the SSO at 107.07. Stay with it on Monday.
System 8 We are in cash. Stay there for now.
System 9 We are in cash.
NEWS AND FUNDAMENTALS: The non farm payrolls added 228,000 jobs. The expectation was for 190,000. Consumer sentiment came in at 96.8, lower than last month’s 98.5. On Monday we get job openings (JOLTS).
INTERESTING STUFF: Any man can make mistakes, but only an idiot persists in his error.—- Marcus Tullius Cicero— 106 BC to 46 BC.
TORONTO EXCHANGE: Toronto jumped another 80.
BONDS: Bonds had a minor bounce.
THE REST: The dollar is surging. Crude oil moved higher.
Bonds –Bearish as of Dec, 7.
U.S. dollar – Bullish as of Nov. 28
Euro — Bullish as of October 10.
Gold —-Bearish as of November 29.
Silver—- Bearish as of November 29.
Crude oil —-Bearish as of Nov. 27.
Toronto Stock Exchange—- Bullish as of September 20, 2017.
We are on a long term buy signal for the markets of the U.S., Canada, Britain, Germany and France.

Monetary conditions (+2 means the Fed is actively dropping rates; +1 means a bias toward easing. 0 means neutral, -1 means a bias toward tightening, -2 means actively raising rates). RSI (30 or below is oversold, 80 or above is overbought). McClellan Oscillator ( minus 100 is oversold. Plus 100 is overbought). Composite Gauge (5 or below is negative, 13 or above is positive). Composite Gauge five day m.a. (8.0 or below is overbought. 13.0 or above is oversold). CBOE Put Call Ratio ( .80 or below is a negative. 1.00 or above is a positive). Volatility Index, VIX (low teens bearish, high twenties bullish), VIX % single day change. + 5 or greater bullish. -5 or less, bearish. VIX % change 5 day m.a. +3.0 or above bullish, -3.0 or below, bearish. Advances minus declines three day m.a.( +500 is bearish. – 500 is bullish). Supply Demand 5 day m.a. (.45 or below is a positive. .80 or above is a negative). Trading Index (TRIN) 1.40 or above bullish. No level for bearish.
No guarantees are made. Traders can and do lose money. The publisher may take positions in recommended securities.
No, Make That Something “Historical” Is Happening
Last year we told you the 5000 year bottom in interest rates was in.
And that meant the 35 year bull market in bonds was over.
Bitcoin Trust was a top recommendation at last year’s World Outlook Financial Conference. Why? Because confidence in government and paper currencies is falling
Since March, 2009 we’ve predicted massive new highs in the Dow Jones. Guess what? It’s not over. Most don’t know why.
The pension crisis has just started and will become obvious in 2018
I’m sure you’re busy. I certainly am given all that’s happening in the economy and markets but what’s going on is so incredible that it merits my time in bringing it to your attention. From Volvo’s contract to deliver 24,000 self driving cars to Uber in 12 months – to the mindblowing rise in Bitcoin. And then there’s the 50 year low in US oil imports while production hits record highs. (Message to the Middle East – the US doesn’t need you anymore.)
Last year Donald Trump’s victory was just one more sign of the kind of historical changes we’ve predicted at the World Outlook Financial Conference and on Moneytalks since 2009. Everything’s on schedule – lots of money is to be made and lost.
What’s Coming
My bet is that we are on the cusp of the next stage of the world’s monetary crisis – and we all better be ready. This is not for the faint of heart. What’s about to happen is going to make the last five years seem tame. (Let that sink in for a moment.)
My goal is to make sure you’re protected and profit financially. Unfortunately the vast majority of people won’t be. In 2018, the pension problems at the city and state level are going to be more obvious. Consider that Illinois’ pension liability is now 280% of its entire annual tax revenues. Teachers in Kentucky are demanding each Kentucky household pay $3,200 for each of the next two years in order to top up their pension plan. (Good luck with that). This is not going to end well.
Neither are the banking problems in European and they, in turn, will exacerbate the strains on the European Union. Catalonia’s independence movement, the election last Sunday in Corsica of anti-EU advocate, Gilles Simeoni, the election in the Czech Republic of Eurosceptic Andrej Babis, and the vote in late October of two of Italy’s wealthiest regions, Lombardy and Veneto, to separate illustrate the problem.
As we’ve been predicting on Moneytalks since 2010, the European Union will come apart and the financial repercussions are huge – including a major boost to the US stock market. We’ve been saying that playing the euro to go down (first recommended at 1.54 to the dollar, now 1.17) was a fundamental long term position – hence it was to be sold on any rally.
The euro recommendation illustrates the approach we take at the World Outlook Financial Conference and on Moneytalks. You start by getting the big picture right and then devise strategies to take advantage of it.
And our record at the World Outlook speaks for itself.
Our #1 recommendation since October, 2012 has been to put between 30% and 50% of your money into the US dollar. At the same time we recommended quality dividend paying US stocks, real estate in the Phoenix area and Vancouver.
We warned of the drop in commodities including gold when it was still $1800.
At the Conference in early 2014 our energy analyst, Josef Schachter warned when oil was well over $100 that it was about to decline to the $32-$34 level. In what was a first anywhere, Mark Liebovit recommended the marijuana industry.
While that was a great call, Mark surpasses that last year with one of his top recommendations, Bitcoin Trust – now up 1500% – (obviously that doesn’t happen very often.)
My Point
Maybe we’ve been lucky that every year our specific recommendations have paid for the price of a ticket several times over. To that end, Keystone’s Ryan Irvine will be back to present his 2018 World Outlook Small Cap Portfolio. While past performance is not a guarantee of future results, it is impressive that the Outlook Small Cap portfolio has achieved double digit returns every single year. We’ll talk the loonie, gold and the markets with Martin Armstrong and James Thorne, real estate opportunities with Vision Capital’s Jeff Olin, and the marijuana industry with Mark Leibovit.
And after years of trying, I’m really excited to say that I finally got BT Global’s terrific stock picker, Paul Beattie to agree to speak.
No Surprise
As you probably guessed, I want you to come to the 2018 World Outlook Financial Conference. Why? Because we’re living in a time of historical change and people who don’t understand what’s going on are going to get killed financially. Of course a lot of people already are but conference attendees who followed our recommendations into the US dollar, US stocks, real estate in Vancouver, Phoenix and Victoria, and have bought the World Outlook Small Cap Portfolio have done well.
I understand that not everyone is interested in their personal finances – and I respect that. (Heck, I’ve got friends who I have to force to come because it conflicts with something on tv.) Maybe you’re already are on top of things. May you have other things on the go.
All I’m saying is that periods of historic change provide incredible opportunities and incredible danger. Simply put, at the World Outlook Conference our goal is to help you avoid the danger part and take advantage of the opportunities.
I hope to see you there.
Sincerely
Mike
PS – The 2018 World Outlook Financial Conference is Friday night Feb 2nd and Saturday, Feb 3rd at the Westin Bayshore. For tickets and other details go to www.moneytalks.net and click on the EVENTS button.
PPS As you probably know I’m big on educating our younger generation – goodness knows I go on about it enough. To that end we have a special offer – if you buy a ticket – you can bring a student or some other young person in your life, absolutely free. The only thing is that we ask you to let us know that you want a student ticket when you purchase your ticket. We have a limited number set aside and we want to be able to accommodate you.
![]()

-
I know Mike is a very solid investor and respect his opinions very much. So if he says pay attention to this or that - I will.
~ Dale G.
-
I've started managing my own investments so view Michael's site as a one-stop shop from which to get information and perspectives.
~ Dave E.
-
Michael offers easy reading, honest, common sense information that anyone can use in a practical manner.
~ der_al.
-
A sane voice in a scrambled investment world.
~ Ed R.
Inside Edge Pro Contributors

Greg Weldon

Josef Schachter

Tyler Bollhorn

Ryan Irvine

Paul Beattie

Martin Straith

Patrick Ceresna

Mark Leibovit

James Thorne

Victor Adair