
Timing & trends

We’ve been persistently bearish on precious metals since September and that has annoyed our readers. The weak price action, negative divergences and bearish fundamentals are too much to currently overcome for the time being. The gold stocks finally cracked this week and have lost another 7%-8% in only the past seven trading sessions. Silver and Gold denominated in foreign currencies have joined the breakdown. Gold meanwhile has not broken down yet but all indications are that it will soon.
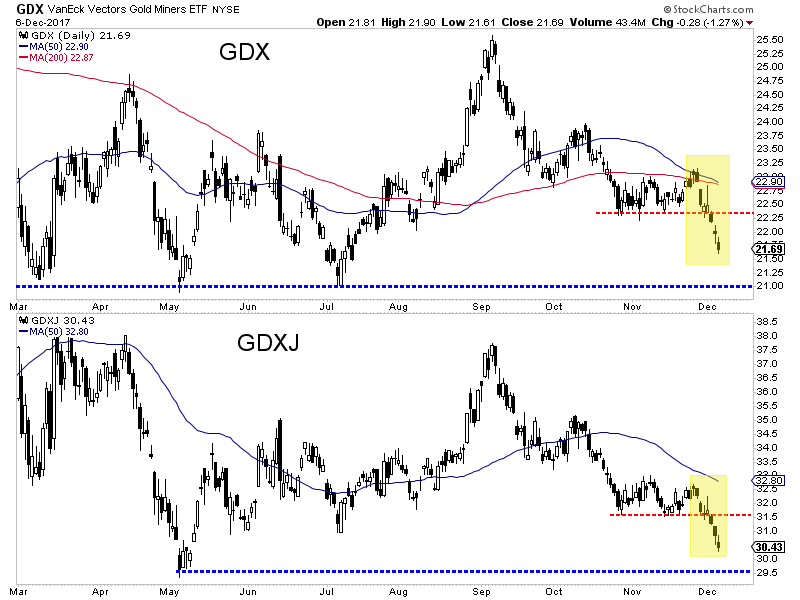
The chart below shows the daily candle charts for GDX and GDXJ which began their breakdown on Monday. They have declined sharply over the past seven trading days and are due for a bounce. A ~3% decline would take both GDX and GDXJ down to key support at GDX $21.00 and GDXJ $29.50. The miners are getting oversold and a bounce could begin from those levels.
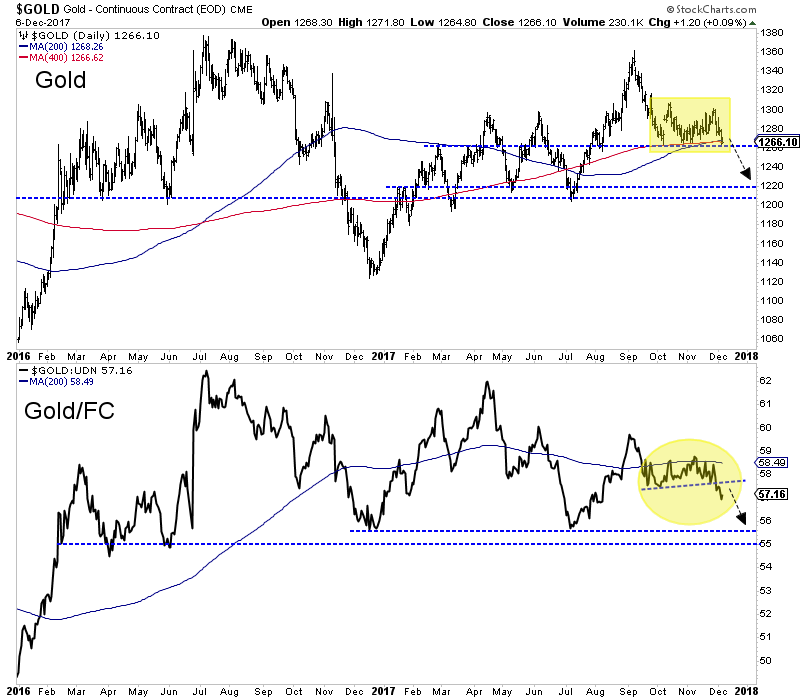
Unlike the rest of the sector, Gold has yet to crack as it maintains $1260/oz. As we can see below, Gold/FC lost support and traded down to a 4-month low. This, after Gold/FC tested its 200-day moving average seven times. Gold has held above a confluence of major support that includes lateral support and the 200-day and 400-day moving averages. All indications are that Gold will break below $1260 and if it does, look for support at $1205-$1220.
The 30,000 foot, bird’s eye view for miners remains encouraging but they need first to get through the next several months. Initial support levels (for GDX and GDXJ) are $21.00 and $29.50 while future support levels (perhaps in Q1 2018) are around the December 2016 lows. Generally speaking, I’d much rather be a buyer around those levels and not current levels.
As we publish this article, Gold has broken below $1260/oz and the gold stocks have moved quite close to the initial support levels. I would not be surprised to see the gold stocks and Silver begin to bounce as Gold moves closer to strong support at $1220/oz. That being said, we are not expecting to turn bullish on the sector as a whole until sentiment worsens and the gold stocks approach strong support at their December 2016 lows. Values are starting to emerge in the juniors but it may be too early to be bullish. In the meantime, the key for traders and investors is to find the oversold companies with strong fundamentals with value and catalysts that will drive buying.
Jordan Roy-Byrne – The Daily Gold

 When you read the title of this article, I am sure you assumed this article would be all about the latest event of fake news which supposedly rocked the market this past Friday. Well, I am sorry to disappoint you.
You see, many investors have been following fake news for much longer than you realize. Well, more accurately, the news has been real, but the expectations held by analysts and investors has been fake.
As I have been presenting for quite some time now, we have seen many expectations of negative reactions to news being presented by analysts over the last two years. They have pointed to news events like Brexit, Frexit, terrorist attacks, rise in interest rates, cessation of QE, the Trump election, and many other reasons as to why the stock market will start heading south in a big way. So, while they have all pointed to real news events, their expectations have been fake.
So, maybe its time to consider that fake news and fake expectations have potentially been hurting investors these last few years!?
And, rather than maintaining fake expectations about how the next news event is going to “cause” a move in the market, at some point, investors may have to accept that the substance of these news events do not cause anything. Rather, it is the investor reaction to the news events which cause movements in the market. And, investor reactions are driven by investor sentiment.
When investor sentiment is positive, seemingly negative news events are discounted (terrorist attacks, North Korea, rising interest rates, cessation of QE, etc.) as the market continues on its northern trajectory. However, as the market completes its natural path of progression, we reach a point at which it is time we can begin to expect that investor sentiment has reached a pinnacle, and will likely turn south for a time.
If you are being an honest observer of the stock market for these last two years, then you can admit that this is the simplest and most accurate explanation for what you have seen with your own eyes. There is no other reasonable explanation as to why the market has shrugged off news that most have expected to not only stop the market in its tracks, but also potentially cause a huge sell off in the market.
Now, the question you must ask yourself is if you have the tools to be able to identify when investor sentiment is positive, when it is negative, and when we are approaching a potential turn in sentiment?
Price pattern sentiment indications and upcoming expectations
Everything I have written above should force you to think critically whenever you chose to read analysis being published about the market. And, even the analysis I present is often misread.
Recently, I have seen a number of people quote me as saying that I expected the stock market to certainly top at 2611SPX.
It is certainly true that, back in 2015 and early 2016, I was looking for the SPX to rally from the 1800 region to an ideal target of 2537-2611. But, it did not mean that the market was certainly going to top at 2611. Rather, this was a standard target region which my analysis pointed towards for this rally, and one which we set two years ago, well before this rally even began. And, it meant I was expecting a 40%+ rally in the SPX, while many others at the time were expecting a stock market crash. Now, since we have exceeded the upper end of the target region I set two years ago by 2%, it certainly suggests to me that the market is quite stretched up here, and I am turning much more cautious on the macro scale.
However, for those that have read my analysis since early November, you would know that I was clearly noting that the IWM was setting up for a strong rally. Moreover, I stated quite clearly that we could not see a potential market top until the IWM completed this last segment of its rally. While I was unsure as to whether the SPX would be able to rally alongside and in lockstep with the IWM, I certainly was not expecting a top in the overall equity market until the IWM completed the rally I expected off the mid-November lows.
So, ultimately, when one market presents an unclear picture to me, I try to look at the other charts within the market to see if a clearer picture is presented. This time, while the SPX was not terribly clear to me, the IWM was certainly telling me to not get too bearish too soon, as it still was pointing to further rally potential for the market. Yet, it also suggested that, once we completed that segment of the rally in the IWM, we were likely approaching a larger degree top.
This past week, the SPX played a little catch up to the IWM, but certainly lagged the IWM by almost half in terms of percentage moves since the mid-November lows, with the IWM rallying approximately 7% since its mid-November lows, and the SPX bringing up the rear with almost 4%. So, while I was unsure if the SPX would provide us with a rally, I think it should be quite evident that moving over to the IWM was the prudent move for investors since mid-November.
And, until the IWM is able to break back below the low we struck on Friday, I still think there can be further highs to which the IWM can push in the coming week or two. So, while I am getting much more cautious in the equity market, I am not quite yet bearish.
Remember, the larger picture suggests that the SPX will likely see levels exceeding the 3000 region in the coming years before a major bear market takes hold. Yet, I am expecting a sizeable pullback to begin once the IWM completes this rally phase.
See charts illustrating the wave counts on IWM and S&P 500.
Avi Gilburt is a widely followed Elliott Wave technical analyst and author of ElliottWaveTrader.net (www.elliottwavetrader.net), a live Trading Room featuring his intraday market analysis (including emini S&P 500, metals, oil, USD & VXX), interactive member-analyst forum, and detailed library of Elliott Wave education.


One of the most compelling and engaging presenters at the Precious Metals Summit in London last month was Ronald-Peter Stöferle, a managing partner at Liechtenstein-based asset management company Incrementum. Incrementum, as you may know, is responsible for publishing the annually-updated, widely-read “In Gold We Trust” report,which I’ve cited a number of times before.
During his presentation, Stöferle shared the fact that his wife prefers to do her Christmas decoration shopping in January. When he asked her why she did this—Christmas should be the last thing on anyone’s mind in January—she explained that everything is half-off. A bargain’s a bargain, after all.
This is very smart. Here we are several days before Christmas, and demand for ornaments, lights and other decorations is red-hot, so be prepared to pay premium prices if you’re doing your shopping now. But mere hours after the Christmas presents have been unwrapped and Uncle Hank has fallen asleep on the couch with a glass of boozy eggnog, stores will begin slashing prices to get rid of inventory.
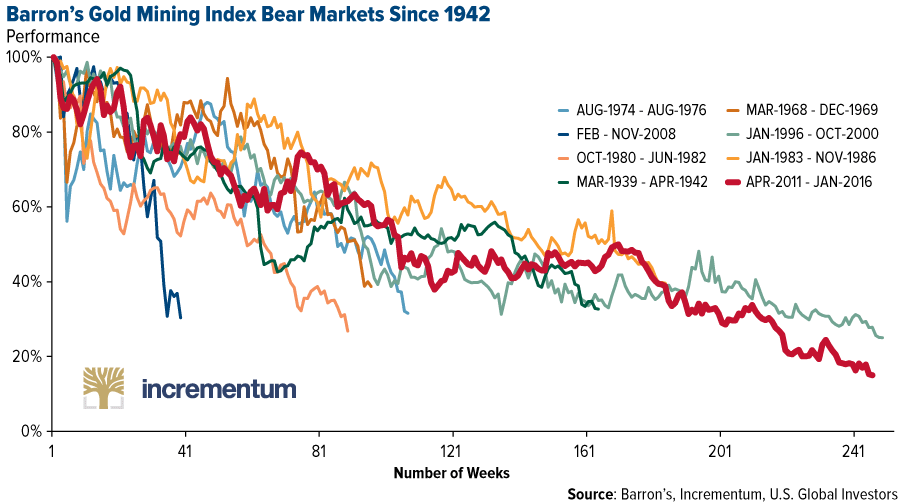
Gold bullion and mining stocks are currently in the “January” phase, so to speak, according to Stöferle. The Barron’s Gold Mining Index, which goes all the way back to 1938, recently underwent its longest bear market ever, between April 2011 and January 2016. And as I already shared with you, the World Gold Council (WGC) reported last month that gold demand fell to an eight-year low in the third quarter.
“Most people get interested in stocks when everyone else is,” Warren Buffett famously said. “The time to get interested is when no one else is.”
The same logic applies to Christmas decorations, gold and mining stocks.
Gold on Track for Its Best Year Since 2010
As of my writing this, gold is trading around $1,280, up 11 percent in 2017. That’s off 5 percent from its 52-week high of $1,351 set in September. If it stays at its present level until the end of the year, the metal will end up logging its best year since 2010, when it returned 30 percent.
 |
Gold traded up on Friday as the U.S. dollar weakened following news that former National Security Advisor Mike Flynn pleaded guilty to lying to the FBI about conversations he had with Russian officials last December during the presidential transition. It’s possible that the details Flynn might provide as part of a plea bargain could help special prosecutor Robert Mueller advance his investigation into Russia’s meddling in the 2016 election.
But back to gold. Considering it’s faced a number of strong headwinds this year—a phenomenal equities bull run that’s drawn investors’ attention away from “safe haven” assets, lukewarm inflation and anticipation of additional rate hikes, among others—I would describe its performance in 2017 as highly respectable.
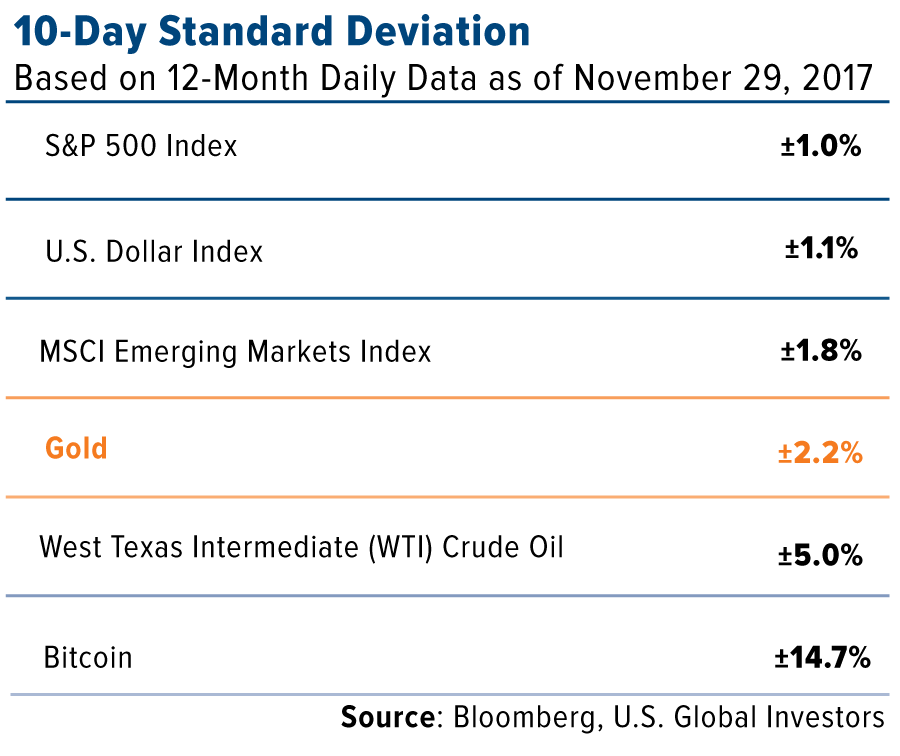
And yet if you listen to the mainstream financial news media, gold is “boring” and “flat.” Speaking to CNBC last week, Vertical Research partner Michael Dudas called the gold market “eerily quiet.”
|
Dudas was specifically describing gold’s volatility, but even here the facts tell a slightly different story. In the table to the right, you can see the 10-day standard deviation for a variety of assets, using data from the past 12 months. Gold traded with higher volatility than domestic equities, the U.S. dollar and global emerging markets. Of those measured, only oil and bitcoin showed higher volatility.
Based on volatility alone, it’s stocks that look pretty “boring” and “quiet” this year, but you’re not likely to hear a pundit or analyst describe them that way.
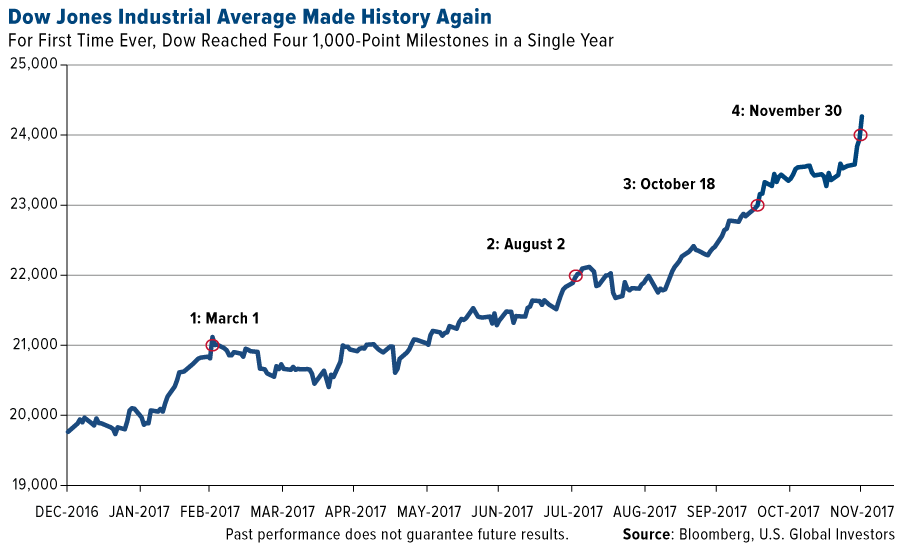
And with good reason. The S&P 500 hasn’t fallen more than 3 percent from a previous high for more than 388 days now, the longest stretch ever for the index. And for the first time in its 120-year history, the Dow Jones Industrial Average has reached four 1,000-point milestones in a single year—with a whole month left to go. It’s possible that excitement over the Senate’s tax bill will be enough to push the Dow above 25,000 sometime before the ball drops in Times Square. The drama involving Flynn, however, could threaten to derail those chances.
What this means is that, compared to domestic equities, gold is highly undervalued right now. The gold-to-S&P 500 ratio, a time-tested trading indicator, is near 50-year lows. I see this as a strong buy signal, especially now as we await the Federal Reserve’s decision to lift rates this month. If you recall, gold broke out strongly following the December rate hikes in 2015 and 2016.
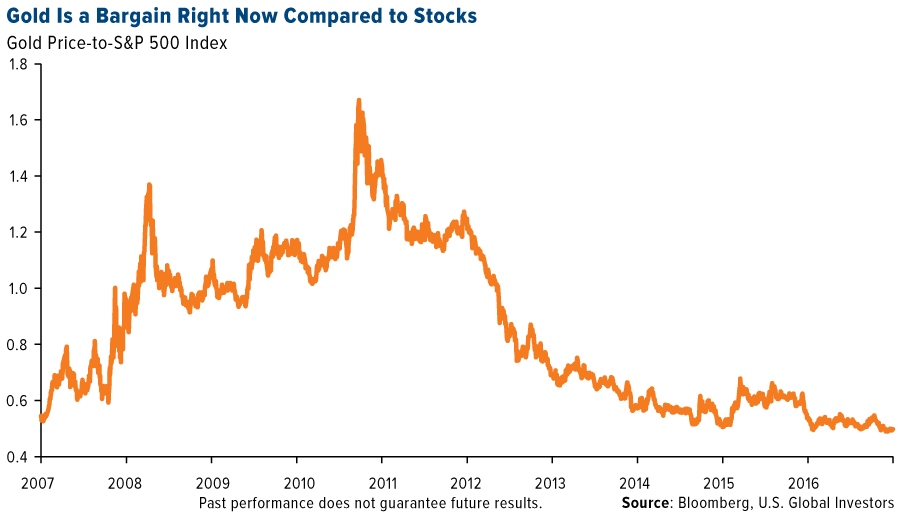
In his December outlook on precious metals, Bloomberg Intelligence commodity strategist Mike McGlone writes that “gold is ripe to escape its cage soon,” adding that “prices just don’t get as compressed as they did for gold in November, indicating a breakout soon.”
Is a Recession Brewing? History Says Maybe
So what are the catalysts that could trigger a breakout? Stöferle mentions two: a possible recession and stronger inflation.
“I think the odds are pretty high that a recession might be upon us sooner or later because we’re in this rate hike cycle, and as always the central banks are way behind the curve,” he said.
What Stöferle is referring to is the strong historical correlation between new U.S. rate hike cycles and recessions. Going back more than 100 years, 15 of the last 18 recessions were directly preceded by monetary tightening.
 click to enlarge
The Federal Reserve isn’t just raising rates, remember. It’s also begun to unwind its $4.5 trillion balance sheet, which was built in the years following the financial crisis. This carries historical risk. The central bank has embarked on similar reductions six times in the past—in 1921-1922, 1928-1930, 1937, 1941, 1948-1950 and 2000—and all but one episode ended in recession.
“Quantitative tightening will fail,” Stöferle predicted.
Obviously, there’s no guarantee that this particular round will have the same outcome as past cycles, but if you agree with Stöferle, it might be prudent to have as much as 10 percent of your wealth in gold bullion and gold stocks.
The Risks Surrounding Tax Reform
Inflation is a trickier thing to forecast. A lot of people, myself included, had expected the cost of living to show signs of life this year in response to some of President Trump’s more protectionist and policies. But nearly 10 months into his term, no major legislation has been passed or signed.
That might be about to change with the highly anticipated tax reform bill, which the Senate passed late Friday night. If the bill reaches Trump’s desk, it will be the first time in a generation that the U.S. has amended its tax code.
But will the $1.5 trillion bill, as it’s currently written, lead to stronger economic growth and pay for itself, as its most vehement supports insist? My hope is that it will. As I’ve been saying for a while now, it’s time we begin relying more on fiscal policies to drive growth, especially now that the Fed is beginning to tighten policy.
In the spirit of staying balanced, though, there are troubling signs and forecasts that the bill could actually end up being a disappointment. After reviewing the bill, the Joint Committee on Taxation (JCT) estimates that its enactment could lead to a whopping $1.4 trillion increase in the deficit between now and 2027. Even if we factor in economic growth that might come as a result of reforms, the JCT says, we’d still be looking at a $1 trillion shortfall.
Many economists are also skeptical. A recent University of Chicago Booth School of Business survey of economists from Yale, MIT, Princeton, Harvard and other Ivy League schools found that over half did not believe the current tax bill will “substantially” grow GDP. Only 2 percent thought it would, and more than a third were uncertain. Additionally, nearly 90 percent believed that if the bill is enacted, the U.S. debt-to-GDP ratio will be “substantially” higher a decade from now.
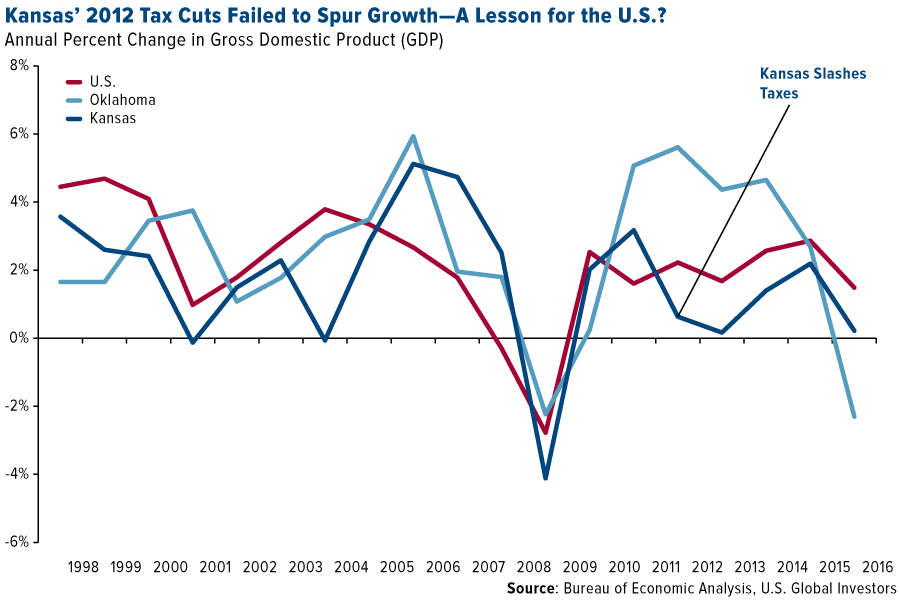
And then there’s the Kansas experiment from five years ago. In May 2012, Governor Sam Brownback signed a sweeping state tax reform bill that in many ways resembles the Senate’s current tax bill. It slashed personal and business income taxes, consolidated the state’s three tax brackets into two and eliminated a number of credits and exemptions. Hopes were high that the reforms would kickstart economic expansion, help taxpayers and attract new business to the state.
Instead, none of that happened. Following the bill’s enactment, Kansas GDP growth remained stagnant, trailing the national growth rate as well as that of neighboring states and even its own rate from years past. This year, the nonprofit financial watchdog group Truth in Accounting gave Kansas a failing financial grade of D, citing its inability to pay its debts or balance its budget.
 click to enlarge
In June of this year, Kansas’ Republican-controlled state legislature voted to raise taxes for the first time since reforms were enacted and eventually had to override Governor Brownback’s veto. Many of those state legislators who initially supported the Kansas tax cuts are now warning federal lawmakers that similar outcomes could occur on a nationwide scale.
I’m not sharing this to discredit tax reform—in fact, I’m strongly in favor of it. However, I believe it’s important to highlight the fact that nothing in life is guaranteed. Hope for the best, prepare for the worst. What steps can you take now in the event the tax reform bill doesn’t accomplish what it’s designed to do—or worse? This type of uncertainly has historically made gold shine the brightest.
Think Gold Has Fallen Short of Expectations this Year? Don’t Blame Bitcoin
At conferences I’ve attended and spoken at recently—the Silver & Gold Summit in San Francisco and Mines and Money in London among them—the suggestion has been made by a few big-name investors and money managers that bitcoin’s meteoric rise is to blame for the market’s apparent disregard for gold and gold stocks right now. With bitcoin up more than 1,050 percent since the beginning of the year, even after a 21 percent dip last Wednesday, many market-watchers might simply be too star-struck by the newness of bitcoin to be bothered by the “barbarous relic.”
I happen to think this is a mistake. As much as I believe in the value of bitcoin, gold and gold stocks still play a crucial role in the modern portfolio.
As I told Kitco News’ Daniela Cambone at the Silver & Gold Summit, bitcoin isn’t responsible for dismantling gold. Although both assets are currencies, I don’t see them at odds because they serve very different functions. For one, gold is more than money—it’s worn as jewelry, widely used in dentistry and can be found in art and even some high-end foods. It’s been traded around the world for millennia and, unlike bitcoin, does not require electricity. Indeed, it conducts electricity, which is why you can find it in your iPhone and GoPro camera’s circuitry.
 |
Bitcoin is more than money as well. It’s the most influential spokesperson, if you will, of blockchain technology, upon which the currency is built. Speaking with SmallCapPower’s Angela Harmantas at the Mines and Money conference in London, I made the comparison that bitcoin is to email as blockchain is to the internet. In the earliest days of the internet, few people truly understood what it was or could predict the implications of this new technology—but email they understood. It’s what woke people up to the idea of using the internet. Bitcoin is doing just that for blockchain.
But blockchain’s utility goes far beyond finance. As a decentralized, highly encrypted ledger, it has untold potential to change the way we run our lives, businesses and governments. Among other tasks, the technology can help manage digital rights to intellectual property, bring transparency to supply chains and reliably track the spending of public funds. It can even be used as a tamper-proof voting system, whether you’re voting for a new chairman of the board or president of the United States. One day soon, we might all be e-voting from our smartphones and tablets, reassured that our vote cannot be compromised.
All opinions expressed and data provided are subject to change without notice. Some of these opinions may not be appropriate to every investor. By clicking the link(s) above, you will be directed to a third-party website(s). U.S. Global Investors does not endorse all information supplied by this/these website(s) and is not responsible for its/their content.
Standard deviation is a measure of the dispersion of a set of data from its mean. The more spread apart the data, the higher the deviation. Standard deviation is also known as historical volatility.
The Standard & Poor’s 500, often abbreviated as the S&P 500, or just the S&P, is an American stock market index based on the market capitalizations of 500 large companies having common stock listed on the NYSE or NASDAQ. The S&P 500 index components and their weightings are determined by S&P Dow Jones Indices. The Dow Jones Industrial Average (DJIA) is a price-weighted average of 30 significant stocks traded on the New York Stock Exchange (NYSE) and the NASDAQ. The DJIA was invented by Charles Dow back in 1896. The MSCI Emerging Markets Index is an index created by Morgan Stanley Capital International (MSCI) designed to measure equity market performance in global emerging markets. The U.S. Dollar Index (USDX, DXY) is an index (or measure) of the value of the United States dollar relative to a basket of foreign currencies, often referred to as a basket of U.S.trade partners’ currencies. The Barron’s Gold Mining Index (BGMI) consists of publicly traded companies involved primarily in the mining for gold
Frank Holmes has been appointed non-executive chairman of the Board of Directors of HIVE Blockchain Technologies. Both Mr. Holmes and U.S. Global Investors own shares of HIVE, directly and indirectly.
I would no sooner invest without using charts than I would drive down a freeway at 90 miles per hour with my head in a blindfold or a brown paper bag. What would you think if the Weatherman came on the TV and instead of showing you a chart, presented you with a table of data? – or you boarded a plane with the windows shuttered and the Captain explaining “Oh – I don’t need to see out – my instruments provide me with all the information I need to fly the plane.”? Charts are about perspective and proportion, and without them you’ve got none.
By the time you are done reading this review you will, or should be if you are reasonable, be left in no doubt about the awesome money making power of charts, properly used. On clivemaund.com our investing strategy is simple, we go where the action is. Until 2011 some of the best gains were to be made in the Precious Metals space and we tracked that sector closely during its bullmarket. Then it changed and in more recent times the action has shifted to biotech, blockchain and cryptocurrencies, and marijuana, Tech generally and the FANGS etc. Because we go where the action is, that is why we are able to make the big gains you will see set out below on a regular basis. The charts presented below are color coded – blue for Oil, coral for Biotech, green for Marijuana and yellow and white for Blockchain, a sector we are just moving into. Because these charts are largely retrospective the usual indicators appended above and below them have been removed to save space and reduce clutter. Note that clicking on the company name will take you to the most relevant report on its stock on clivemaund.com where the password protection has been removed in order that you are able to open it. Now read on… Biotech & Medical StocksWe just closed a nice trade in Scythian. We spotted that a Double Bottom was forming above its rising 200-day moving average, accompanied by a positive volume pattern, so bought it on a couple of occasions as it marked out the 2nd low of the pattern. Took profits last week after it had arrived at a resistance level in an overbought state… Scythian Biosciences SCYB.V C$6.75

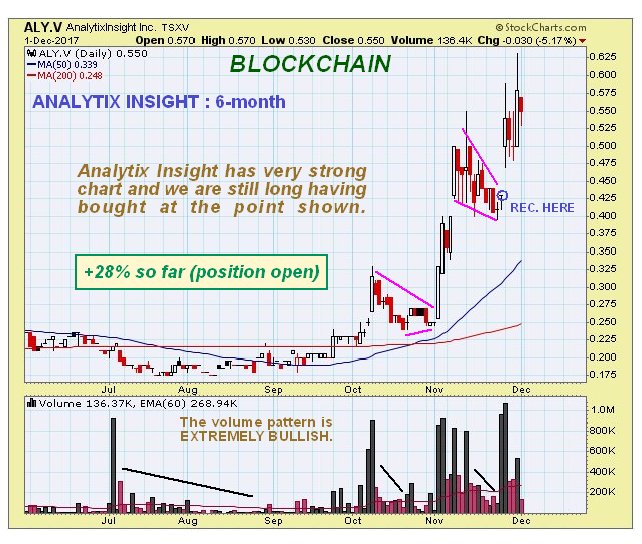
Blockchain StocksAnalytix Insight Inc ALY.V, ATIXF on OTC, C$0.55, C$0.43 Analytix has a very strong chart. We bought it about a week ago as it completed a tight bull Flag, which it then broke out of so that we are now up 28% and holding for further gains. Note the powerfully bullish volume pattern…
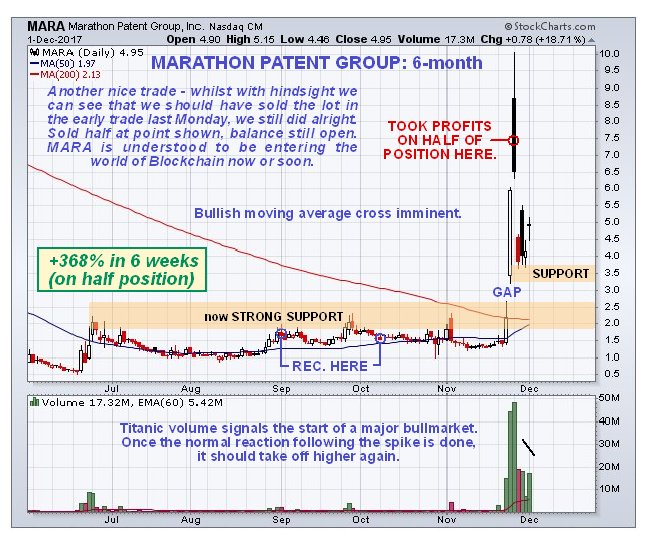
Marathon Patent MARA on NASDAQ CM, $4.95 Accumulated Marathon Patent from September through November, having observed that a Cup & Handle base was completing, accompanied by a bullish volume pattern, and that the price was converging with its falling 200-day moving average. It broke out a week or two ago and went nuts to the upside on immense volume, which was clearly a very bullish development. We sold half our position at a good price in expectation of a heavy reaction, which ensued, and held the balance for a later resumption of the advance. After we bought this stock there was a 1 for 4 reverse split, which evidently didn’t do it any harm. It is understood that, despite the name, this is now a Blockchain stock.
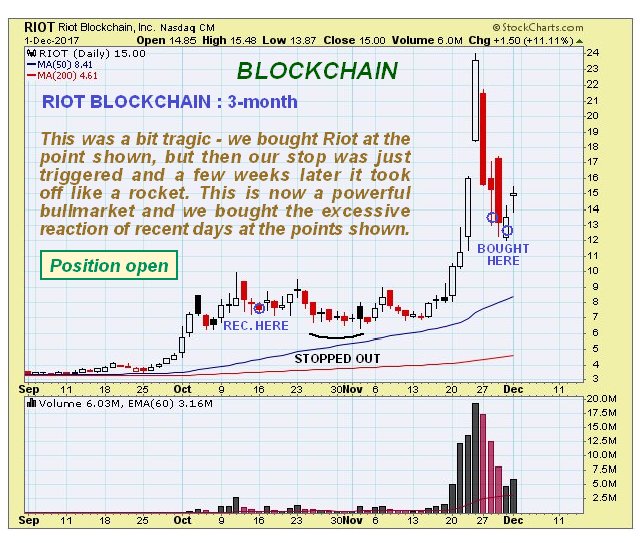
Riot Blockchain RIOT on NASDAQ CM, $15.00 We were on to Riot Blockchain as far back as October, when we bought it, but tragically we were just stopped out, because a few weeks later it broke out and took off like a rocket. Then it overreacted to the downside last week giving us a chance to jump on it at a relatively good price. Given that this stock is in one of the hottest sectors on the planet and that it is one of the few Blockchains that are publicly traded, it has the potential to do a moonshot, especially as it only has 8.32 million shares outstanding and a float of only 3.83 million.
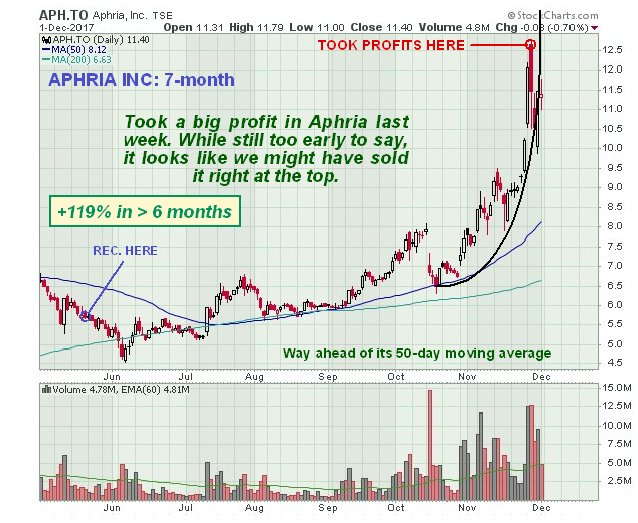
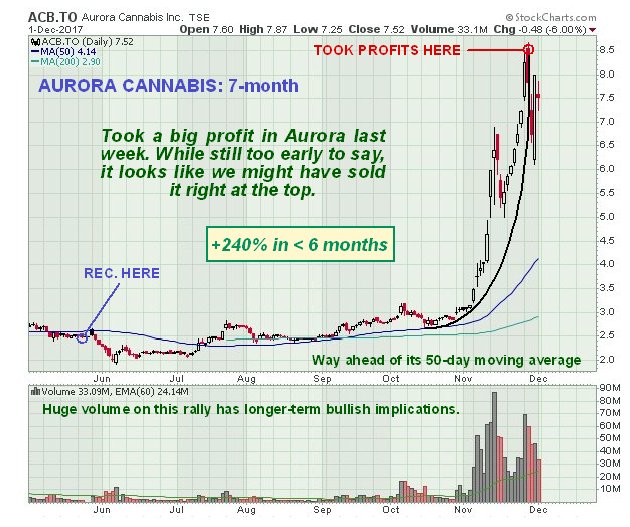
Cannabis StocksGiven the number of cannabis stocks shown below, you might be forgiven for thinking that the writer has a predisposition towards cannabis, perhaps even has an addiction problem. Not true, we went for them because they looked like they were going to appreciate, and they did. Canadian cannabis companies are the global leaders in the field, largely thanks to the moronic Federal threat to the industry south of the border, and Canada sports some of the biggest names in the industry like Aphria, Aurora Cannabis and Canopy Growth Corp, which have all done very well this year. Their growth potential (no pun intended) has not gone unnoticed by either the Alcohol and Tobacco industry or big Pharma, who are starting to circle overhead like vultures in readiness to swoop and take over these companies. This is why we went for Aphria and Aurora Cannabis over 6 months ago, which have proved to be very good investments that we sold at the peak of the recent parabolic ramp for big gains… Aphria Inc APH.TSX, APHQF on OTC, C$11.40, $8.95
Aurora Cannabis ACB.TSX, ACBFF on OTC, C$7.52, $5.92
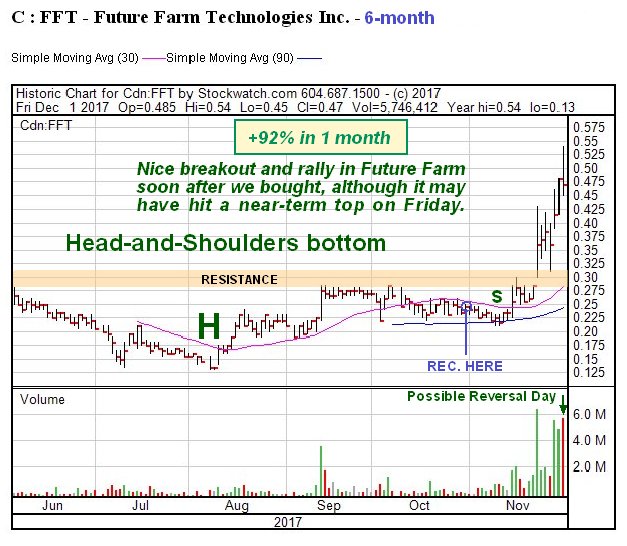
Future Farm Technologies FFT. CSX, FFRMF on OTC, C$0.47, $0.376 While Future Farm might have thought it would escape our notice tucked away out in the countryside, it didn’t, because we spotted that a Head-and Shoulders bottom was completing in it, so we went for it late in October before it broke out and are up 92%. However, a toppy candle formed in it on high volume on Friday, so it may now react back…
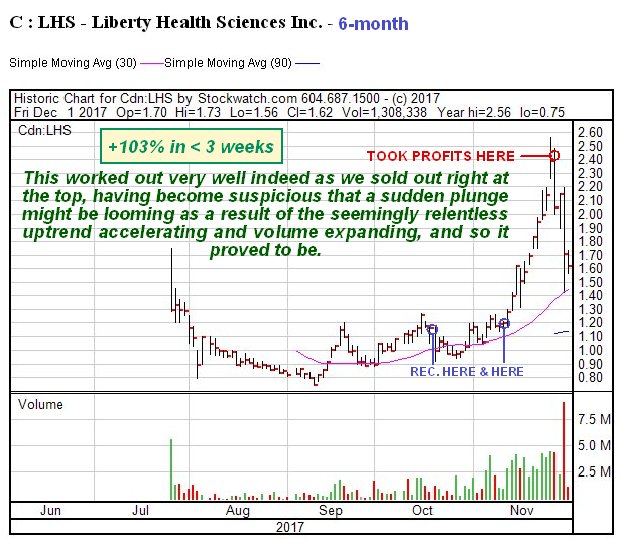
Liberty Health Sciences LHS.CSX, LHSIF on OTC, C$1.62, $1.28 It seems to be “de rigueur” these days for a company to massage its stock price higher before giving its shareholders a jolly good soaking with a funding exercise. We “smelt a rat” in the nick of time and offloaded Liberty Health for a nice profit right at the top, having grown suspicious due to an excessively orderly advance on expanding volume. This was a nice trade because it collapsed immediately after we sold it at the peak.
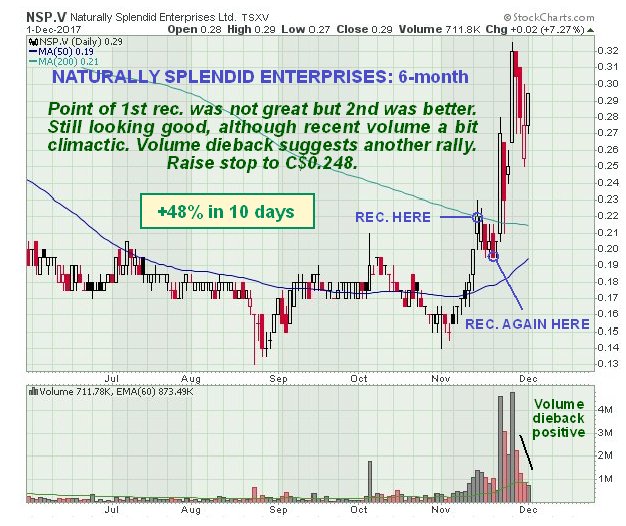
Naturally Splendid Enterprises NSP.V, NSPDF on OTC, C$0.29, $0.24 We bought Naturally Splendid at a good point, after being alerted to “something going on” by the 1st impulse wave which got turned back by the falling 200-day moving average. Volume pattern indicated it was going higher again, so we bought it during the formation of a tight bull Flag, and sure enough it took off higher gain, so that we are now up 48% on the last purchase in 10 days. This position is still open and we raise the stop to C$0.248 for a risk free trade.
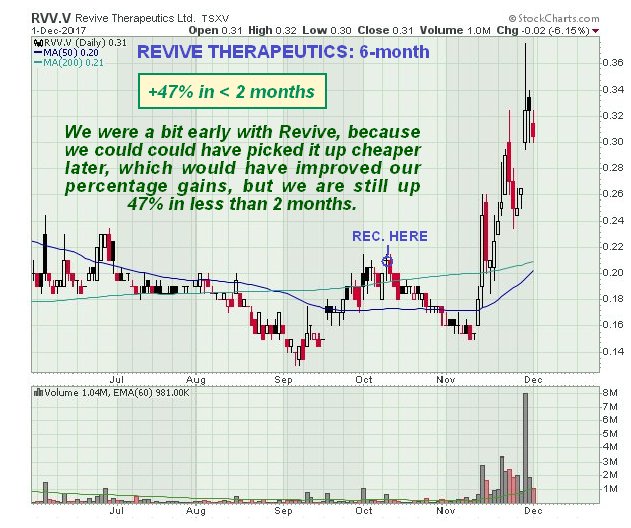
Revive Therapeutics RVV. V, RVVTF on OTC, C$0.31, $0.242 The timing of entry into this could have been better as we could have picked it up cheaper a month later, but it revived and went on to do what was expected of it with a steep advance that has resulted in us being up 47%, so it’s a case of “all’s well that ends well”, except of course, that “you shouldn’t count your chickens until they’ve hatched”, as we haven’t sold it yet.
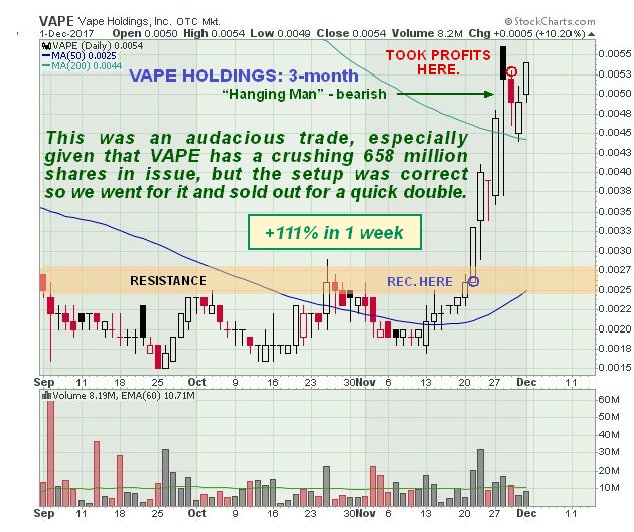
Vape Holdings VAPE on OTC, $0.0054 We worked out that Vape was ready for a sharp rally and bought it right before the rally started, and sold it last Wednesday for a quick 111% gain in less than a week. Nice work if you can get it. Be good if it reacts back so that we can perhaps give it another go.
Not all of our trades are profitable of course – there be always be a number of trades that don’t work out as expected. This is because charts indicate probabilities not certainties, and there are always uncertainties that can throw things out of kilter, just as in everyday life. You can do the same commute for decades, but each and every day you have to be ready for the unexpected, such as a child running out in from of your car. In the same way, when trading, you have to be prepared to duck and dive and roll with the punches. For example, a charismatic well connected CEO of a company may suddenly get run over by a bus, and the next trading session the stock tanks. The only people in this game who are right all the time are liars, and in fact the only way to be right all the time is to have a time machine, like Doc and Marty’s DeLorean in the Back to the Future movies, which would be very useful as you could zip forward a year, take a quick peek at the charts, zoom back and make a fortune. Whilst visiting the Universal Studios’ lot in L.A. a few years back I came across this DeLorean, seemingly abandoned, and made them an offer for it, but they refused to sell – I believe they are using it to fast forward and see which movies they are making will do well at the box office, although they would never admit it of course. Here are a couple of examples of our losing trades to balance things up… Helius Medical Technologies HSM.TSX, HSDT on OTC, C$2.86, $2.23
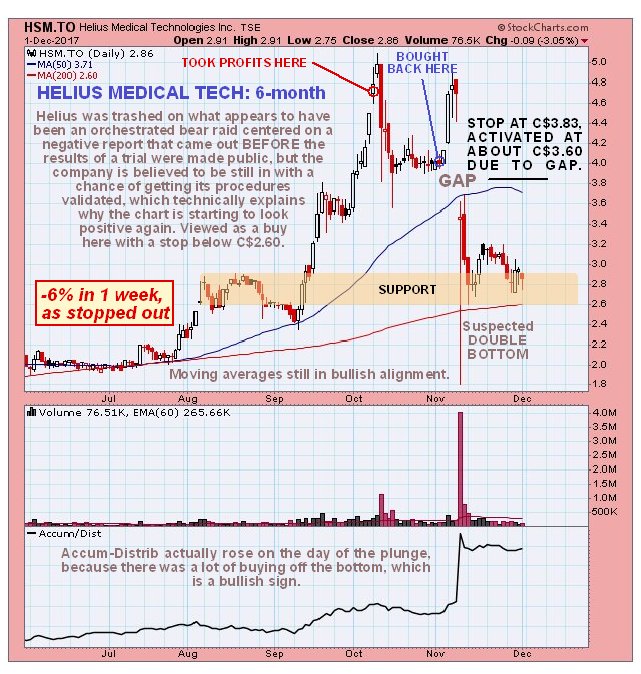
After trading Helius well for quite a while, we sold it near to the early October peak, and then bought it back at a lower price early in November. After rising again for some days it suddenly cratered, due to a broker’s report that came out before the results of an important medical trial were due to be posted, resulting in instant big losses for those long the stock, and it is thought that this was an organized bear raid where those taking part hastily covered their shorts before the results came out and the price bounced back. This theory is given added credence by the fact that the Accum line actually rose on the drop. Thus there is thought to be a fair chance that a Double Bottom is forming here, especially as the price is at important support and above its rising 200-day moving average although this is a difficult setup because there is a lesser chance that the pattern is instead a bear Flag. We were saved from much bigger losses by a stop at C$3.83, which was only activated at C$3.60 due to a large gap down. Molori Energy MOL.V, MOLOF on OTC, C$0.30, $0.25
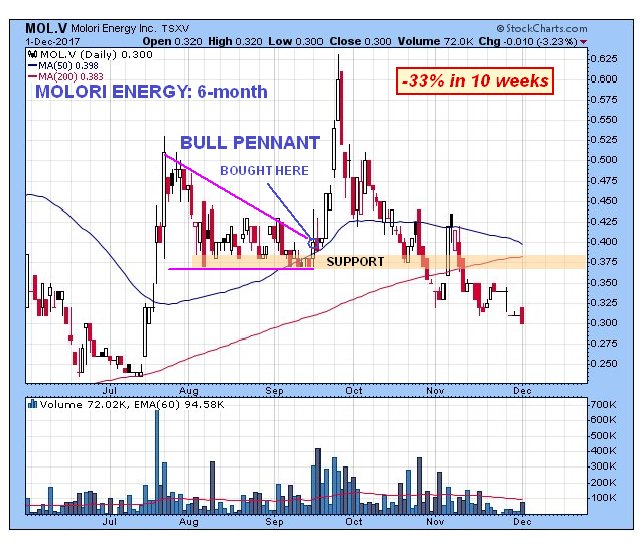
This is another stock that, after showing great promise, did an abrupt about face and ran into the sand. We bought it at the point shown, then it took off higher as expected and everything appeared to be “ship shape and Bristol fashion” but then it lost all its gains, didn’t turn up as it should have done at support and has run off into an erosive decline, leaving us with a significant loss, but it’s probably too late to ditch it now as the current light volume suggests it could turn up again. Fortunately trades like this are in the minority. Stops are a way to handle such situations, although stops can be a double-edged tool as they can frequently result in you being shaken out before a big move, such as befell us with Riot Blockchain as set out above. This is especially the case with low-priced stocks.
Oil Stocks
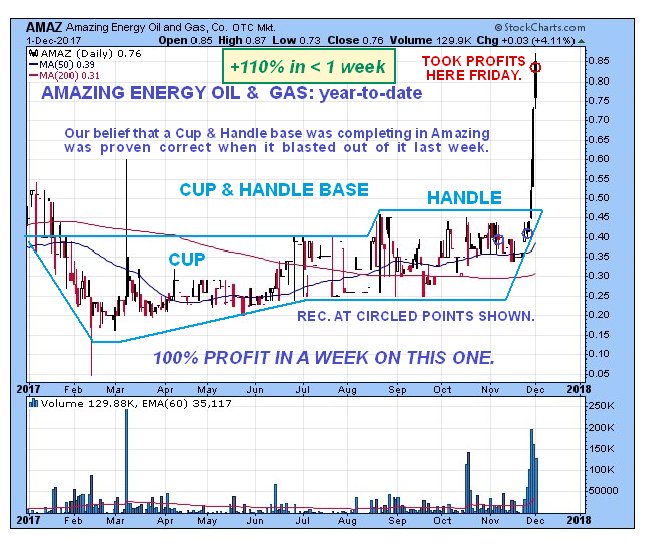
Amazing Energy Oil & Gas AMAZ on OTC, $0.76
This was an “amazing” trade, because after other investors had done the spade work all year building out an admittedly rather bizarre looking Cup & Handle base, we showed up like royalty at just the right time, the day before a sizable rally started, and grabbed a nice profit on Friday, because after becoming overbought at resistance, it looks like it might now react back or consolidate.
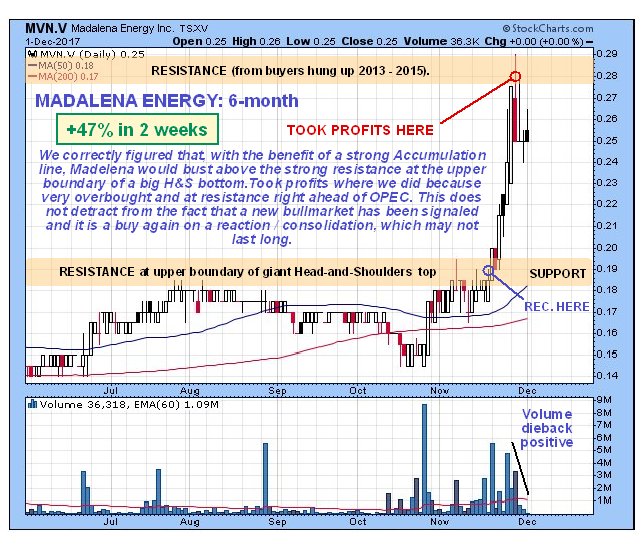
Madelena Energy MVN,V, MDLNF on OTC, C$0.25, $0.214 Here again we let other slower-witted investors do the donkey work of building out a big Head-and-Shoulders base, and then our limo rolls up to bag a quick 47% profit in 2 weeks. “Thank y’all – be seeing ya!”
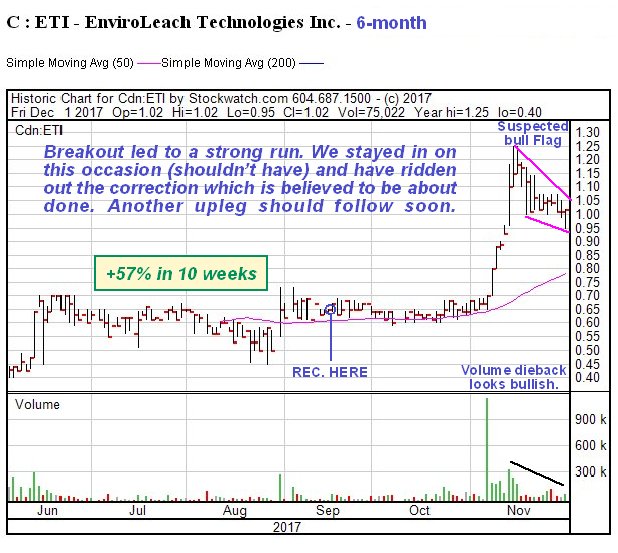
General StockEnviroleach ETI.CSX, EVLLF on OTC, C$1.02, $0.808 There’s a tremendous “Urban Mining” story behind both Enviroleach and Mineworx Technologies, that you are cordially invited to read here. We bought Enviroleach a little early back in September, but “no regrets” because early in November it broke out on big volume and rose strongly. Has reacted back on declining volume in recent weeks in what is believed to be a bull Flag. If this is what it is another upleg should begin soon.
Any of you PM buffs remember this silver call made in September 2011?…
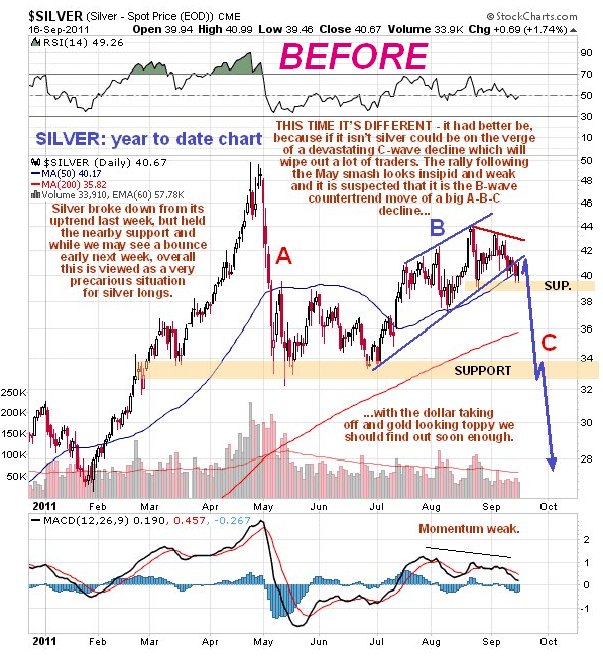
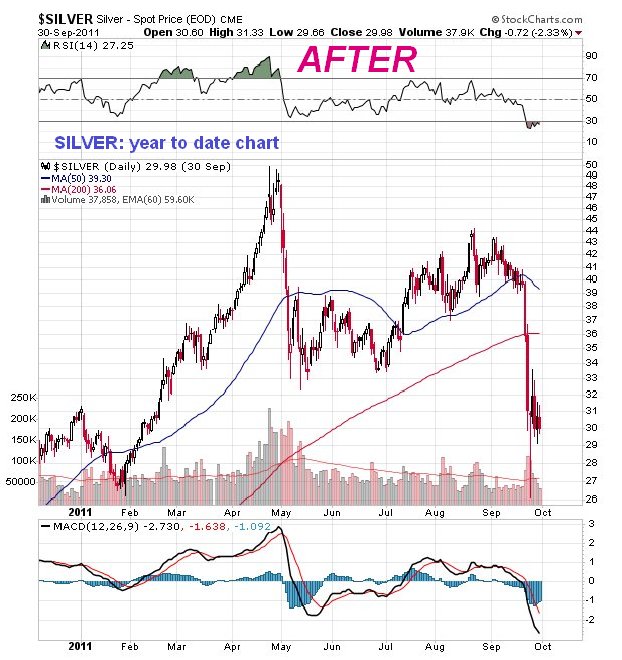
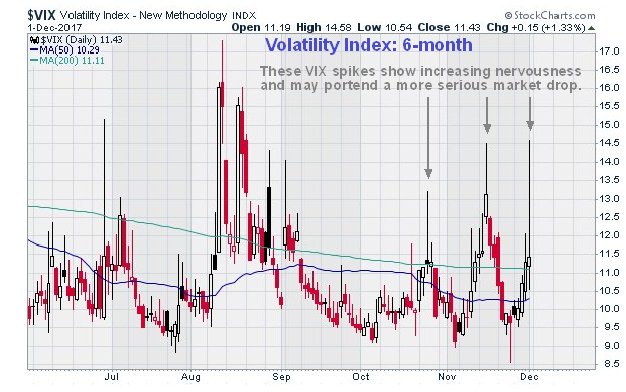
I learnt that one subscriber in California who shorted silver made enough out of this trade to buy his wife a fancy sports car, although this turned out to be a case of enlightened generosity, as guess who ended up driving it most of the time? Finally, a word about the broad US stockmarket. There was a quite dramatic drop intraday on Friday, the biggest for a long time, after which it rallied late in the day to close only a touch down on the day. This was being hailed in many quarters as a sign of its resilience, because the “buy the dip” crowd dutifully showed up as usual and saved the day, but that’s not how it looks to us. That action Friday was a sign of growing nervousness that left behind a large bearish “Hanging Man” candlestick on the chart.
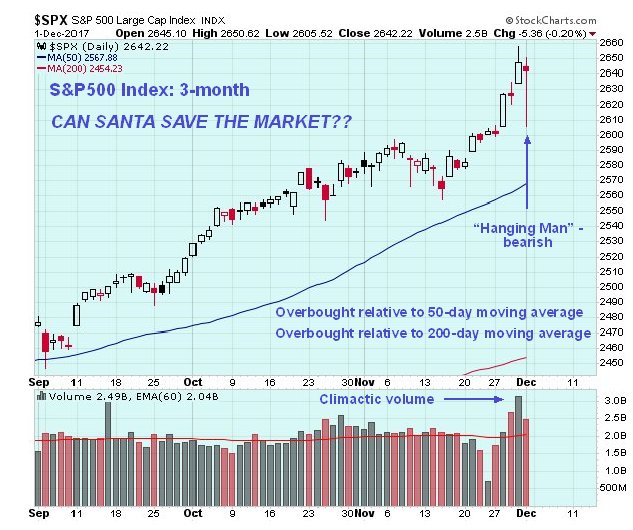
That big intraday swing also caused the third big VIX spike in as many months on Friday, also a sign of growing nervousness in the markets. While it is widely assumed that Santa will do his thing and bring good cheer to the markets as he does most years, this year he might imbibe a little too much mead or sherry and not be in a fit state to come to the markets’ rescue. It is therefore advised to pull in stops tighter than usual and perhaps do some Puts – we will be looking at some on the site. Fundamentally this might relate to the Neocons moving closer to their objective of bringing down Trump, since the markets might drop hard in the face of the crisis that would result.
The successful use of charts as demonstrated in this review depends above all on common sense, experience and a sense of proportion, in this game formal qualifications count for nothing. In this sense at least the market is a level playing field in that it doesn’t care if you are the Prince of Monaco or a taxi driver – if you get it right you win, if you don’t you lose. The reason why so many highly qualified people, especially those with PHDs, fall on their faces trading markets is that they arrive on the scene with a superiority complex and the market quickly cuts them down to size.
I have done a considerable amount of work preparing this report, so now I am going to ask you to do just a little, although I understand that this may be asking a bit much of a “Millennial”. Get a pen and do a back of the envelope calculation, or use a tablet, and ask yourself how many of these trades you would need to pull off to cover a subscription to clivemaund.com and then how many you would have to do to have a positive impact on your life. When you have done the Math, I look forward to welcoming you as a subscriber.
 1. The Fight For Free Speech
by Michael Campbell
Taxpayers pay billions every year subsidizing the University education of approximately 1.9 million mainly middle and upper class students. Which is why the dustup at Laurier University and the Federal Liberals position on Free Speech is so important to note.
2. Six Themes That Will Drive the Next Five Years
Those looking for an optimistic forecast for U.S. equities can turn to Northern Trust. Bob Browne, its chief investment officer, identified six themes that will drive the capital markets over the next five years. Taken together, they translate to 5.9% annual returns for U.S. stocks over that period, which includes 2017.
3. Seeking Value in an Expensive World
The question I’ve been fielding ever since November 8th of last year and to this day is how we are investing around Donald Trump, and the answer has not changed one iota, which is that we are not investing around Trumponomics at all.

-
I know Mike is a very solid investor and respect his opinions very much. So if he says pay attention to this or that - I will.
~ Dale G.
-
I've started managing my own investments so view Michael's site as a one-stop shop from which to get information and perspectives.
~ Dave E.
-
Michael offers easy reading, honest, common sense information that anyone can use in a practical manner.
~ der_al.
-
A sane voice in a scrambled investment world.
~ Ed R.
Inside Edge Pro Contributors

Greg Weldon

Josef Schachter

Tyler Bollhorn

Ryan Irvine

Paul Beattie

Martin Straith

Patrick Ceresna

Mark Leibovit

James Thorne

Victor Adair