
Timing & trends
- Review & Update
- Bonds Send A Signal
- Sector & Market Analysis
Review & Update
Two weeks ago, I noted:
“I have a sneaky suspicion that when I update the Fed Balance Sheet reinvestment analysis next week, shown below, we are going to find a substantial, well-timed, reinvestment by the Central Bank. Wanna bet? Well, here is the updated chart of the 4-week net change to the Fed’s balance sheet. As you can see, reinvestments have, once again, returned to the market in a very “timely” fashion. Of course, since the Fed claims they are not trying to, nor are they influenced by, the markets, this is purely coincidental. (#SarcasmAlert)”

Here is the updated chart this week as the markets broke out to new “all-time highs.” I changed the coloration to more clearly show balance sheet expansion periods more closely.
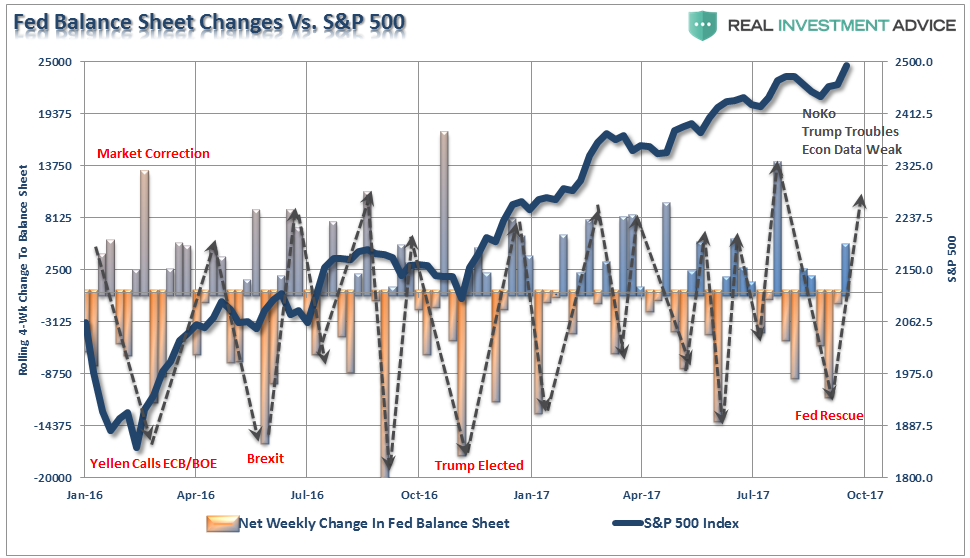
There are two things to take away from the chart.
- The current breakout of the market is likely limited given there is little room before the next down cycle in the balance sheet occurs.
- These reinvestments to “save” the markets from decline will be severely restricted IF the Federal Reserve actually proceeds with a “balance sheet reduction” program.

“That ‘gap up’ opening occurred Monday morning as ‘relief’ spread through global markets due to the reduction of geopolitical stress as the U.S. once again ‘caved’ to the threats of North Korea.”
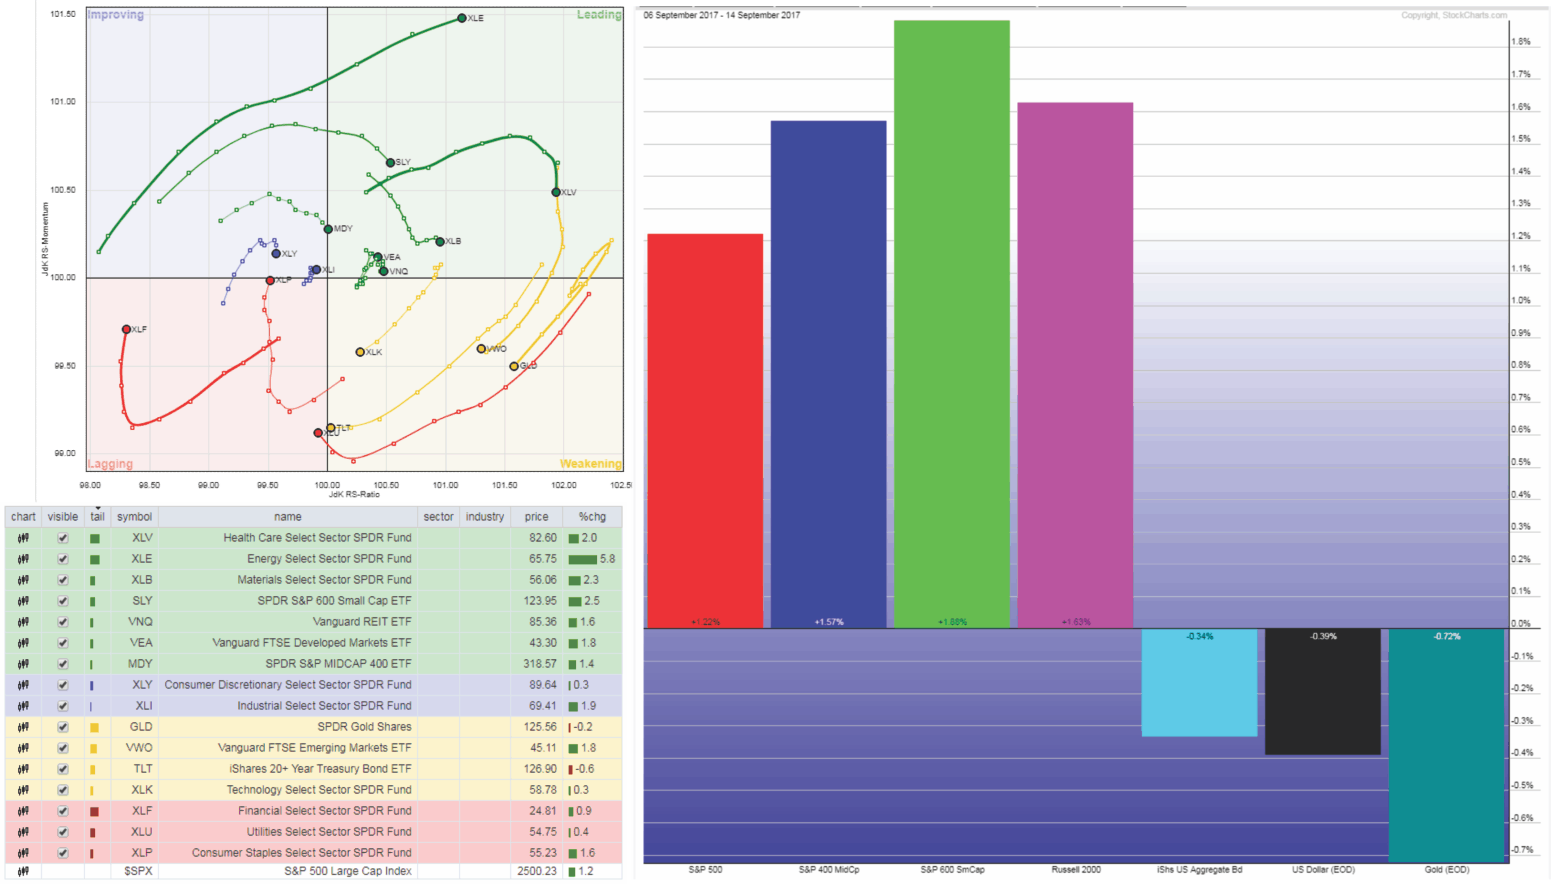
With that, and a lot of Central Bank intervention, the world breathed a sigh of relief as the previous “risk off” trade converted into a “rush for risk.” This rotation over the last 7-10 trading days out of bonds and gold back into equities can be seen in the chart below.
2500 or Bust!
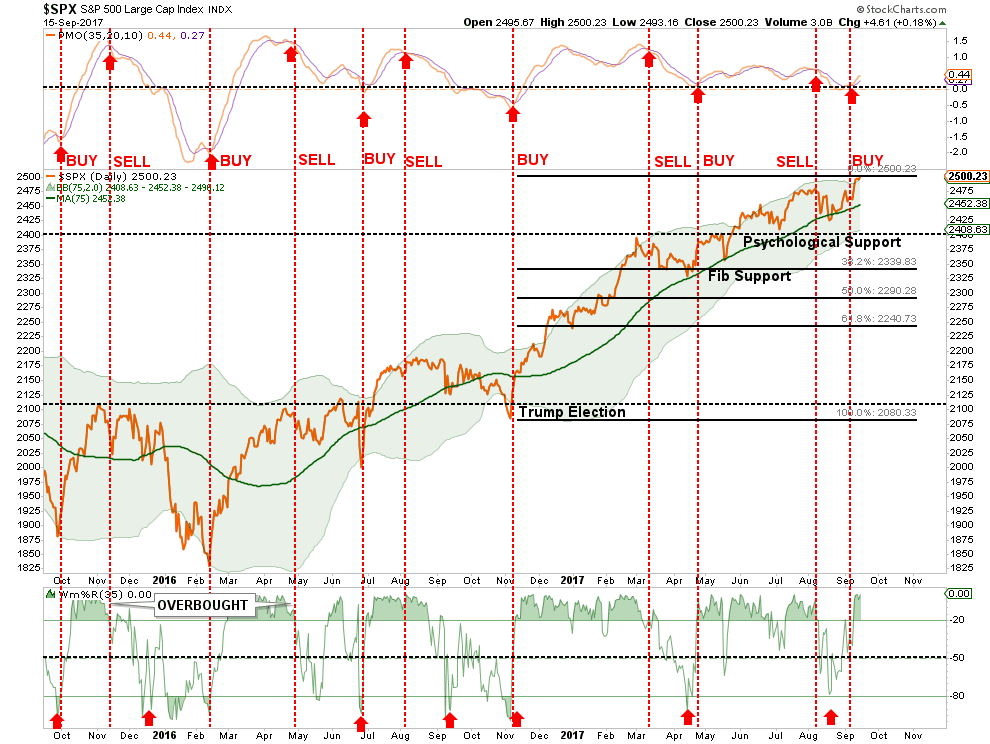
Not surprisingly, and as I noted yesterday, the market very slightly breached 2500:
“Since the election, there has been a concerted effort to push stocks higher on the hopes of tax reform, ACA repeal, and infrastructure building which would lead to strongly improving earnings for U.S. companies. Now, eleven months later, stocks have been breaching the psychologically important levels of 2200 in December, 2300 in February and finally 2400 in May. 2500 is the next target.”
As shown below, the market is pushing a short-term “buy” signal. However, now at 2-standard deviations above the 75-dma, as seen previously, the market likely has limited upside from here. Look
Let me remind you this move is not unexpected. As I addressed back on June, 9th:
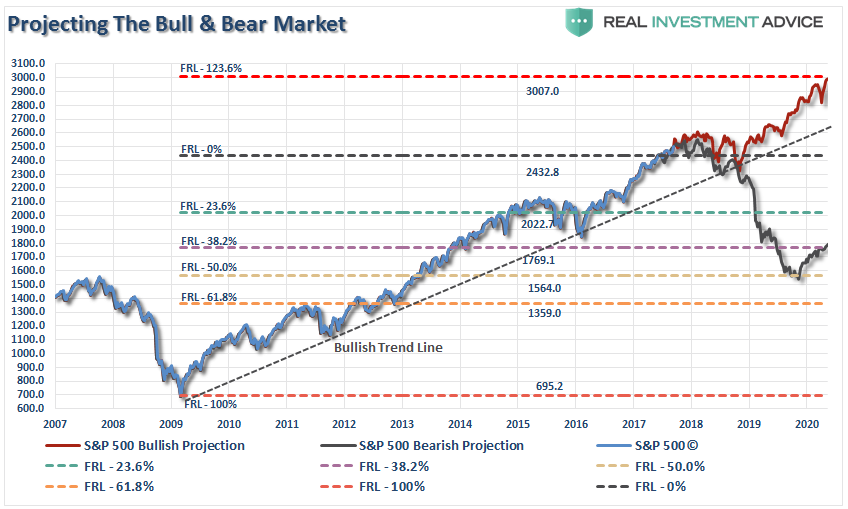
“Let me state this VERY clearly. The bullish bias is alive and well and a move to 2500 t0 3000 on the S&P 500 is viable. All that will be needed is a push through of some piece of legislative agenda from the current administration which provides a positive surprise. However, without a sharp improvement in the underlying fundamental and economic backdrop soon, the risk of something going ‘wrong’ is rising markedly. The chart below shows the Fibonacci run to 3000 if ‘everything goes right.’”
Despite the complete lack of legislative agenda, the markets did achieve its first milestone since that missive.
However, just remember, the bull-run is a one-way trip.
For now, the “bullish trend” remains intact which keeps portfolios allocated towards equities for now. BUT, and that is a “Kardashian” sized one, we do so with a “clear and present” understanding of the risk that we are undertaking. Stops have been moved up to recent support levels on all positions.
While there is some psychological support at 2400, the first level of Fibonacci support, post-election, is at 2340-ish. However, on a longer-term retracement, we are looking at a correction closer to 2000, and ultimately back to 1800ish.
The biggest concern currently is the massively elevated level of complacency. Regardless of threats of nuclear war, legislative agenda failure, missiles being launched over Japan, weak economics, and downwardly revised earnings estimates, the market has pushed higher on “hope.”
I have seen this environment before. We are in one of the longest periods on record without a 5% correction not to mention one of 10%. Volatility remains historically suppressed, and as noted on Thursday, investors are “all in the pool.”
The bulls have become completely desensitized to market risk.
I don’t know when.
Nor, do I know what will trigger it.
But a correction is coming and the following three charts are my biggest concern.
Chart 1) The current bull market cycle is already pushing one of the longest in history. With the support of global Central Banks, it could indeed become the longest. Regardless, it will end, and like all previously over-valued, over-extended, over-leveraged and overly-complacent bull cycle in history, it ends badly.
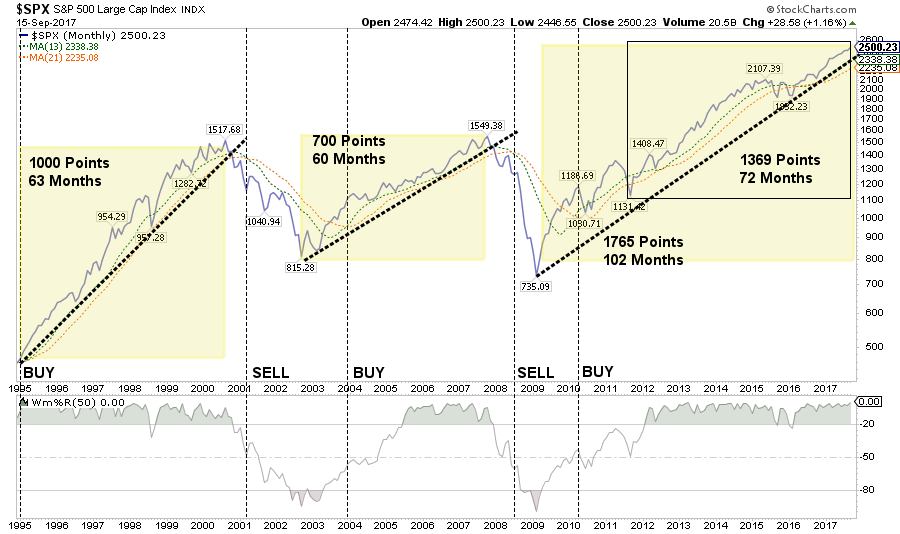
Chart 2) One of the hallmarks of a late-stage bull market cycle is the acceleration in price as investors capitulate by “jumping in” as prices accelerate. While the long-term moving averages currently suggest the bull cycle is intact, we will watch for the crossover to give us an indication of when to leave.
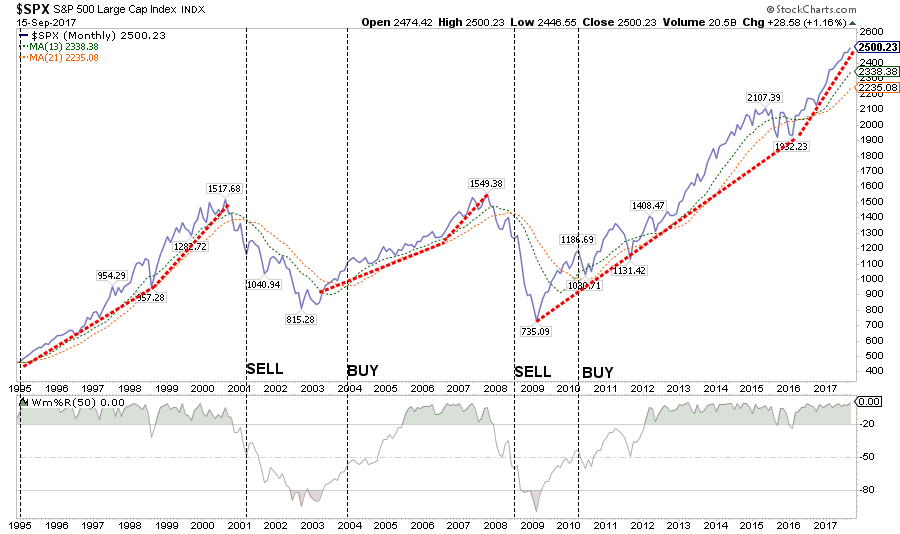
Chart 3) It is also not surprising to see earnings hit a “rough patch” before moving higher into the final phase of exuberance. The second downturn in earnings, particularly when sales are stagnating as they are now, tends to be the demarcation point of a repricing phase.
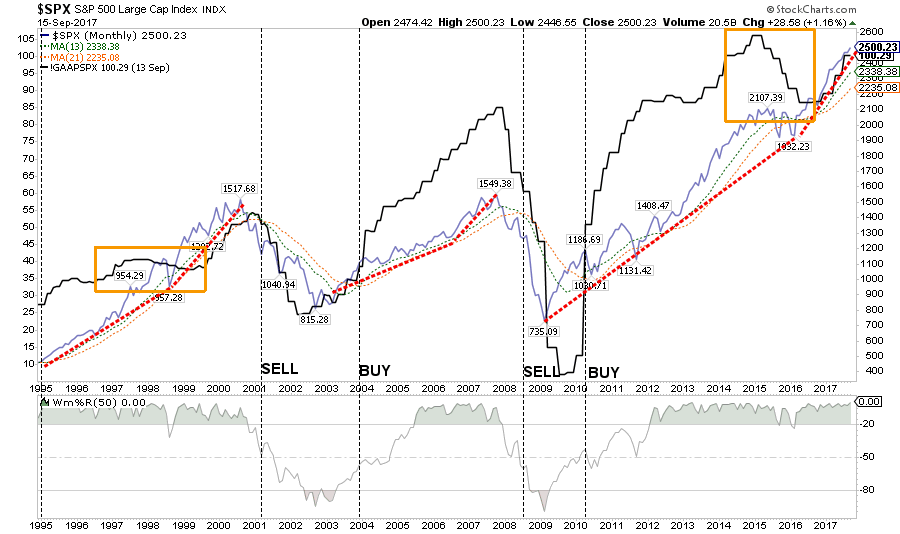
The ramp up in earnings in late 2016 and the first half of 2017 were a function of the rise in oil prices from the mid-30’s to the $50/bbl range. This led to a massive surge of 400% profit growth in the energy sector which boosted earnings higher for the index.
With oil prices stagnant over the last two-quarters, estimates are now being ratcheted lower as noted by FactSet recently.

If tax legislation fails to be passed this year, it is likely we will see a much more aggressive repricing of expectations in the near future.
As I stated previously:
“The question you have to ask yourself is simply this.
‘From current levels, IF everything goes right there is roughly 600 points of upside. If something goes wrong there are 900 points of downside. Are those odds I am willing to take?’
It’s easy to get wrapped up in the bullish advance, however, it is worth remembering that making up a loss of capital is not only hard to do, but the ‘time’ lost can’t be.”
At this juncture, there is a large, and inevitable, loss of capital forthcoming.
As a “Game Of Thrones Fan” would say…

Bonds Send A Signal
Last week, I discussed the various economic indicators suggesting the “Trump Trade” has likely come to its conclusion.
Interest rates are also currently sending a signal that investors should heed.
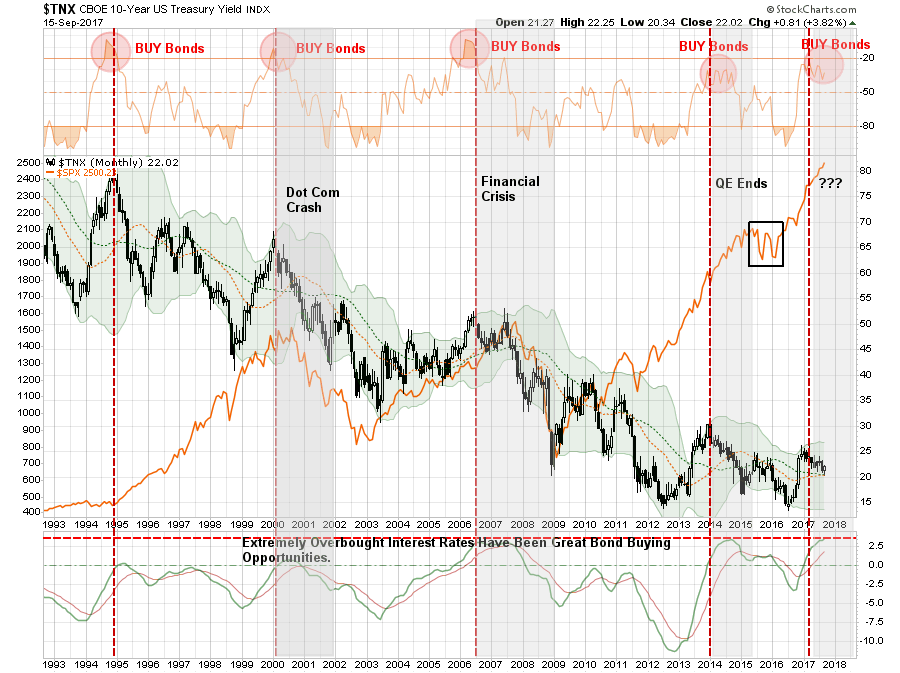
As you know, I have been, and remain, a rampant bond bull. Since 2013, as the vast majority of mainstream analysts were touting the end of the “bond bull market,” I was aggressively buying bonds.
While we have recently pared back some of our bond holdings and took profits around 2.1% on the 10-year treasury, we remain optimistically long corporate, GNMA and municipal bonds and are looking for the next opportunity to buy more bonds. (When you headlines about the “death of the bond market,” that is your signal to buy.)
When the next recession hits the U.S. economy, rates will fall below 1% as money flows to the relative safety of bonds as equity prices lose 30-50% of their value.
More importantly, and as shown below, interest rates on a monthly basis are at levels that have been associated with significant tops in both rates and stocks.
Whether or not you agree, there is a high degree of complacency in the financial markets. The realization of “risk,” when it occurs, will lead to a rapid unwinding of the markets pushing volatility higher and bond yields lower. This is why I continue to acquire bonds on rallies in the markets, which suppresses bond prices, to increase portfolio income and hedge against a future market dislocation.
In other words, I get paid to hedge risk, lower portfolio volatility and protect capital.
Bonds aren’t dead, in fact, they are likely going to be your best investment in the not too distant future.
“I don’t know what the seven wonders of the world are, but the eighth is compound interest.” – Baron Rothschild


In the financial world, there are “analysts”… and then there are legends.
And this man is a LEGEND.
Over the past 70 years (!) James Dines has consistently made accurate, and profitable, predictions about the financial world. His list of accomplishments can be seen in his Biography.
In a rare engagement, at 90 plus years old James Dines joins Michael Campbell on Money Talks this Saturday Sept. 16th. for a very special interview.
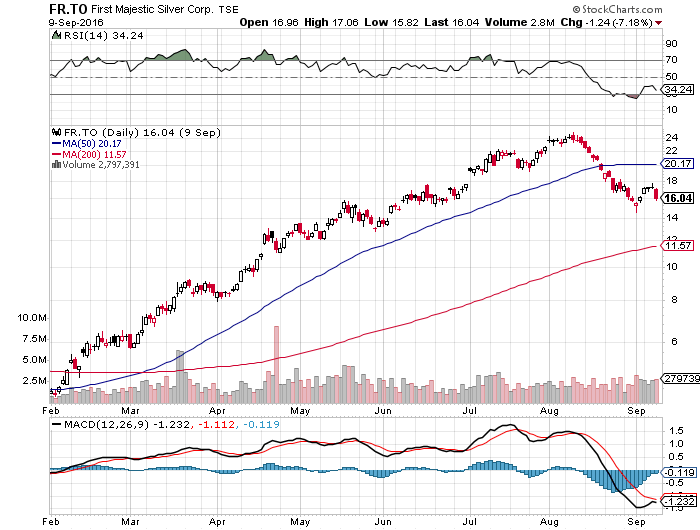
Last interviewed by Mike on Sept. 10th 2016 – Dines major profitability at that point had been gained in the Gold and Silver Stocks. Dines went bullish on Gold & Silver on Feb 13 2016 just two days before before Gold & Silver stocks erupted. Doubles, triples even a 4 bagger on:
First Majestic FR.TO which went from 5.75 to 24 in the next 6 months as illustrated in the chart below:
(Chart Dated Feb 1st 2016 to Sept. 10th 2016)
But that is not all.
The XAU Gold Stock Average ran from 55 to its peak of 115 6 months later on August 8th 2016. The junior Gold Market Average GDXJ ran from 22 to 50 on August 8th.
Dines said “he has never experienced a gold and silver rally so steep before”. Extremely bullish Gold and Silver, the power of the initial rally has a long term meaning. Right now Jim thinks the present rally, because of the power of the 2016 rally might be the first step of the 3rd wave he has been looking for. The first step was the rally $35 – $800 in the 1980’s, the second step rally was from April 2001 @ $255 to $1850 in 2011). James believes that the 3rd step would take gold to long term target of $3000 – $5000 an ounce.
Now with Gold & Silver rallying for the first time since James was last with us Sept 10th 2016, Mike has persuaded Jim to come back and tell us why he predicts in this 3rd wave an astonishing move in Silver to $300 to $500 an ounce.
Don’t miss this wonderful opportunity to hear this legend tomorrow on Money Talks. It may well be the most important interview you will hear for some time to come.
Listen to Money Talks Live HERE @ 8:30 am – 10:00 am PST Saturday Sept. 16th

 Highlights
-
Reeling from Tropical Storm Irma, Bob Hoye of Institutional Advisors rejoins the show with an in impromptu discussion.
-
Bob Hoye reviews the PMs sector including gold, silver and shares, noting his expectations for increased demand for gold / silver late this year or early 2018.
-
The technical outlook for Bitcoin and related cryptocurrencies – cryptos have joined virtually all financial markets in a speculative financial bubble.
-
The universal mantra of central bankers, that credit expansion equals economic prosperity will end poorly for all but the elite.
-
Inflation was absorbed by residential house prices and financial assets, in particular share prices.
Reeling from Tropical Storm Irma, Bob Hoye of Institutional Advisors rejoins the show with an in impromptu discussion via only power from a rusty gas-powered generator. Bob Hoye reviews the PMs sector including gold, silver and shares, noting his expectations for increased demand for gold / silver late this year or early 2018, mostly in non-US dollar currencies. The technical position of Bitcoin and related cryptocurrencies – cryptos have joined virtually all financial markets in a speculative financial bubble of epic proportions. The universal mantra of central bankers, that credit expansion equals economic prosperitywill end poorly for all but the elite. The inflation was absorbed by residential house prices and financial assets, in particular share prices.
 And “The Donald” said: “Open the floodgates!”
And the floodgates opened.
Less than 48 hours after Congress approved his debt ceiling suspension, more than $300 billion had flooded in.
That is the amount by which the U.S. national debt increased on Friday, September 8. By $317 billion, to be exact.
And “The Donald” said:
“It’s good.”
Tide of Debt
And it is good, but only if you are a zombie or a crony or a Deep State grifter.
The rest of us better get out our high waders and pool floats. This flood is going to drench us all.
“Deficits don’t matter,” said Dick Cheney.
Since the Reagan era, Republicans as well as Democrats have been ready to borrow money. But never, ever, did they borrow so much so fast as they did on Friday.
The feds needed cash… and they needed it fast.
So the floodgates opened. And now they are wide open… with no plausible way to close them.
The president and Congress are ready to borrow as though there were no tomorrow.
In comes a tide of debt, splashing over the sandbags put up by the old conservatives, sloshing through our banks and financial institutions, and coming to rest in the fetid waters of The Swamp.
Deficits DO Matter
If there were no tomorrow, Mr. Cheney would be right.
Why not eat tomorrow’s “seed corn” today?
There would be no reason not to reach for another dessert… or park your car in a handicapped space and tell your boss exactly what you think of him.
The trouble is there is a tomorrow. And tomorrow is when a drinking binge turns into a hangover… a bad marriage turns into a divorce… and your boss fires you.
Tomorrow is when deficits DO matter.
Yesterday, our subject was tomorrow’s political world… as “The Donald” creates his new Trumpismo movement.
Today, we look at tomorrow’s money world…
We don’t know exactly what will happen… or when. But we know the world still turns. Every boom not supported by real savings and real increases in output is phony. Tomorrow is when you find out.
Great Betrayal
Today’s prosperity, such as it is, was built on fake money, fake savings, and fake signals from the Fed.
The feds have pumped $37 trillion in “excess credit” – above and beyond the traditional relationship between debt and GDP – into the system over the last 30 years.
And now, the economy – especially the parasitic half of it run by the Deep State – depends on more and more fake money and fake credit.
That’s the one thing Republicans, Democrats, and Trumpistas agree on – nothing will be allowed to get in the way of the fake-money flow.
With the sluices open, the debt will rise. How much?
No one knows.
Credit expert Richard Duncan, who runs the Macro Watch advisory service, believes it could increase another $19 trillion before the U.S. is as deeply in debt as Japan.
Maybe.
All we know for sure is that, with nothing to stop it, you can expect it to keep going up – until the whole economy drowns in it.
That is the real meaning of Trumpismo and the Great Debt Ceiling Betrayal.
The wash of credit will continue. More spending. More debt. More mischief. More claptrap. More swindles by more scoundrels. No turning back.
Final Act
In short, this is what we’ve seen coming for the last 15 years…
Empires do not back up. The institutions that were meant to restrain them – a constitution, a bill of rights, voters, a debt ceiling – are abolished, ignored, or reshaped so the farce can continue to its final act.
Now, Congress blithers impotently. Politicians plot and connive. Deep State apparatchiks gather more power. Corporate insiders jig the figures and rig the game.
And more and more win-lose deals mean fewer and fewer win-win deals.
At some point, though, the gods stop laughing… and tomorrow comes.
Markets crash. And all the feds’ money… and all the feds’ men… can’t put them back together again. The insiders can control many things… but not everything.
Japan’s stock market took a dive 27 years ago. Investors are still down nearly 80% – more than a quarter of a century later – despite a flood tide of credit that increased government debt from 60% of GDP in 1990 to 250% today.
More to come… including what it will mean for America when the feds try to control the money system…
Regards,
Bill
Market Insight: Movie Theaters Take a Beating
Now is not a great time to be in the movie theater business.
As Bill mentioned last week, this past Labor Day weekend was the worst in terms of box office sales in nearly 20 years.
Meanwhile, the “Netflix effect” is stealing eyeballs from big movie theater companies such as AMC Entertainment Holdings and IMAX.
Today’s chart tracks the performance of shares in AMC, IMAX, and Netflix since September 2014.
 |
As you can see, over that time, AMC is down 42%… IMAX is down 29%… and Netflix is up 172%.
– Chris Lowe
Briefly:
Intraday trade: Our Friday’s neutral intraday outlook has proved accurate. The S&P 500 index continued to fluctuate within its week-long trading range. The broad stock market is likely to open much higher today following futures contract rally after an overnight gap-up opening. We can see some short-term technical overbought conditions. Therefore, intraday short position is favored. Stop-loss is at the level of 2,490, close to early August record high. Potential profit target is at 2,455 (S&P 500 index).
Our intraday outlook is now bearish, and our short-term outlook is bearish, as we expect downward correction. Our medium-term outlook remains bearish:
Intraday outlook (next 24 hours): bearish
Short-term outlook (next 1-2 weeks): bearish
Medium-term outlook (next 1-3 months): bearish
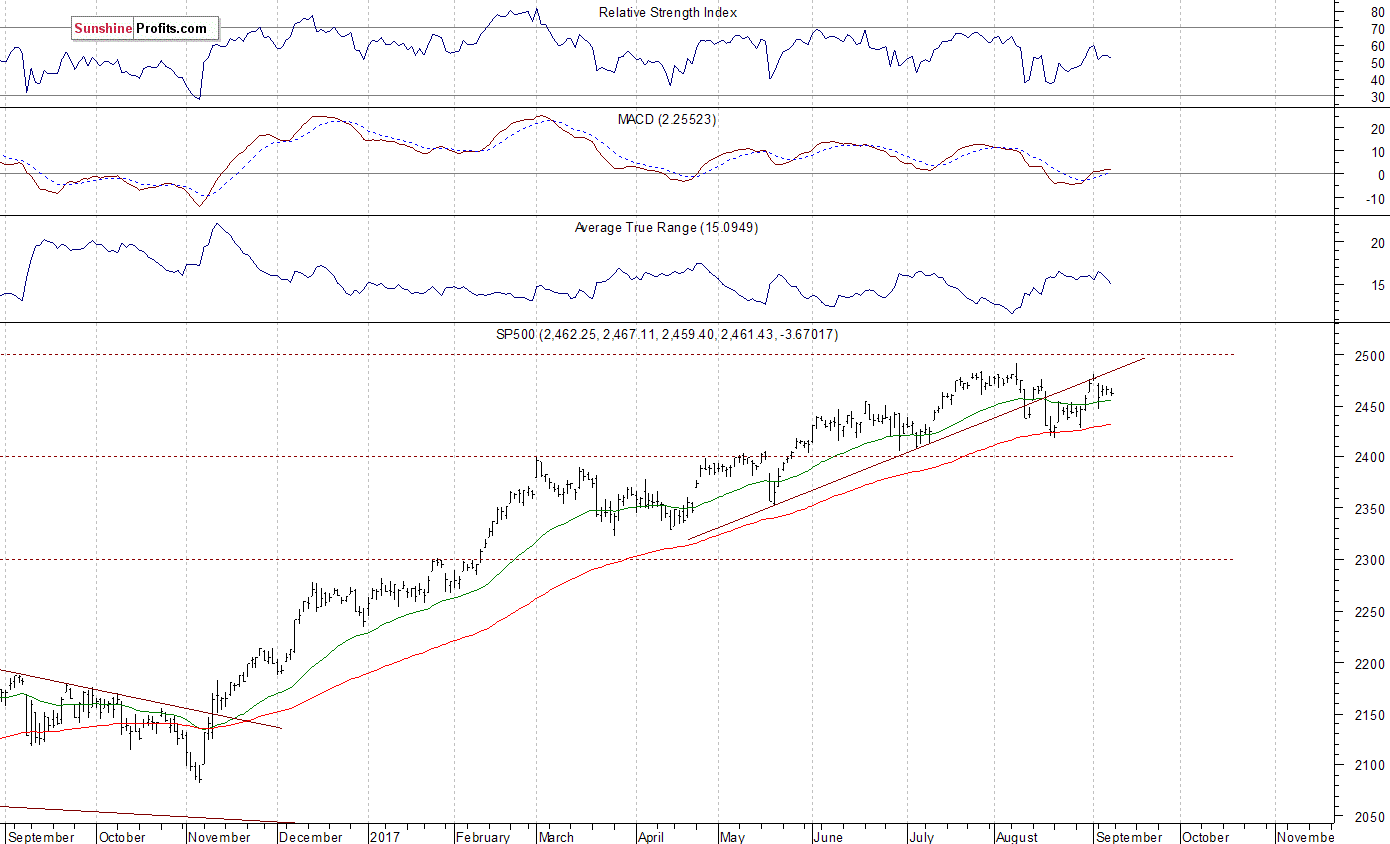
The main U.S. stock market indexes were mixed between -0.6% and +0.1% on Friday, extending their short-term fluctuations, as investors reacted to economic data announcements, news concerning hurricane ‘Irma’, among others. The S&P 500 index continues to trade around 1% below the August 8 all-time high of 2,490.87. The Dow Jones Industrial Average extended its fluctuations along the level of 21,800, and the technology Nasdaq Composite index lost 0.6%, as it fell below the level of 6,400. The nearest important level of resistance of the S&P 500 index remains at around 2,470-2,475, marked by last Tuesday’s daily gap down of 2,471.97-2,473.85. The next resistance level is at 2,480-2,490, marked by recent local high and the above-mentioned August record high. On the other hand, support level is at around 2,445, marked by last Tuesday’s daily low. The next level of support is at around 2.430-2,435, marked by the daily gap up of 2,430.58-2,433.67 and previous local low. The broad stock market continues to trade within an over-month-long consolidation following November-July uptrend. Will it continue higher? Or is this some medium-term topping pattern before downward reversal?
Very Positive Expectations
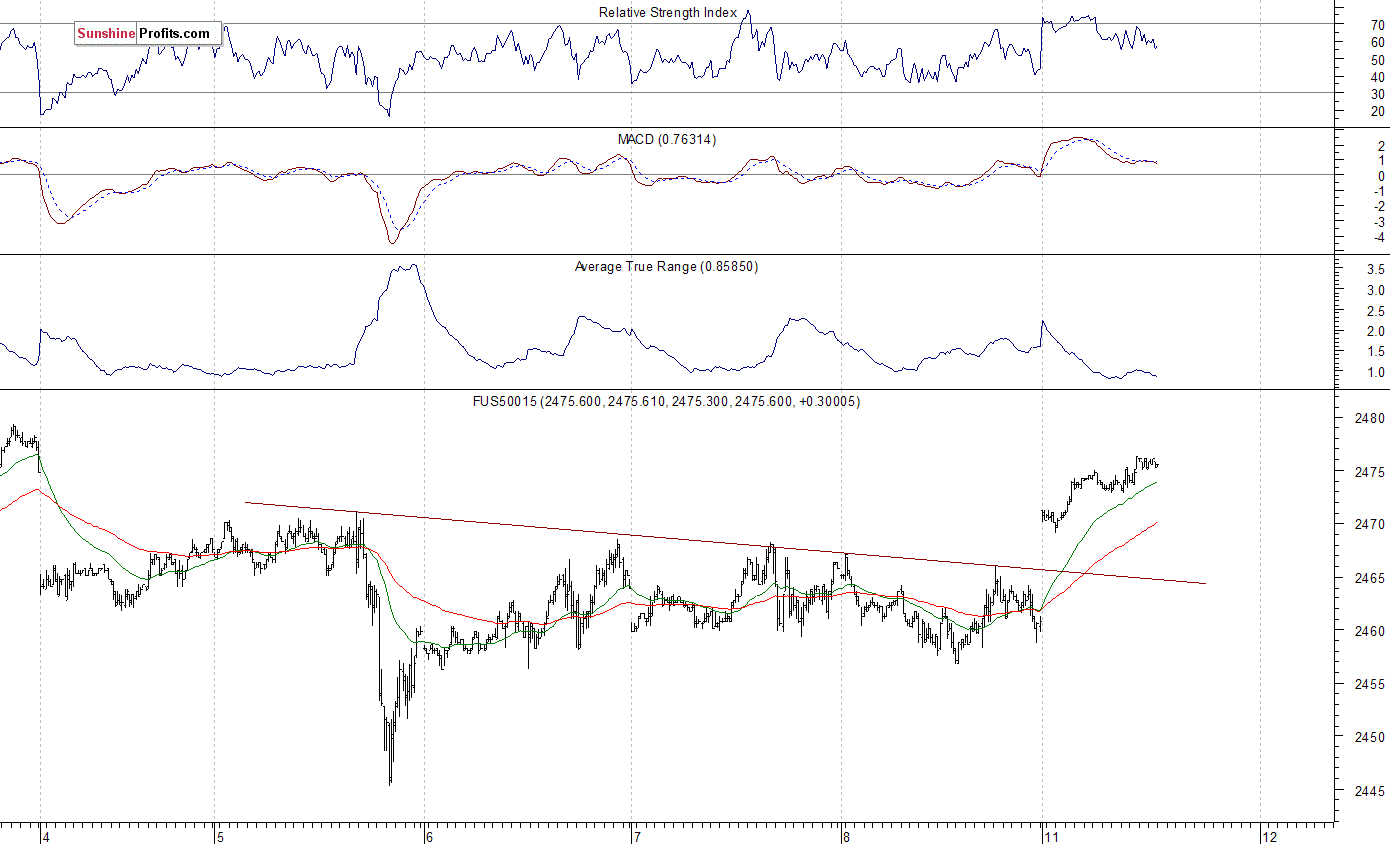
Expectations before the opening of today’s trading session are very positive, with index futures currently up between 0.6% and 0.8% vs. their Friday’s closing prices. The European stock market indexes have gained 0.5-1.2% so far. There will be no new important economic data announcements today. The S&P 500 futures contract trades within an intraday uptrend, following much higher opening of the trading session. The nearest important level of support is at around 2,465-2,470, marked by today’s daily gap up, among others. The next support level remains at 2,455-2,460, marked by short-term local lows. On the other hand, resistance level is at 2,480-2,490, marked by some local highs and the early August all-time high. The market broke above its short-term consolidation this morning. Will it continue its uptrend? There have been no confirmed negative signals so far. However, we can see some short-term technical overbought conditions:
Nasdaq Relatively Stronger
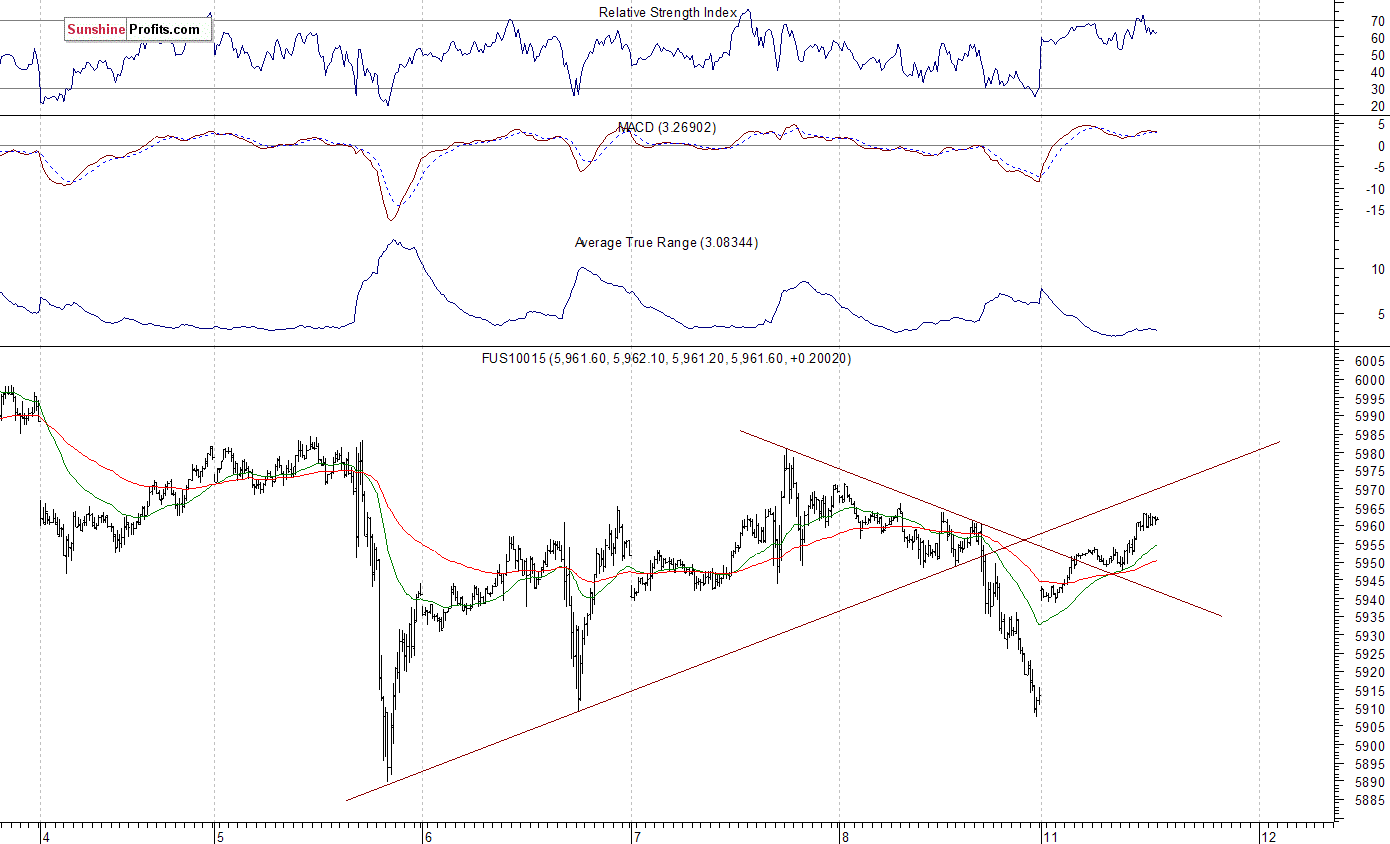
The technology Nasdaq 100 futures contract follows a similar path, as it trades within an intraday uptrend. It retraces its Friday’s move down. The nearest important level of resistance is at around 5,980, marked by recent local high. The next level of resistance is at 6,000-6,020, marked by record high, among others. Will the Nasdaq resume its uptrend and break above 6,000 mark again?
Concluding, the S&P 500 index extended its short-term consolidation on Friday, as it lost 0.2%. The broad stock market will likely break above its recent trading range today following an overnight futures contract rally. Will the uptrend continue towards the level of 2,500? There have been no confirmed short-term negative signals so far. However, we still can see some medium-term overbought conditions along with negative technical divergences.
If you enjoyed the above analysis and would like to receive free follow-ups, we encourage you to sign up for our daily newsletter – it’s free and if you don’t like it, you can unsubscribe with just 2 clicks. If you sign up today, you’ll also get 7 days of free access to our premium daily Gold & Silver Trading Alerts. Sign up now.
Thank you.
Paul Rejczak
Stock Trading Strategist

-
I know Mike is a very solid investor and respect his opinions very much. So if he says pay attention to this or that - I will.
~ Dale G.
-
I've started managing my own investments so view Michael's site as a one-stop shop from which to get information and perspectives.
~ Dave E.
-
Michael offers easy reading, honest, common sense information that anyone can use in a practical manner.
~ der_al.
-
A sane voice in a scrambled investment world.
~ Ed R.
Inside Edge Pro Contributors

Greg Weldon

Josef Schachter

Tyler Bollhorn

Ryan Irvine

Paul Beattie

Martin Straith

Patrick Ceresna

Mark Leibovit

James Thorne

Victor Adair