
Wealth Building Strategies
As the Dow reeled from its biggest one-day drop in six weeks Gold spiked higher by more than $20 last Friday morning on the news that President Trump picked a new national security adviser, John Bolton who believes strongly in regime change through war. So with the U.S. apparently gearing up for war on multiple fronts: the trade front and actual, physical conflict, investors appear to be piliing into that anchor in uncertain times, Gold! – R. Zurrer for Money Talks
In Saturday’s column, we talked about why President Trump’s decisions on trade tariffs and security are good for gold. You can read it here: “Cry Havoc! And Grab Gold.”
Last week, we saw gold post its biggest weekly gain since 2016. That’s what made me so bullish. My fear was I might be too early. That sometimes happens. I notice a trend develop and hop on it before the rest of the market wakes up and smells the coffee. We generally don’t want to hop on too soon. That can be just as painful as too late.
But gold surged to a five-week high on Monday. Sure, it will zig and zag. But I believe it’s likely heading higher.
Last week, we looked at the psychological reasons. To that, you can add the fundamental reasons of supply and demand. Indeed, here are two charts that show ETF investors are going long in a big way.
First, here is a chart of holdings in physical silver ETFs (white line) and physical gold ETFs (blue line).
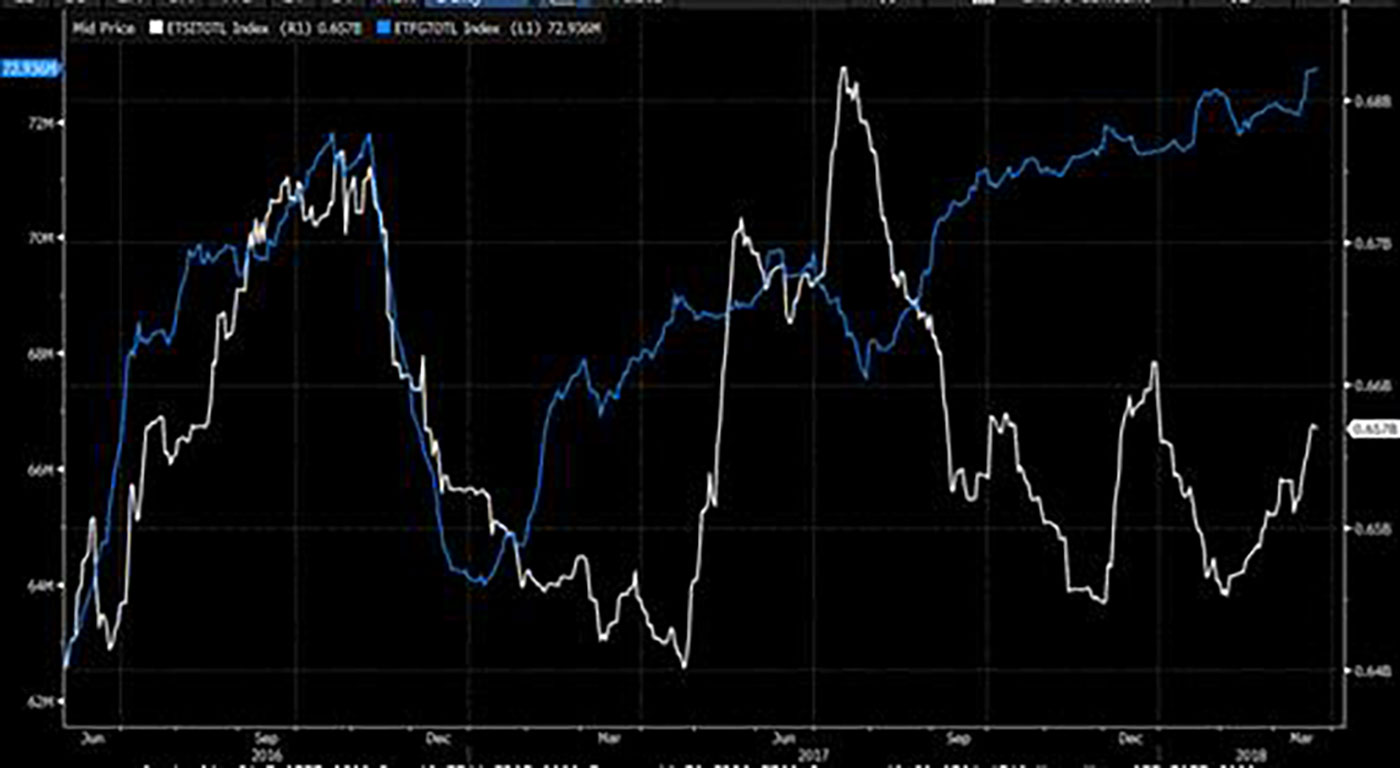
You can see that investors are piling into both. Zeroing in on gold, the latest numbers from Thursday show that gold ETF holdings of the metal stood at 72.9 million ounces. That’s the highest since May 2013.
Second, we can see that gold holdings in ETFs went up right as hedge fund managers’ holdings of gold went down.
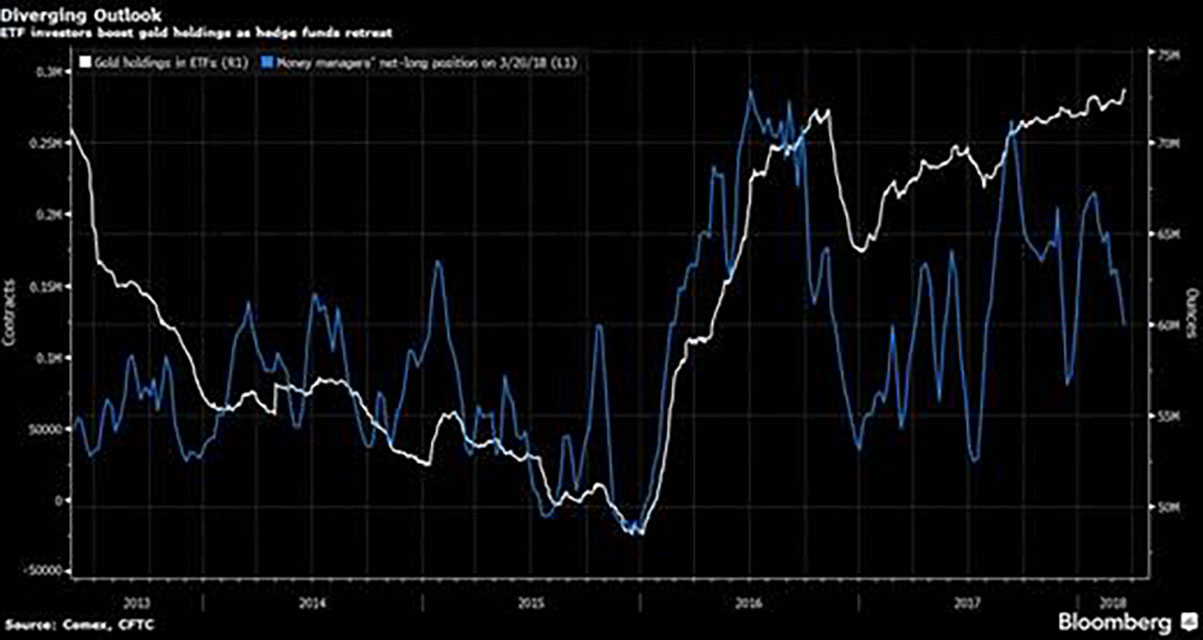
Here, gold holdings are the white line, and hedge funds are the blue line. Hedge funds are famous for doing the wrong thing at just the wrong time. So, kudos to Mom and Pop investors on that one.
That’s all short-term. So, for my third chart, well … you know me, and my long-term cycles and charts. I’m going to dust off a monthly chart of gold here …
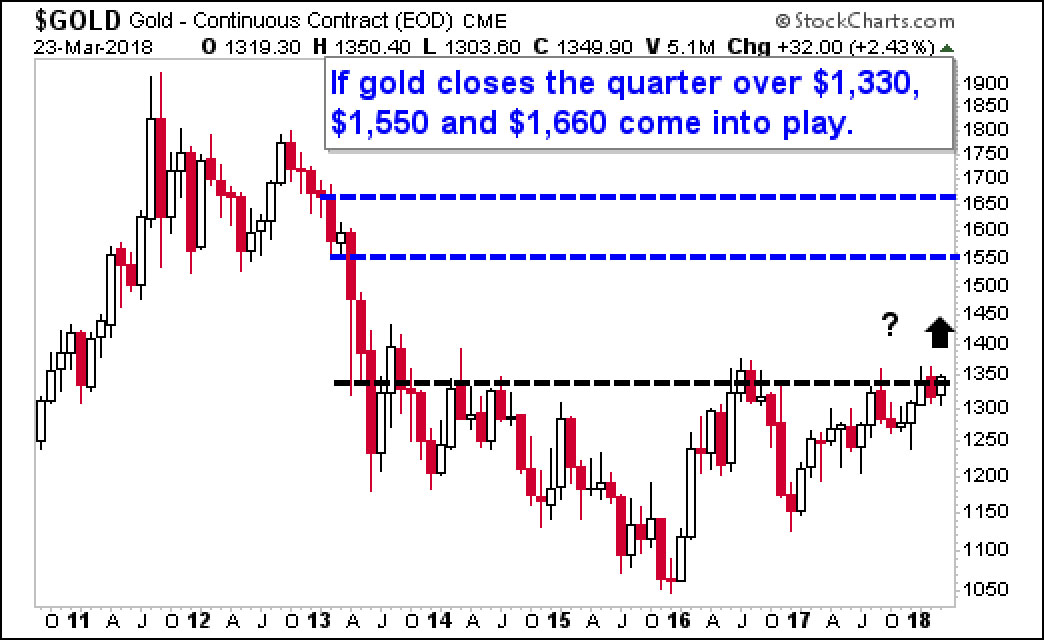 |
This week ends the quarter. And if gold closes this quarter above $1,330, that would be the first time we’ve had a quarterly close above that level since 2013. For technical traders, that would be like throwing red meat in a shark tank!
Now, will gold close the quarter above this level? I might be jumping the gun here. But:
• For all the trade and war reasons I laid out in my article …
• For the reasons of tightening supply and demand …
• For the reasons of investor psychology, which we can see in the ETFs …
… I think it’s a great time to buy the strongest miners.
Those miners are tracked by the two biggest gold miner funds, the VanEck Vectors Gold Miners ETF (NYSE: GDX) and the VanEck Vectors Junior Gold Miners ETF (NYSE: GDXJ). For a long time, these two funds underperformed gold. But on March 20, that all changed.
March 20 was when the miners started leaving the metal in the dust.
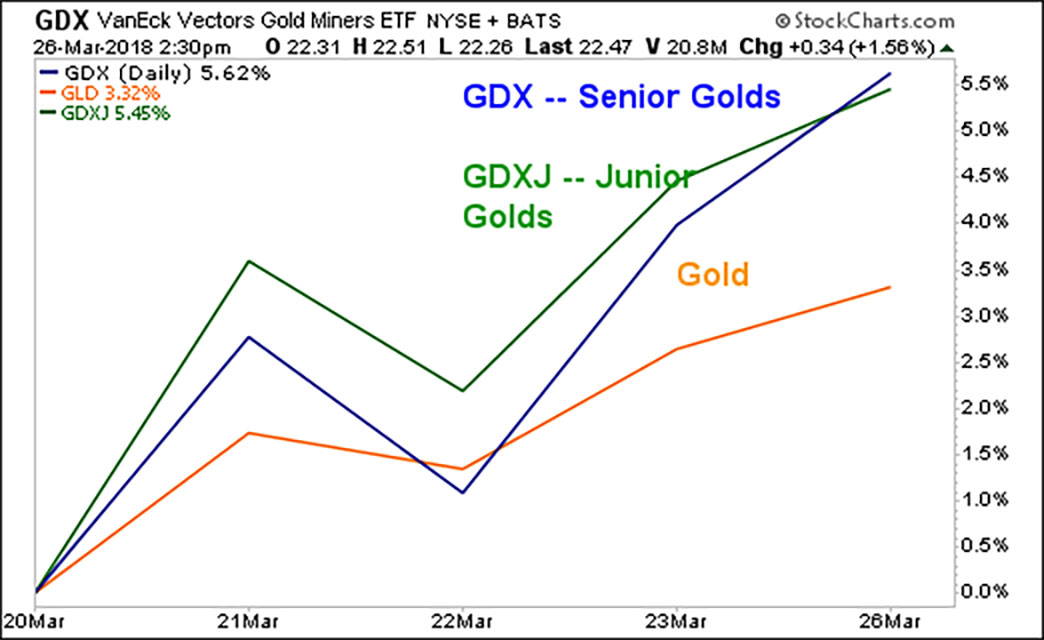 |
That’s the kind of action you expect to see in bull markets.
You can buy either of these ETFs and do well. OR, you can drill down, do your research, and buy individual names for even more potential outperformance.
Here’s what I did — I gave my Wealth Supercycle subscribers five gold miners that are on the launch pad. They are poised for outperformance. That’s on top of the three picks I gave them previously.
Do whatever suits you best. This profit ship is setting sail. Be onboard.
Best wishes,
Sean


Perspective
Guys at the Fed still think that crude oil prices going up is bad for the stock market. Obviously, there is still little regard for empiricism at the Fed. The stock market goes up with crude and then it goes down when crude goes down. The establishment has a similar problem in thinking that rising interest rates are bad. No, short-dated rates, such as T- Bills, increasing confirm that the boom is on. Reversing and turning down indicates the boom is over.
Since the first of February, the Bill-rate has jumped from 1.40% to 1.77%.
Then there are solar cells that generate electricity from raindrops rolling down the matrix. Could be exciting in Vancouver, which is the city by the rainforest. The way we locals tell the weather is straightforward. If you can see the mountains, you know it is going to rain. If you can’t see them, you know it is raining.
And then if it rains after dark – solar cells would work! The presence of “Goldilocks” is noted.
That meteorology staffers are using super computers to mine cryptocurrencies may be as sound as their forecasts that the Earth is going to fry.
Stock Markets
On the bigger picture, financial markets have been enjoying a fabulous boom. Is it complete?
Our concern is that when it expires, the recession will start virtually with the bear market. During the usual cycle the stock market peaks some 9 to 12 months before the economy does. At the end of great financial bubbles, the record has been that the recession starts virtually as speculation blows out and collapses.
We used this in 2007 when the S&P peaked in October and the recession started in that fateful December. Fateful, because that was the month that Harvard economist, Greg Mankiw, boasted that nothing could go wrong. The Fed had a “dream team” of economists. Fateful, because it was the start of the worst contraction since the 1930s.
Our October 4th Pivot outlined that even the DJIA would be “bubbled”, which was a bold call. Also outlined was that there were previous examples of outstanding speculations completing in the December-January window. The Bitcoin phenomenon peaked in the middle of December and seems to be following the path following the climax of previous bubbles such as with gold and silver in January 1980, or the Nikkei in December 1989.
Another point was that the senior indexes would likely peak somewhat after the feverish speculations did. The high for the S&P was set on January 26th, which was also the high for the NYSE Comp (NYA).
Following the initial hit, the market was likely to churn around, building a base for a rally into May-June.
So far, so good, but to be prudent it is best to look to the threats that accompany magnificent frenzies. The real threat is that the markets have been hyper. The “threats” from credit markets or industrial commodities are actually catalysts.
Any change in the credit markets could place some big accounts offside. As with Bear Stearns in June 2007, Clarence Hatry in the summer of 1929 and Jay Cooke (“a savior of the nation”) in late September 1873. A decline in industrial commodities would be a negative.
As we have been noting, credit markets could enjoy some seasonal “sunshine” at around May. When financial conditions are speculative () there can be a turn to adversity later in the year (??).
BOB HOYE, INSTITUTIONAL ADVISORS
E-MAIL bhoye.institutionaladvisors@telus.net
WEBSITE: www.institutionaladvisors.com

Andrew details some of the challenges faced by investors as they enter the MOST important phase of their planning for end-of-work and retirement.

The three key themes in the current market environment – a rise in volatility, inflation, and investor sentiment – are characteristics of a business cycle in its later stages. Taking Warren Buffet’s rule #2 “Don’t Lose Money” to heart, they make a comprehensive case for a late-cycle investing game plan which includes shifting away from stocks towards cash, % bearing assets and commodities and commodity-related stocks. – Robert Zurrer for Money Talks
Theme # 1 – Rising Volatility
Investors have been spoiled over the last two years with record low levels of volatility in virtually every asset class, causing some investors entering 2018 to throw caution to the wind as euphoric levels of greed crept into the market. The title to our quarterly newsletter was “Records Were Made to Be Broken” and the recent market decline has ended some of those records already. Using S&P 500 data going back to the Great Depression, the US stock market set a new record of going 311 days without a 3% decline and 404 days without a 5% decline. We are unlikely to repeat these feats any time soon as we believe investors should anticipate a more volatile environment going forward as we transition through a major turning point in global monetary policy.
In the aftermath of the Great Recession of 2007-2009, we saw central banks respond with unprecedented stimulus using zero-interest-rate-policy (ZIRP) and quantitative easing (QE) to expand their balance sheets to unimaginable levels. The collective result of these actions was an end to the Great Recession and the beginning of new liquidity-fueled economic expansions and bull markets around the world.
The global liquidity tide of easy money began to slow down first with the US Fed ending its QE program in 2014, eventually raising interest rates in 2015 for the first time since 2006. Along with a steady increase in rates, the Fed is also on track to shrink its balance sheet to the tune of an estimated $420 billion this year and $600 billion next year. Though President Trump has enacted a stimulative tax cut, as Dave Rosenberg recently pointed out (Lunch with Dave, 12/28/17), estimates project $140 billion in stimulus for economy-wide earnings this year with additional gains of $80 billion next year—a small offset to the liquidity drain from monetary policy.
Further adding to the monetary liquidity drain will be the European Central Bank (ECB), which is slated to end its QE program later this year. According to Wells Fargo, the combined purchases of the world’s two biggest central banks—the Fed and ECB—will turn negative beginning this summer and only accelerate in the second half of the year.
 Source: Advisors Perspective
Furthermore, when we look at the annual growth rate of the top seven central banks’ balance sheets, we see that it will likely turn negative in 2019 for the first time since 2015. If you can recall, 2015 into 2016 was a very tumultuous period with back-to-back double digit declines and fears over a major market top in the works.

For the better part of the last decade stock prices and central bank balance sheets have been joined at the hip so anything to upset the apple cart should not be dismissed. As the global liquidity tide starts to go out over the next year, we are likely to see who has been swimming naked (as Warren Buffett famously remarked). This should also add to further volatility, a common characteristic seen in the later stages of the business cycle.
Theme # 2 – Rising Inflation
In addition to our expectation for an increase in volatility over the coming year, another theme we are watching is for a pick-up in inflation, a similar late-stage business cycle characteristic. Over the last year and a half, we have seen a significant pick-up in the manufacturing sector, which acts as a long-leading economic indicator for future trends in inflation. Over the last decade we have seen two cyclical upturns in inflation, the first occurring in 2010/2011 and the second in 2014, and the upturn in manufacturing activity seen over the last two years tells us to expect our third upturn in inflation over the next two years. This is shown below with cyclical upturns in the Core Consumer Price Index (CPI), which excludes food and energy, highlighted by the blue arrows and manufacturing activity shown by the black line.

Source: Bloomberg, Financial Sense Wealth Management
In addition to rising economic activity, a tight labor market also pushes inflation higher via wages. Small businesses are the heart and soul of job creation in the US, and one of the most glaring trends for small businesses is the difficulty finding qualified applicants for job openings. In the most recent NFIB survey, over one in five small businesses reported that poor labor quality is their single most important problem, something we haven’t seen in almost two decades (top panel below). With continued economic activity and a diminishing supply of labor, this puts upward pressure on wages as pre-existing employees demand higher compensation in response. Notice, as well, that poor labor quality wth a falling unemployment rate is a classic late-stage business cycle progression that is witnessed prior to recessions.

Source: Bloomberg, Financial Sense Wealth Management
The last factor we want to highlight that is likely to lead to higher inflation is the weak US Dollar (USD). Weakness in the USD relative to a basket of foreign currencies leads to higher commodity and import prices, which in turn contributes to a higher general level of inflation. Past weakness in the USD suggests we should see the trend of rising inflation persist throughout 2018 as shown below.

Source: Bloomberg, Financial Sense Wealth Management
Theme # 3 – Rising Sentiment Levels
Back in 2015-2016 the stock market went through several wild swings with stocks suffering multiple double-digit declines. Many technicians and strategists at the time were quite negative and believed the market was in the process of forming a major top with a bear market and recession ahead. However, most often we see that market tops are not seen in advance by most and certainly are not associated with widespread pessimism. In fact, it’s usually just the opposite with euphoria, greed, and excessive displays of wealth and prosperity being celebrated by many. Consider the following three examples:
1. 1929 Crash/Great Depression
The most devastating stock market crash in American history known as Black Tuesday took place on October 29th, 1929 and signaled the beginning of a 12-year Great Depression across the Western world. It was a dark time of despair, poverty, and widespread ruin. Just prior to the crash, however, the public mood could not have been more positive and euphoric. At the height of the Roaring Twenties, less than a year before the 1929 crash, US President Calvin Coolidge famously articulated the feelings of the American public by saying the following:
“No Congress of the United States ever assembled, on surveying the state of the Union, has met with a more pleasing prospect than that which appears at the present time. In the domestic field there is tranquility and contentment, harmonious relations between management and wage earner, freedom from industrial strife, and the highest record of years of prosperity. In the foreign field there is peace, the good will which comes from mutual understanding, and the knowledge that the problems which a short time ago appeared so ominous are yielding to the touch of manifest friendship. The great wealth created by our enterprise and industry, and saved by our economy, has had the widest distribution among our own people, and has gone out in a steady stream to serve the charity and the business of the world.” – Calvin Coolidge December 4, 1928
2. 2000 Technology Bubble
This commercial says it all…
3. 2017 Bitcoin Bubble
Twitter Post from Neel Kashkari, current President of the Federal Reserve Bank of Minneapolis, one month prior to the top in Bitcoin.

Source: Twitter
As mentioned previously, an important ingredient for a market top is either high or euphoric levels of sentiment. Consumer confidence plummeted to an all-time low after the 2007-2009 recession and has been steadily making its way back as the economy has grown and asset prices have recovered. After Trump’s election, small business sentiment saw the largest single jump in its history and has continued to climb to the highest reading in decades (top panel below). As well, the Conference Board’s measure of consumer confidence is at 18-year highs and near the upper range of the last half century (red line, lower panel in image below).

Source: Bloomberg, Financial Sense Wealth Management
Game Plan for Late-Cycle Investing
There are several strategies to help one navigate increasing market risk in the latter phase of the business cycle and we will touch on two of them, with risk management being the most important. As stock valuations become elevated and downside risks pick up, it becomes prudent to start taking chips off the equity table and move into safer assets like cash and bonds, which typically help protect you during equity bear markets.
Strategy # 1 – Reducing risk
“Rule Number 1: Never lose money. Rule Number 2: Never forget rule Number 1.” – Warren Buffet
The reason why minimizing large setbacks to your liquid net worth experienced during bear markets is so important is that the return required to breakeven becomes parabolic the deeper the loss.

Source: JPM Guide to the Markets
The average bear market decline over the last century has been 45% and so just to breakeven your portfolio would have to appreciate by 82%!

Source: JPM Guide to the Markets
Looking at the two figures above, you can clearly see why Warren Buffett’s rule number one and two is, “DON’T LOSE MONEY!” To help mitigate the downside of bear markets, shifting away from riskier investments is a prudent strategy as illustrated nicely by the figure below. The returns for a 40/60 and 60/40 stock & bond portfolio were compared to a 100% stock-only portfolio using the S&P 500 to represent the stock market. Measuring from the October 2007 peak in the market, the safest portfolio (40/60 stocks & bonds) took two years to recover its losses while the next safest portfolio (60/40 stocks & bonds) took three years. That may seem like a long time, however, it took the S&P 500 (100% stocks) nearly 5 years after the 2007 top to get back to even. As we see, the harder you fall, the more time it takes to get back up again.

Source: JPM Guide to the Markets. Past performance is no guarantee of future results. All indexes are unmanaged and cannot be invested into directly.
Another thing worth pointing out is that the riskiest portfolio consisting of 100% stocks did not catch up to a 40/60 or 60/40 stock & bond portfolio until late 2014, seven years after the markets peak! Clearly, reducing risk prior to a bear market can help investors in the long-run.
Strategy # 2 – Shifting towards late-cycle investments
The relative performance of various asset classes is largely dependent on where the economy is within the business cycle. For example, during the early and mid-cycle phases, stocks tend to be the best performing asset class while bonds lag behind. However, when you shift towards late-cycle, the best performing asset class is typically commodities, with the outperformance in stocks starting to diminish relative to junk and investment-grade bonds. Thus, shifting one’s portfolio to inflation-resistant assets such as commodities can be a good hedge against rising inflation, which typically peaks in late-cycle to early recession.

Source: Fidelity Investments, Quarterly Market Update (Q1 2018)
Given our belief that inflation will rise in the coming months (theme # 2) and that we are late-cycle, a shift towards assets that act as a hedge against inflation appears warranted. Since 1966, energy stocks have been the best hedge against rising inflation followed by gold and material stocks.

Source: Fidelity Investments, Quarterly Market Update (Q2 2017). Past performance is no guarantee of future results.
Time for Gold?
While we have not been bullish on gold for quite some time, it may warrant a closer look based on a number of key developments. We originally turned cautious on gold near the end of 2017 for two reasons: potentially rising real interest rates and a weakening Japanese yen. While we believe that inflation will pick up this year, there is the risk that interest rates rise faster than inflation, which is negative for gold. The collapse in gold prices in 2013 occurred as real interest rates spiked (the Bernanke “taper tantrum”) and inflation moderated. Then, when real interest rates peaked in 2015, gold finally bottomed. The negative relationship between gold and real interest rates (shown inverted for directional similarity) has been very strong this cycle, as shown below:

Source: Bloomberg, Financial Sense Wealth Management
As mentioned above, our concern heading into 2018 was that real interest rates would rise and that has certainly been the case. However, even with real interest rates now near their 2013 and 2015 highs, this has yet to translate to weakness in the price of gold. The temporary breakdown in gold’s relationship to real interest rates (yellow highlighted region above) suggests that, over the near-term, either gold has it wrong and will fall or real interest rates are likely to fall instead. Until we see resolution, we remain on the sidelines. That said, there is another trend we are closely following that may prove important.
For a variety of reasons, currency movements in the Japanese yen have a number of ripple effects on the market and various asset classes, particularly as a leading indicator for gold. The two most recent examples are the yen breakdown in late 2012 BEFORE the large drop in gold in the first half of 2013 (red shaded bar below) and the bottom in the yen in the middle of 2015 followed by gold later that year (green shaded region below). It was the large yen move late 2015 to early 2016 that gave us confidence to buy gold during a bottom and also the sizeable decline in the yen late 2016 that told us the rally was over, leading us to sell gold at a premium. As we were closing out 2017, the yen was precariously close to breaking down its 2015-2017 bullish trend and is a major reason why we turned cautious on gold. However, with the strength in the yen this month, breaking the bearish trend that has been in place since 2012, this suggests that the bear market in gold that began in 2011 may now be over. A move north of $1400 an ounce and a decline in real interest rates would place us firmly in the bullish camp for gold and change our assessment.

Source: Bloomberg, Financial Sense Wealth Management
Summary:
We believe that the three key themes outlined above—a rise in volatility, inflation, and investor sentiment—are characteristics of a business cycle in its later stages. If we are correct in our view, then implementing late-cycle strategies appears warranted, particularly by shifting away from stocks towards lower volatile assets like cash and bonds while simultaneously positioning accounts towards late-cycle assets like commodities and commodity-related stocks. We are also on alert for a bullish move in gold but are waiting for confirmation based on the information outlined above.
The investment stakes are raised in the latter phase of the business cycle for one simple reason: the next stage is potentially recession (see Records Were Made to Be Broken for our recession outlook) and the most devastating bear markets in history have all been associated with economic recessions. As such, we will remain vigilant by watching incoming economic and market data to gauge when we are moving from late-cycle to recession.
Given the potential investment risks and rewards for this year and next, now is the time to conduct a thorough risk assessment of your liquid investments. To find out more about Financial Sense Wealth Management or for a complimentary risk assessment of your portfolio, click here to contact us.
Advisory services offered through Financial Sense Advisors, Inc., a registered investment adviser. Securities offered through Financial Sense Securities, Inc., Member FINRA/SIPC. DBA Financial Sense Wealth Management.
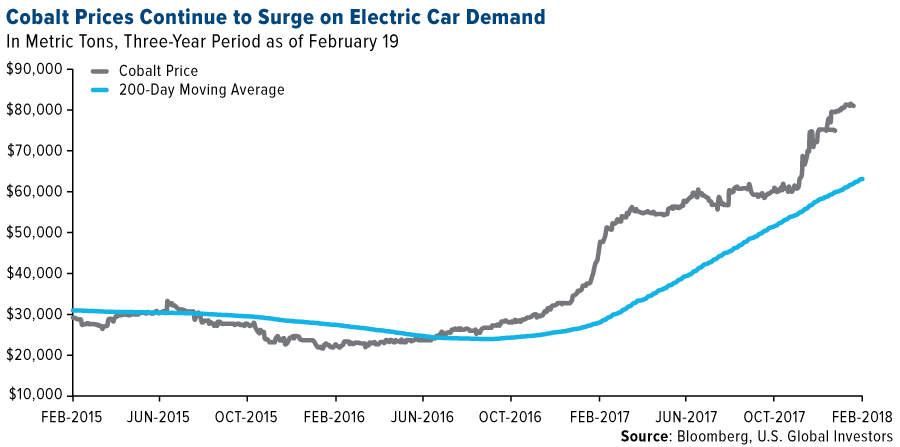
Cobalt has soared 180 percent in the past 3 years, driven by demand and a increasing absence of supply. There is lots of cobalt to be mined though and Apple has embarked on a program to buy directly from miners. With an imminent 8 bull market in commodities coming (Jack Crooks: The Next Big 8 Year Bull Market) Frank Holmes outlines the opportunities and describes one of the companies Apple is in negotion with – Robert Zurrer for Money Talks
 Disney’s Black Panther is in theaters right now, breaking all kinds of box office records and wowing audiences. The film features a fictional, highly-advanced African country known as Wakanda, whose vast wealth and prosperity are derived almost exclusively from the mining of a rare, fantastical metal called vibranium.
In its own colorful way, Black Panther does an excellent job dramatizing mining’s important role in supplying the world with much-needed raw materials. Vibranium is the basis for everything in the film, from the title character’s flashy superhero suit to Wakanda’s otherworldly infrastructure and vehicles, to its futuristic medicine and weaponry.
Like Wakanda, the real Africa is rich in minerals and metals, many of them extremely valuable. Think platinum and palladium in South Africa, diamonds in Botswana, copper in Zambia and cobalt in the Democratic Republic of the Congo.
Unfortunately, many African countries have not been managed as well as the one depicted in the film. Corruption and fiscal instability, coupled with inconsistencies in taxation and mining policies, make operating on the continent challenging for foreign producers, to say the least. Three years ago, I argued that Africa could mine its way to prosperity if only it addressed the hindrances that keep explorers and producers away. I stand by those words today.
Consider Congo, which produces roughly two-thirds of the world’s cobalt, an essential component in lithium-ion batteries. Lawmakers there recently voted to raise taxes and royalties on profits and metals produced. That includes cobalt, whose price has soared 180 percent in the past three years on red-hot electric vehicle (EV) demand. The country’s state-owned mining company, Gécamines SA, is also pushing the government to renationalize the entire mining industry.
Admittedly, the fictional Wakanda appears to have a nationalized metals and mining sector. But because the country is so advanced and self-sustaining, it has no need for outside investment. That’s not the case with many real-life African nations, which are literally, in some cases, sitting on a gold mine.
Cobalt Supply Shortage Could Boost Prices Even More
But let’s focus on cobalt for a moment. Global demand for the brittle, bluish-white metal has skyrocketed in recent months, exceeding 100,000 metric tons for the first time last year, according to mining consultant CRU Group. Over the next 10 years, it’s projected to grow at a compound annual growth rate (CAGR) of 11.6 percent.
And because around two-thirds of the world’s supply is mined in the highly unstable Congo, a supply shortage is likely brewing.
“There just isn’t enough cobalt to go around,” George Heppel, a CRU consultant, told Bloomberg in January. “The auto companies that’ll be the most successful in maintaining long-term stability in terms of raw materials will be the ones that purchase the cobalt and then supply that to their battery manufacturers.”

Apple to Buy Cobalt Directly from Miners
Automakers aren’t the only ones with this idea. Bloomberg reported last week that Apple, the world’s largest end user of cobalt, is in talks to buy the metal directly from miners. The move would help the iPhone-maker not only save many billions of dollars in the long term but also be more transparent about how the metal is sourced, as there have been concerns about illegal mining operations and the use of child labor.
Details are scarce at this point, but Bloomberg writes that “Apple is seeking contracts to secure several thousand metric tons of cobalt a year for five years or longer.”
One of the miners the company is rumored to be speaking with is Switzerland-based Glencore, the 14th largest company in the world by revenue as of 2016, according to the Fortune Global 500. This would make sense, as Glencore—the best-performing London-listed miner last year, finishing up 41 percent—has been positioning itself as the go-to supplier of cobalt and other metals that are used in so-called clean tech, including copper, nickel, and zinc.
Glencore Announces $2.9 Billion in Dividends in 2018
Glencore stock jumped more than 5 percent last Wednesday after the company reported phenomenal performance in 2017 that CEO Ivan Glasenberg describes as “our strongest on record.” Earnings before interest, taxes, depreciation, and amortization (EBITDA) rose 44 percent year-over-year, from $10.3 billion to $14.8 billion, led by higher commodity prices and “enhanced” mining margins.
Sure to make investors happy, the company also declared a distribution of $2.9 billion, or $0.20 per share, to be paid in two installments this year.
The earnings report made no mention of Apple—or smartphones, for that matter—but it did emphasize the high rate of growth in electric vehicle investment, which is expected to greatly benefit cobalt demand.
“Global automaker investments now total more than $90 billion, with at least $19 billion attributed to the U.S., $21 billion to China and $52 billion to Germany,” Glasenberg writes. “Volkswagen alone plans to spend $40 billion by 2030 to build electrified versions of over 300 models.”
Over the next three years, Glencore’s cobalt production growth is projected at 133 percent, followed by nickel at 30 percent and copper at 25 percent.
This year alone, the company believes it will produce as much as 39,000 metric tons of cobalt, up 42 percent from 27,400 tons last year.
Frank Holmes of US Global Investors
Curious about investment opportunities in cobalt and other natural resources? Click here!
All opinions expressed and data provided are subject to change without notice. Some of these opinions may not be appropriate to every investor. By clicking the link(s) above, you will be directed to a third-party website(s). U.S. Global Investors does not endorse all information supplied by this/these website(s) and is not responsible for its/their content.
The Consumer Price Index (CPI) is one of the most widely recognized price measures for tracking the price of a market basket of goods and services purchased by individuals. The weights of components are based on consumer spending patterns.
There is no guarantee that the issuers of any securities will declare dividends in the future or that, if declared, will remain at current levels or increase over time.
Holdings may change daily. Holdings are reported as of the most recent quarter-end. The following securities mentioned in the article were held by one or more accounts managed by U.S. Global Investors as of 12/31/2017: Glencore PLC.

-
I know Mike is a very solid investor and respect his opinions very much. So if he says pay attention to this or that - I will.
~ Dale G.
-
I've started managing my own investments so view Michael's site as a one-stop shop from which to get information and perspectives.
~ Dave E.
-
Michael offers easy reading, honest, common sense information that anyone can use in a practical manner.
~ der_al.
-
A sane voice in a scrambled investment world.
~ Ed R.
Inside Edge Pro Contributors

Greg Weldon

Josef Schachter

Tyler Bollhorn

Ryan Irvine

Paul Beattie

Martin Straith

Patrick Ceresna

Mark Leibovit

James Thorne

Victor Adair