
Wealth Building Strategies
 The warning signs that a market crash is looming are becoming louder and more frequent. Despite this, most market participants are behaving like it can never happen. In fact, bullish trading is pushing the markets to new highs on an almost daily basis. The warnings are seen, heard and then ignored.
Join the few who will take advantage of what’s about to happen. The same few who profited handsomely when billions were lost in the last global economic crisis almost a decade ago rather than those who simply follow the herd.
For most people these warnings are like the graphic images printed on today’s packets of cigarettes, they spell out the dangers and yet all the same people are still smoking.
Warnings about an impending market crash are being made by people who predicted with considerable accuracy in 2006 and 2007 what was ahead when the US sub-prime mortgage market collapsed and triggered the global financial crisis.
The one thing these analysts can’t predict is an exact time and place for when the crash will happen. It’s the same reason people continue to smoke; nobody can say with certainty the number of cigarettes required to kill a person.
So, trading continues regardless until the day the sudden dramatic drop in prices exceeds the 10 per cent threshold that officially marks the point that the crash has arrived.
Just as smokers only decide to stop when the physician says: “Mr Smith, I regret to inform you that you have lung cancer.”
Swiss investor Marc Faber, also known as “Dr Doom”, predicts that stocks are set to plunge by 40 per cent or more. Mr Faber, the editor of ‘The Gloom, Boom & Doom Report’ recently told CNBC: “We have a bubble in everything.”
His caution is echoed by Nobel Prize-winning economist Robert Professor Shiller who has urged investors to tread cautiously because market valuations are at “unusual highs”.
In a recent interview with CNBC, he said: “We are at a high level, and it’s concerning,” highlighting that the only times valuations have been higher were in 1929 and 2000.
Mark Zandi is chief economist at Moody’s Analytics. In August he joined the chorus of analysts preaching caution after determining that the stock market is overvalued.
In an article in Fortune he said: “The stock market is due for a significant correction” adding, “stock returns in the next several years will be very pedestrian if they increase at all.”
Last month HSBC issued a Red alert warning. They’re looking at two key levels: 17,992 in the Dow Jones Industrial Average and 2,116 in the S&P 500.
“As long as those levels remain intact, the bulls still have a slight hope. But should those levels break and the markets close below, which now seems more likely, it would be a clear sign that the bears have taken over and are starting to feast,” said head of technical analysis Murray Gunn. “The possibility of a severe fall in the stock market is now very high,” he added.
However, according to Bill Blain, a strategist at Mint Partners, this time bond markets will trigger the mayhem.
According to Blain, stock markets don’t matter. “The truth is in bond markets. And that’s where I’m looking for the dam to break. The great crash of 2018 is going to start in the deeper, darker depths of the credit market,” he said.
“I’m convinced bond markets are the real bubble we should be watching, and it’s going to start in high yield…”
Blain’s opinion on a bonds inspired crash is echoed by Niall Ferguson in his piece in The Sunday Times this month.
Ferguson was warning about the sub-prime mortgage crisis over a year before the crash occurred. He spoke publicly about it on many occasions and in his book The Ascent of Money spelling out the dangers in graphic detail, which was published just as his predictions were coming true.
He sees a bonds sell off as a result of a series of events that will bring about the next economic crisis.
Ferguson firstly points to the effect of interest rate increases by the big four central banks — the Fed, European Central Bank, Bank of Japan and Bank of England — when the rate of economic expansion has already started to slow.
He explains: “History shows that monetary tightening acts with long and variable lags. But it does act, often on stock markets.”
Ferguson also points to global wage and inflation increases as the second contributory factor as we approach a demographic inflection point where the ratio of workers to consumers has peaked.
This has led Ferguson to the conclusion that the end of the 35-year bond bull market is imminent. “Bonds will sell off; long-term rates will rise. The question is whether inflation will increase as much or more. If not, then real (inflation-adjusted) interest rates will rise, with serious implications for highly indebted entities.”
He points to two big economies, China and Canada, which are in particular trouble. You should probably add Australia to that list given its level of connectedness to China.
Despite being described with the same words, no two financial crises are the same. The next one will differ from the last one, that’s why they are so hard to put into an actionable timeframe. But the inevitability that there will be a next one increases as the monetary medication begins to be withdrawn, which makes the need for taking the right measures now all the more important.
FXB Trading’s experts are equally convinced that a significant market correction is imminent. They’ve devised a strategy to profit from the situation as many notable forward-thinking analysts did ahead of the 2008 sub-prime mortgage crash in the US which then caused the subsequent global financial crisis.
In the 2008 scenario their investment returned ratios of between 1:10 to 1:20. FXB’s traders will replicate the trade, but will also hedge their position.
Until the market crashed in 2008 those US traders were in a losing position, but by hedging it is possible to avoid losses until the crash occurs.

 Traders and investors everywhere are spooked by volatility whenever it rears its head. We hear about it every time stocks take a tumble, even if that doesn’t happen so much these days. So the Investopedia definition I’ll show you is probably the last thing they’re thinking of.
“Volatility: A statistical measure of the dispersion of returns for a given security or market index. Commonly, [emphasis mine] the higher the volatility, the riskier the security.”
Now, that doesn’t sound so scary, does it?
Volatility is nothing more than a statistical tool that shows how much a stock goes up or down. Yet many see volatility as a bad thing, because they equate it to risk. And risk is bad for us, right?
Well, sometimes risk is bad. But to the smart investor, volatility is a difference maker. Because without it, you might as well just buy a CD. More importantly, you have zero chance of beating the market. And where’s the fun in that?
That’s right: Without volatility, you don’t beat the market.
That’s why one of my 10 Trading Commandments is “Volatility is a trader’s best friend!”
Now, let me prove it to you…
Directional Volatility Takes You “FAR” as a Trader
Think about volatility as merely the distribution of a stock’s returns. The wider the distribution, the higher the volatility.
And the higher the volatility, the more the stock is moving, and that means we’re getting paid if it’s moving in our direction.
To beat the market, especially using options, we want volatility on our side. I call it the “FAR Principle” – fast, aggressive, and right.
I want a fast move to happen before my option expires. I need an aggressivemove that I can leverage with an option. And I need the move to be in the right direction to agree with my call or put.
Having volatility in my corner, along with picking the right direction, is how I (and you) get paid as an investor.
How to Find Volatility Before It Happens
 Understanding how volatility leads to profits is one thing. The key, though, is getting on board a stock before the volatility hits.
Watching a big move from the sidelines is no fun at all; you need to learn how to spot volatility before it happens.
One of my favorite indicators to identify potential volatility is the Bollinger Band.
This indicator measures volatility by looking at the distribution of price changes over a certain period.
I won’t get into the details here – you don’t need that stuff to start using it in your trading and investing. It’s enough to say that a break above the top Bollinger Band is often followed by a volatility rally, while a move below the bottom band often initiates a volatility sell-off.
But I go beyond these breaks above or below the bands. I also monitor the distance between the top and bottom bands to tell me when the volatility surge is about to happen. The tighter the bands get, the higher the probability that a volatility breakout is coming. Monitoring the distance between the bands positions me ahead of the wave of a volatility breakout.
But once we have our read on the Bollinger Bands, we still need to answer one more question – a big one, at that: Will it be a volatility rally or sell-off? This is where a few other technical tools come into play.
While keeping it simple is often the best approach, I tilt the scales in my favor by adding two straightforward technical criteria to find bullish FAR moves.
First, I want a stock that is trading above its 50-day moving average. Second, I want to see the 50-day in an uptrend. Combining those criteria with a break above the upper Bollinger Band increases the odds that a bullish volatility rally is in the works.
Here are a few stocks I’ve already analyzed for you, so you can try this yourself…
Adobe Systems (Nasdaq: ADBE) Breaking Out
Let’s look at Adobe Systems Inc., a stock that I feel is currently on the verge of a volatility rally. Here’s a chart of ADBE shares showing the Bollinger Bands andthat 50-day moving average.
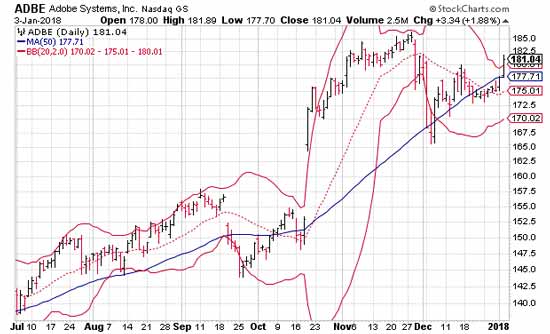
- This week, the distance between Bollinger Bands is approaching an annual low. This tells me the stock price is coiling like a spring, getting ready to make a big move.
- The 50-day moving average is in a very strong uptrend.
- On Wednesday, ADBE rallied well above the 50-day and broke above its top Bollinger Band.
Based on these bullish technical developments, I’m looking for a volatility rally that will push the stock above the $185 level over the short term.
If you want to ride along and make some fast money, consider the February $180 call.
There are all sorts of ways a stock can tell you that it wants to make you money. This is just one of them.
Next week, I’ll talk about how I use what they call “short interest” to put the trading odds in my favor… and big profits in my account. Until then, make volatility your friend; you’ll love the gains that are possible.
Before I publish my market outlook for 2018 in the days ahead I thought it might be useful to recap some lessons learned from 2017. While I want to focus on technical considerations some larger market context first is equally important.
The biggest mistake bears always make, myself included, is underestimate the sheer recklessness of bulls. They keep raising the bar higher and higher, get everyone positioned long and when the construct ultimately fails they beg for bailouts and artificial liquidity comes in to save an industry that is 100% reliant on convincing retail to put money into the system. This may seem a harsh assessment, but this has been the script for the last 30 years as we’ve transitioned from one market bubble to the next.
Bubbles are notorious for getting people sucked into believing things that are absolutely unrealistic. Multiples get expanded to high heaven on projections that never pan out. Every. single. time.
In this context it’s actually quite easy to be a bull. Keep raising targets, always be optimistic, and when something breaks shrug your shoulders and say: Hey what are you gonna do? Stuff happens, but the Fed will bail us out. And the cycle begins anew.
It’s a dangerous game for investors as Wall Street will look right for years and complacency breeds more complacency as bearish voices are ignored as they look wrong precisely at the time when they are the most right.
Take 1999. Bears were completely wrong, but also entirely correct. The bubble run-up was pure fantasy, but it kept going and going until the rug got pulled:

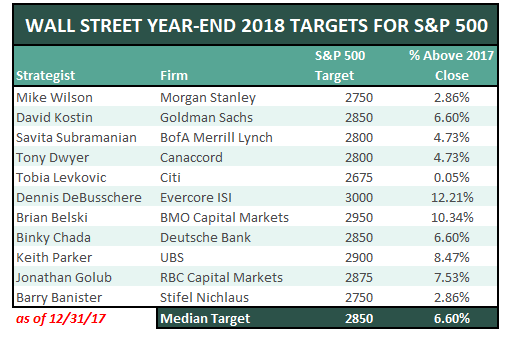
Similarly in 2007 nobody gave you warnings, and Wall Street kept pushing price targets higher for 2008:

And people got hurt big time every time.
The then predictable response: We need bailouts, must get rid of mark to market and the Fed obliged with QE 1, 2, 3 and global central banks joined the foray. And this has been the running game for over 8 years now:

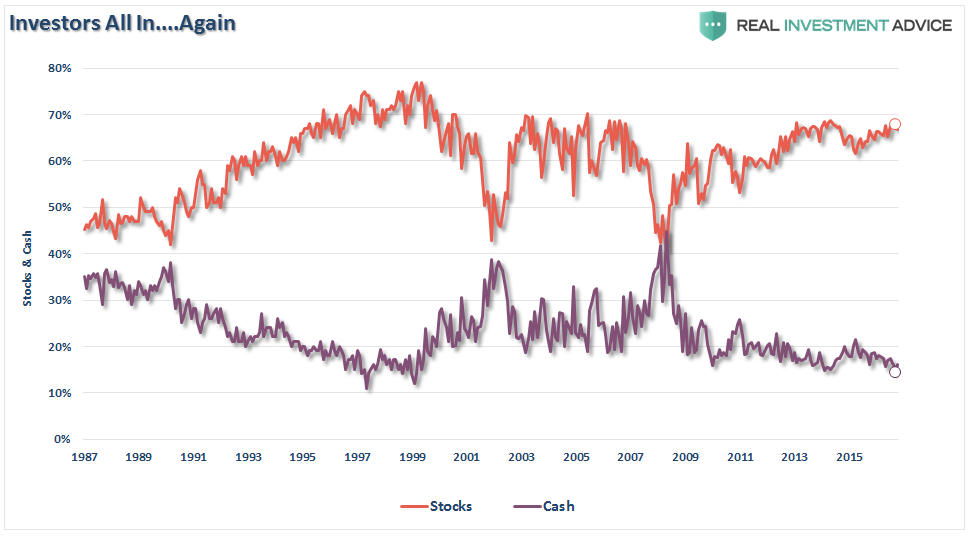
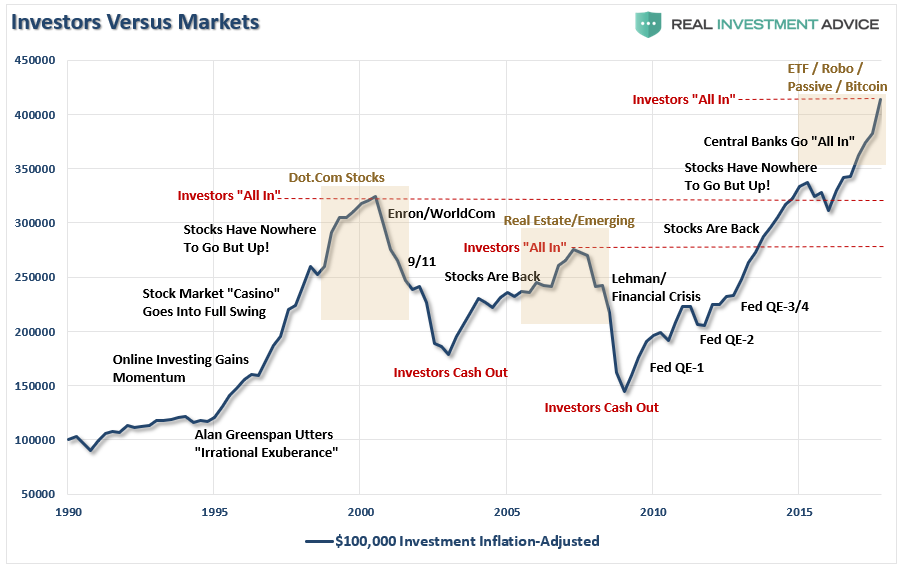
As I noted this past weekend, 2017 was a year for the record books. Not surprisingly, the strong advance fostered a surge in investor optimism which pushed allocations to equities to the second highest level on record.

And leveraged to boot.
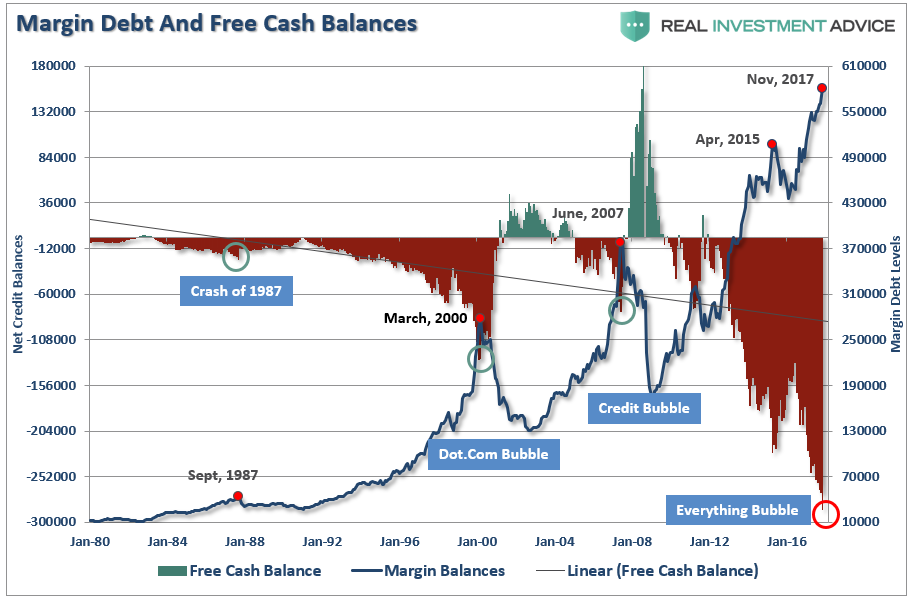
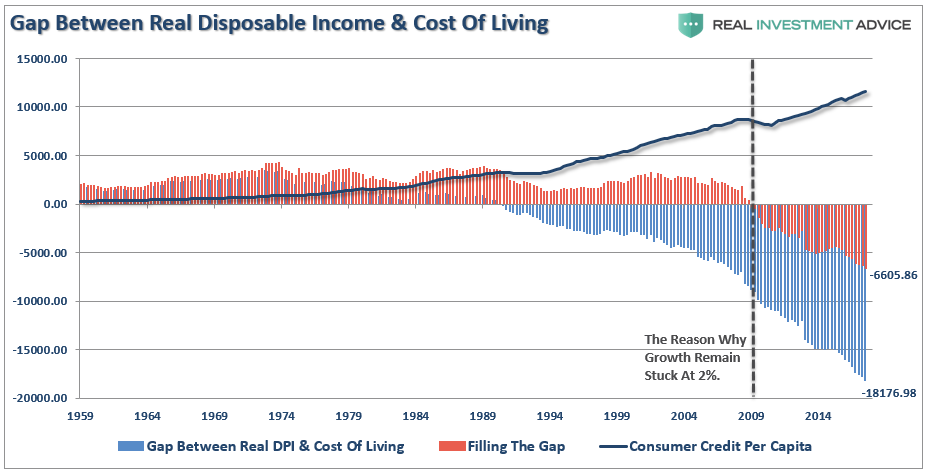
Importantly, don’t mistake record margin debt levels as people borrowing against their portfolio just to make larger investment bets. In reality, they are using leverage to support their lifestyle as well, after all, as long as stocks keep rising it’s like “free money.” Right?
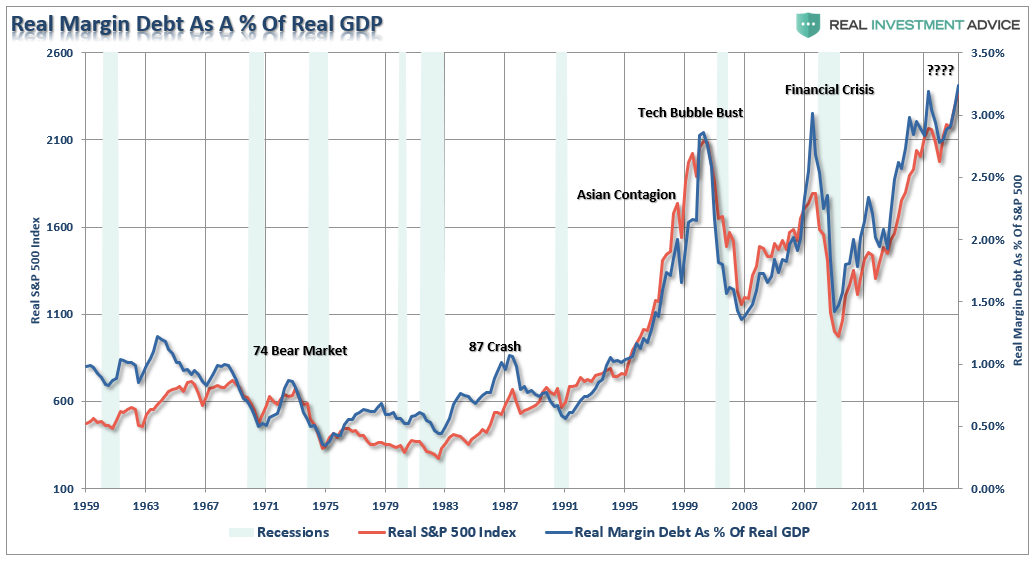
This is shown in both the level of debt used to support the standard of living and the relationship between real, inflation-adjusted, margin debt and economic growth.
Yes. Investors are optimistic.
The current level of exuberance, and the willingness by individuals to shun risk for the hopes of chasing wealth brought to mind Bob Farrell’s 10-Investment Rules.
Particularly “Rule #9.”
I have penned these previously, but these rules should be a staple for any investor who has put their hard earned “savings” at risk in the market. These rules, which are rarely heeded in the heat of bull market, are worth revisiting as we enter into 2018.
The Illustrated 10-Rules Of Investing
-
Markets tend to return to the mean (average price) over time.
Like a rubber band that has been stretched too far – it must be relaxed in order to be stretched again. This is exactly the same for stock prices which are anchored to their moving averages. Trends that get overextended in one direction, or another, always return to their long-term average. Even during a strong uptrend or strong downtrend, prices often move back (revert) to a long-term moving average. The chart below shows the S&P 500 with a 52-week simple moving average.
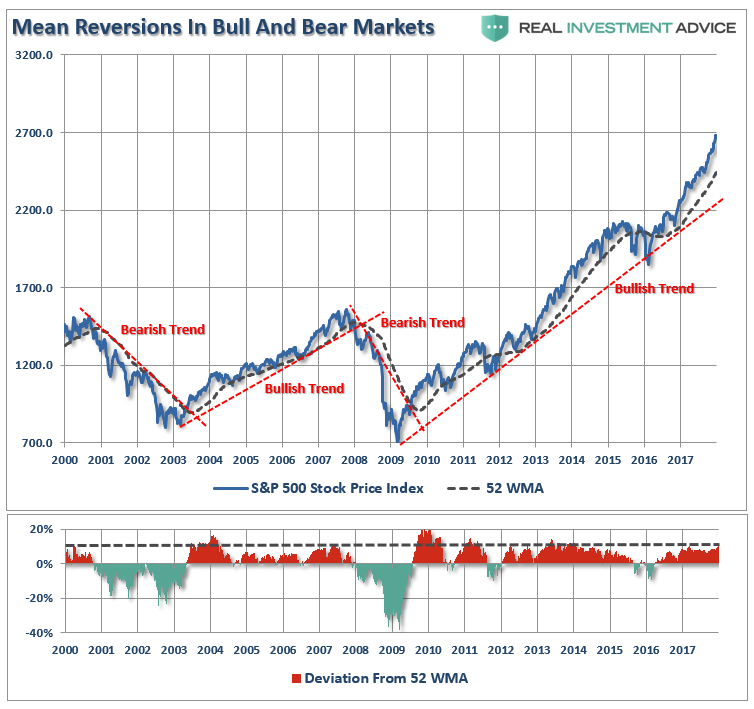
The bottom chart shows the percentage deviation of the current price of the market from the 52-week moving average. During bullish trending markets, there are regular reversions to the mean which create buying opportunities. However, what is often not stated is that in order to take advantage of such buying opportunities profits should have been taken out of portfolios as deviations from the mean reached historical extremes. Conversely, in bearish trending markets, such reversions from extreme deviations should be used to sell stocks, raise cash and reduce portfolio risk rather than “panic sell” at market bottoms.
The dashed RED lines denote when the markets changed trends from positive to negative. This is the very essence of portfolio “risk” management.
-
Excesses in one direction will lead to an opposite excess in the other direction.
Markets that overshoot on the upside will also overshoot on the downside, kind of like a pendulum. The further it swings to one side, the further it rebounds to the other side. This is the extension of Rule #1 as it applies to longer-term market cycles (cyclical markets).
While the chart above showed prices behave on a short-term basis – on a longer-term basis markets also respond to Newton’s 3rd law of motion: “For every action, there is an equal and opposite reaction.”
As I showed in “How Investors Are Dealt A Losing Hand:”
Our chart of the day is a long-term view of price measures of the market. The S&P 500 is derived from Dr. Robert Shiller’s inflation adjusted price data and is plotted on a QUARTERLY basis. From that quarterly data I have calculated:
- The 12-period (3-year) Relative Strength Index (RSI),
- Bollinger Bands (2 and 3 standard deviations of the 3-year average),
- CAPE Ratio, and;
- The percentage deviation above and below the 3-year moving average.
- The vertical RED lines denote points where all measures have aligned
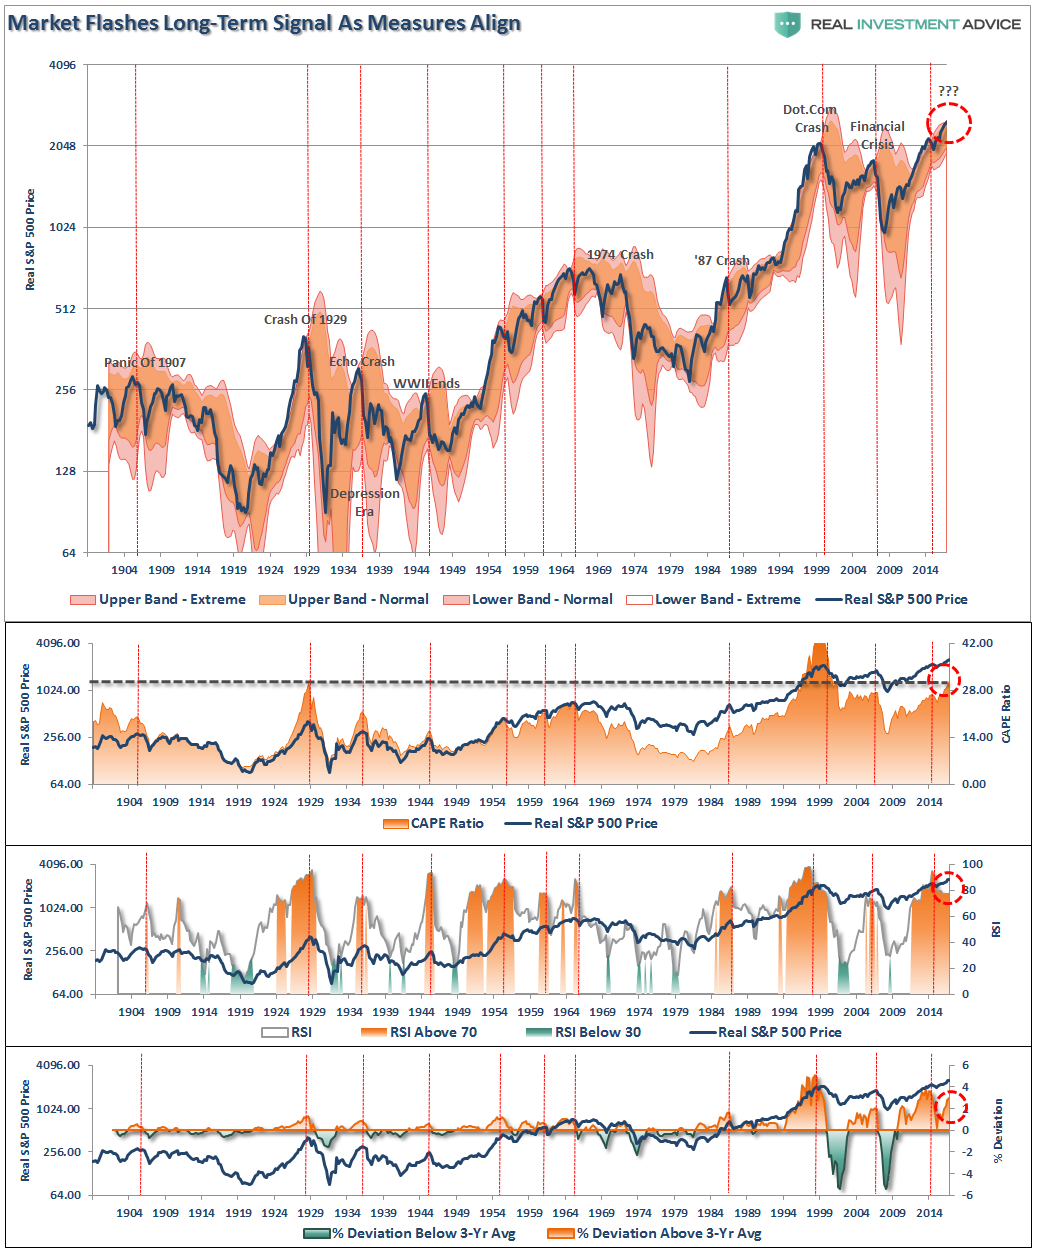
As the chart clearly shows, “prices are bound by the laws of physics.” While prices can certainly seem to defy the law of gravity in the short-term, the subsequent reversion from extremes has repeatedly led to catastrophic losses for investors who disregard the risk.
-
There are no new eras – excesses are never permanent.
There will always be some “new thing” that elicits speculative interest. These “new things” throughout history, like the “Siren’s Song,” has led many investors to their demise. In fact, over the last 500 years, we have seen speculative bubbles involving everything from Tulip Bulbs to Railways, Real Estate to Technology, Emerging Markets (5 times) to Automobiles and Commodities.
[The chart below is from my March 2008 seminar discussing that the next recessionary bear market was about to occur.]
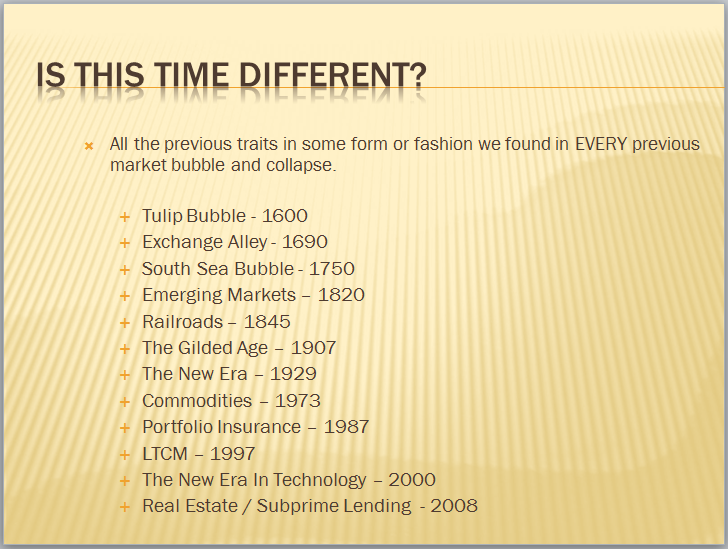
We will likely add “Bitcoin” to this list in the not-so-distant future?
It always starts the same and ends with the utterings of “This time it is different”
As legendary investor Jesse Livermore once stated:
“A lesson I learned early is that there is nothing new on Wall Street. There can’t be because speculation is as old as the hills. Whatever happens in the stock market today has happened before and will happen again.”
-
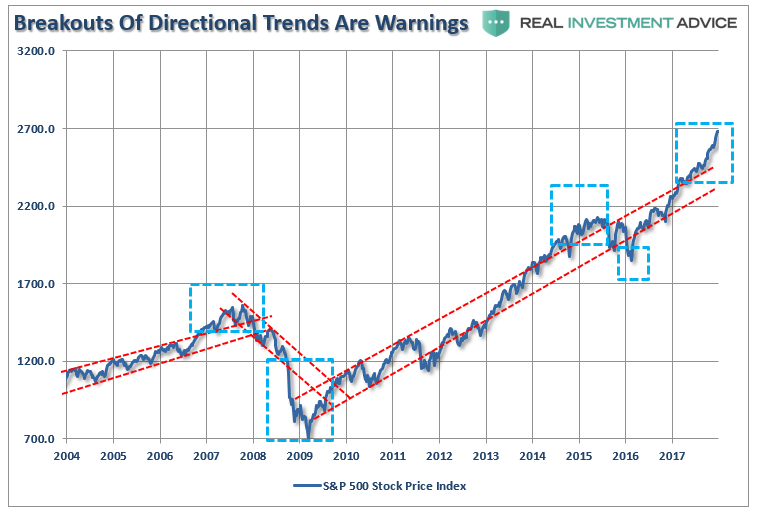
Exponential rapidly rising or falling markets usually go further than you think, but they do not correct by going sideways
The reality is that excesses, such as we are seeing in the market now, can indeed go much further than logic would dictate. However, these excesses, as stated above, are never worked off simply by trading sideways. Corrections are always just as brutal as the advances were exhilarating. As the chart below shows when the markets broke out of their directional trends – the corrections came soon thereafter.
-
The public buys the most at the top and the least at the bottom.
The average individual investor is most bullish at market tops and most bearish at market bottoms. This is due to investor’s emotional biases of “greed” when markets are rising and “fear” when markets are falling. Logic would dictate that the best time to invest is after a massive sell-off; unfortunately, this is exactly the opposite of what investors do.
-
Fear and greed are stronger than long-term resolve.
As stated in Rule $5 it is emotions that cloud your decisions and affect your long-term plan.
“Gains make us exuberant; they enhance well-being and promote optimism,” says Santa Clara University finance professor Meir Statman. His studies of investor behavior show that “Losses bring sadness, disgust, fear, regret. Fear increases the sense of risk and some react by shunning stocks.”
The chart shows the ratio of bearish funds to bullish funds as compared to the volatility index (VIX) and the ratio of bullish to bearish assets. Rarely have such extremes previously been seen.
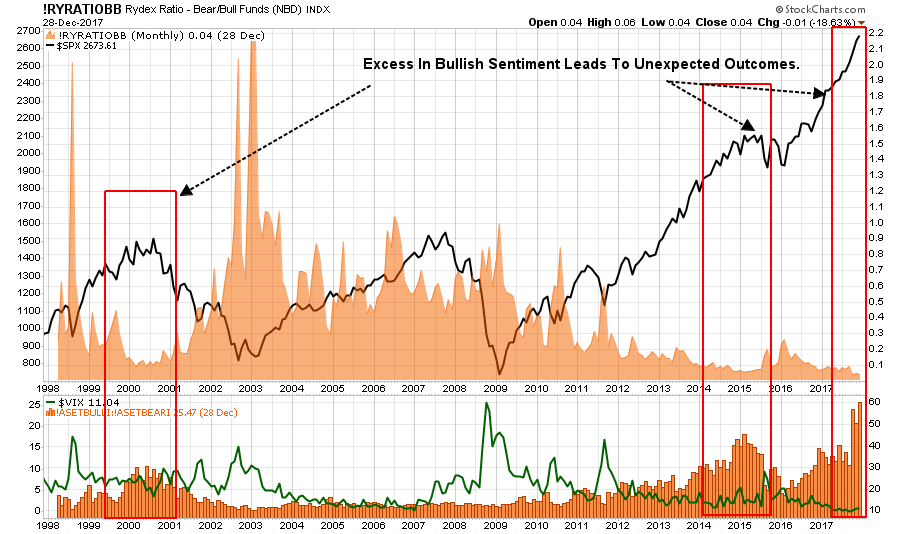
In the words of Warren Buffett:
“Buy when people are fearful and sell when they are greedy.”
Currently, those “people” are getting extremely greedy.
-
Markets are strongest when they are broad and weakest when they narrow to a handful of blue-chip names.
Breadth is important. A rally on narrow breadth indicates limited participation and the chances of failure are above average. The market cannot continue to rally with just a few large-caps (generals) leading the way. Small and mid-caps (troops) must also be on board to give the rally credibility. A rally that “lifts all boats” indicates far-reaching strength and increases the chances of further gains.
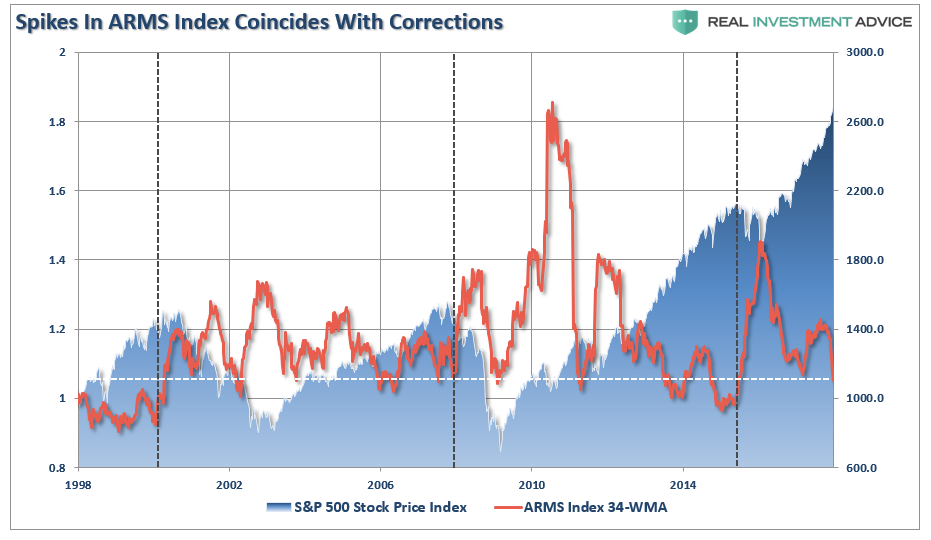
The chart above shows the ARMS Index which is a volume-based indicator that determines market strength and breadth by analyzing the relationship between advancing and declining issues and their respective volume. It is normally used as a short-term trading measure of market strength. However, for longer-term periods the chart shows a weekly index smoothed with a 34-week average. Spikes in the index has generally coincided with near-term market peaks.
-
Bear markets have three stages – sharp down, reflexive rebound and a drawn-out fundamental downtrend
Bear markets often start with a sharp and swift decline. After this decline, there is an oversold bounce that retraces a portion of that decline. The longer-term decline then continues, at a slower and more grinding pace, as the fundamentals deteriorate. Dow Theory suggests that bear markets consist of three down legs with reflexive rebounds in between.
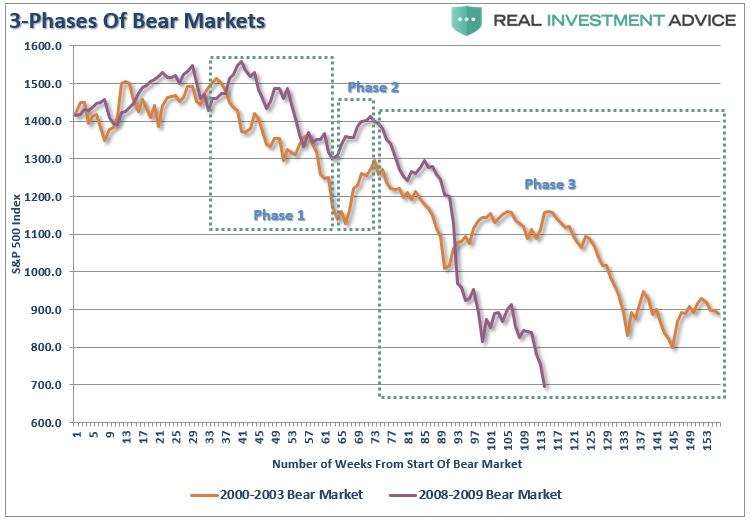
The chart above shows the stages of the last two primary cyclical bear markets. The point to be made is there were plenty of opportunities to sell into counter-trend rallies during the decline and reduce risk exposure. Unfortunately, the media/Wall Street was telling investors to just “hold on” until hey finally sold out at the bottom.
-
When all the experts and forecasts agree – something else is going to happen.
This rule fits within Bob Farrell’s contrarian nature. As Sam Stovall, the investment strategist for Standard & Poor’s once stated:
“If everybody’s optimistic, who is left to buy? If everybody’s pessimistic, who’s left to sell?”
As a contrarian investor, and along with several of the points already made within Farrell’s rule set, excesses are built by everyone being on the same side of the trade. Ultimately, when the shift in sentiment occurs – the reversion is exacerbated by the stampede going in the opposite direction
Currently, everyone on Wall Street is optimistic 2018 will turn in another positive year making it the longest streak in history of positive return years for the market.
Being a contrarian can be quite difficult at times as bullishness abounds. However, it is also the secret to limiting losses and achieving long-term investment success. As Howard Marks once stated:
“Resisting – and thereby achieving success as a contrarian – isn’t easy. Things combine to make it difficult; including natural herd tendencies and the pain imposed by being out of step, since momentum invariably makes pro-cyclical actions look correct for a while. (That’s why it’s essential to remember that ‘being too far ahead of your time is indistinguishable from being wrong.’)
Given the uncertain nature of the future, and thus the difficulty of being confident your position is the right one – especially as price moves against you – it’s challenging to be a lonely contrarian.”
-
Bull markets are more fun than bear markets
As stated above in Rule #5 – investors are primarily driven by emotions. As the overall markets rise; up to 90% of any individual stock’s price movement is dictated by the overall direction of the market hence the saying “a rising tide lifts all boats.”
Psychologically, as the markets rise, investors begin to believe that they are “smart” because their portfolio is going up. In reality, it is primarily more a function of “luck” rather than “intelligence” that is driving their portfolio.
Investors behave much the same way as individuals who addicted to gambling. When they are winning they believe that their success is based on their skill. However, when they began to lose, they keep gambling thinking the next “hand” will be the one that gets them back on track. Eventually – they leave the table broke.
It is true that bull markets are more fun than bear markets. Bull markets elicit euphoria and feelings of psychological superiority. Bear markets bring fear, panic, and depression.
What is interesting is that no matter how many times we continually repeat these “cycles” – as emotional human beings we always “hope” that somehow this “time will be different.” Unfortunately, it never is and this time won’t be either. The only questions are: when will the next bear market begin and will you be prepared for it?
Conclusions
Like all rules on Wall Street, Bob Farrell’s rules are not meant has hard and fast rules. There are always exceptions to every rule and while history never repeats exactly it does often “rhyme” very closely.
Nevertheless, these rules will benefit investors by helping them to look beyond the emotions and the headlines. Being aware of sentiment can prevent selling near the bottom and buying near the top, which often goes against our instincts.
Regardless of how many times I discuss these issues, quote successful investors, or warn of the dangers – the response from both individuals and investment professionals is always the same.
“I am a long-term, fundamental value, investor. So these rules don’t really apply to me.”
No, you’re not. Yes, they do.
Individuals are long term investors only as long as the markets are rising. Despite endless warnings, repeated suggestions and outright recommendations; getting investors to sell, take profits and manage your portfolio risks is nearly a lost cause as long as the markets are rising. Unfortunately, by the time the fear, desperation, or panic stages are reached, it is far too late to act and I will only be able to say that I warned you.
Lance Roberts

Lance Roberts is a Chief Portfolio Strategist/Economist for Clarity Financial. He is also the host of “The Lance Roberts Show” and Chief Editor of the “Real Investment Advice” website and author of “Real Investment Daily” blog and “Real Investment Report“. Follow Lance on Facebook, Twitter and Linked-In
After holding onto huge, unprofitable long positions for months, gold and silver futures speculators are finally giving up and bailing out, while commercial traders (who take the opposite side of these trades, since every long requires an offsetting short) are closing out their shorts at a near-record pace.
Here’s the gold data for last week, courtesy ofGoldSeek. Note the massive shift by speculators from long to short. They’re not in balance yet (where longs and shorts are equal) but they’re heading that way fast.

In silver, they’re just about in balance, which is historically about as far they usually go:

Here’s the same data for gold in graphical form with the silver bars representing speculator longs and the red showing commercial shorts. Note the long plateau followed by a rush to the middle, which is where rallies tend to begin.

One more week like the last two would put this indicator in screaming buy territory, but even if this is as far as it goes it’s still positive for January – which is a seasonally strong time for precious metals in any event.
For individual speculators, that means the junior miners are – again based on this one indicator – pretty good trades for the next few months.

-
I know Mike is a very solid investor and respect his opinions very much. So if he says pay attention to this or that - I will.
~ Dale G.
-
I've started managing my own investments so view Michael's site as a one-stop shop from which to get information and perspectives.
~ Dave E.
-
Michael offers easy reading, honest, common sense information that anyone can use in a practical manner.
~ der_al.
-
A sane voice in a scrambled investment world.
~ Ed R.
Inside Edge Pro Contributors

Greg Weldon

Josef Schachter

Tyler Bollhorn

Ryan Irvine

Paul Beattie

Martin Straith

Patrick Ceresna

Mark Leibovit

James Thorne

Victor Adair