
Featured Article
Two of the questions I get most often these days are, “What kind of cycle are we in?” and “Where do we stand in it?” My main response is that the developments of the last five months are non-cyclical in nature, and thus not subject to the usual cycle analysis.
The normal cycle starts off from an economic and market low; overcomes psychological and capital market headwinds; benefits from gathering strength in the economy; witnesses corporate results that exceed expectations; is amplified by optimistic corporate decisions; is reinforced by increasingly positive investor sentiment; and thus fosters rising prices for stocks and other risk assets until they become excessive at the top (and vice versa on the downside). But in the current case, a moderate recovery – marked by reasonable growth, realistic expectations, an absence of corporate overexpansion and a lack of investor euphoria – was struck down by an unexpected meteor strike.
People also ask what’s different about this episode from those I’ve lived through in the past.
Another frequent question is, “What shape will the economic recovery take?” Everyone has his or her favorite candidate: a W, an L, a U or maybe a Nike Swoosh. Of course, the one we hear the most about is a V. While the terminology used isn’t crucial, and may basically be just a matter of semantics, I find the label “V-shaped” misleading.
Of all the people who use the label “V-shaped” to describe this recovery, I don’t think I’ve ever seen anyone define it. To me, a “V” has to satisfy two important requirements: Full Article
THIS MONTH, ADVERTISING giant WPP will send unusual corporate training videos to tens of thousands of employees worldwide. A presenter will speak in the recipient’s language and address them by name, while explaining some basic concepts in artificial intelligence. The videos themselves will be powerful demonstrations of what AI can do: The face, and the words it speaks, will be synthesized by software.
WPP doesn’t bill them as such, but its synthetic training videos might be called deepfakes, a loose term applied to images or videos generated using AI that look real. Although best known as tools of harassment, porn, or duplicity, image-generating AI is now being used by major corporations for such anodyne purposes as corporate training. Read More
June sales increased along with the average price, major win for the bulls? Not even close, the headlines can be deceiving. Once you take deeper dive the recent data is very bleak. The accepted offers in June 2020 are the lowest June in the past 15 years. Homes sold for a higher price than the month before but, for the first time in a quarter, and only up 2% from May.
Even during a downtrend the prices will create higher low data points while still trending lower to find the bottom. Some have stated that the Corona Virus shut down will create a pent up demand, I hope this isn’t the demand they were anticipating because it’s a blip on the charts.
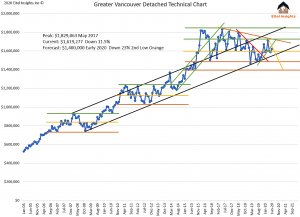
The average sales price for June came in at 1.619Million, signalling the first positive data point since February. July will be hugely important in setting the next short term trend for the Greater Vancouver price chart. If the July is lower than 1.619Million there is a strong likelihood that a new aggressive downtrend will be established. The possible downtrend is indicated with the yellow downtrend marker. We have purposely used yellow as we need confirmation before the downtrend is established.
One anticipated trend that we have spoken on before is now coming to fruition, that being, the high end market is selling more readily than the lot value properties. Buyers are wanting the most bang for their buck and as a result they want the 17Million dollar mansion for 12Million and one such sale took place in June. Not too many buyers are purchasing spec land, this has an effect on the average price. Which means once those foreclosures roll in, and investors begin to dip their toes in the water. That will shift the focus from trying to buy the high end on the cheap to buying homes near lot value.
This also indicates that even while mansions are selling for very high numbers, the average price is still in the middle of the market threshold. Once the foreclosures hit and inventory is high, investors will begin buying deeply discounted lots which will force the average price to further decline. Then the market will panic, but in reality, the investors buying lower valued properties will indeed force the prices to drop but simultaneously be creating the market bottom. The pricing bottom will likely occur at 1.40 million if this threshold breaks we look to 1.225Million as the next threshold.
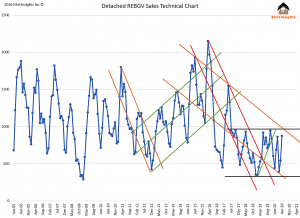
Detached Sales could be interpreted as “six of one and a half dozen of the other”. Simply meaning you will hear likely hear that the June 2020 sales were the highest over the preceding two year. Technically true, but the June 2020 sales was the lowest excluding the previous two year over the previous 15 years. Don’t let the language fool you when you hear best June in the previous two years. The past three years of June sales data are the lowest in the past 15 years. Not a great trend to be a part of yet Realtors and the Real Estate Boards will likely tout this as a win.
Another truth even though it may hurt some, the pricing peak for the market occurred in 2017, However sales numbers began to tank substantially since the frenzied mentality of 2015 & 2016. Sales numbers have not exceeded 1000 since June 2017, while the average over the previous 15 years is 1050. The reality is the Greater Vancouver detached market has been trending lower for many years already, while most analysts and definitely the GVRD real estate board have been saying we were nearing the end of the tunnel by being able to see light in 2019… Eitel Insights warned that the light was a train, not the end of the tunnel.
Last truth, we know sales are from previous months accepted offers. The accepted offers in June 2020 were only 561 and the absolute lowest June in the past 15 years. For context June 2019 accepted offers were 804, June 2018 were 755, June 2017 were 1,216, June 2016 were 1,446, June 2015 were 1,816. So much for best in the past 3 years, Eh? (Happy Canada Day)
Sales are not good nor are they average in fact they are paltry, inventory is on the rise and will continue into 2021. None of this bodes well for prices in the short term.
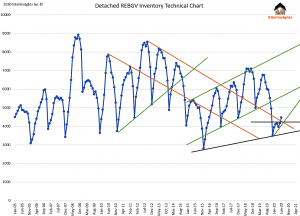
Inventory finally surpassed 4200 active listings which hadn’t occurred since December 2019. The inventory currently sits at 4471. Once the mortgage deferral system comes to an end the inventory will rise rapidly.
Over the upcoming year an odd phenomenon will occur to the buyer’s mindset. Far from the chaos of 2015-2016 when frenzied buyers lined up and fought over who would pay the most in history for a home. Into 2021 a whole new kind of methodology will prevail, the fear of overpaying for a depreciating asset. When inventory is at the highs prices will be at the lows but purchasers will be fearful when they should be strong.
With all that said, purchasing when a market is actually at the lows of the cycle is a great idea .Eitel Insights will be releasing a full market analysis for Greater Vancouver in the upcoming week. We proudly announce that Eitel Insights will be promoted by Michael Campbell’s Money Talks. In this report we analyze all 20 markets inside of Greater Vancouver and update the data monthly so you can know exactly when and where the opportunities reside, which are currently rare but do exist right now.
With our newest product release you will know exactly where each market inside of Greater Vancouver is with respect to the individual market cycles, for prices, inventory, sales, moving averages, strength index, and our unique supply demand chart. Use our analytical interpretation for your actionable intelligence.
Not all markets in Greater Vancouver are created equal, some areas are closer to the bottom. While others still have significant percentage losses upcoming. Become an Eitel Insights client to find out which are which.
Dane Eitel
Founder & Lead Analyst, Eitel Insights
604 813-1418
Watch Eitel Insight’s Latest Video:
This week Josef explains how the EIA had a third increase in total stocks which is creating a storage problem. As well as how the OPEC’s report out Wednesday the 17th showed significant non compliance and it is very likely crude will fall sharply in the near term.
Each week Josef Schachter will give you his insights into global events, price forecasts and the fundamentals of the energy sector. Josef offers a twice monthly Black Gold newsletter covering the general energy market and 28 energy and energy service companies with regular updates. He holds quarterly subscriber webinars and provides Action BUY and SELL Alerts for paid subscribers. Learn more and subscribe.
EIA Weekly Data: Wednesday June 17th’s EIA data was mostly bearish. The headline number of commercial crude stocks showed a rise of 1.27Mb versus the estimated 130K build. The Strategic Petroleum Reserve added 1.7Mb and now stands at 651.7Mb or nearly 38 days of current demand. The rise in commercial crude stocks would have been higher except net imports fell 245Kb/d or 1.72Mb on the week. Motor gasoline stocks fell 1.7Mb and Distillates fell by 1.4Mb. Overall stocks rose this week by 8.8Mb (compared to a rise of 11.9Mb last week). Total stocks are now up 141.8Mb over last year. Commercial crude oil stocks are now up 11.8% from 56.9Mb last year. Refinery runs rose 0.7% to 73.8% from 73.1% in the prior week. Cushing saw a decline of 2.6Mb to 46.8Mb as refinery activity consumed more crude.
US production of crude fell by a whopping 600Kb/d to 10.5Mb/d (all in the lower 48) and is now down 2.6Mb/d from the peak in mid-March at 13.1Mb/d. We are surprised by the large size of the shut-in. It is possible we are looking at data that removes production from bankrupt entities. There were a number of new filings last week for Chapter 11 insolvency.
Product supplied backed off from the strong consumption during the Memorial holiday weekend. Total product usage fell by 283Kb/d to 17.29Mb/d and is down 3.53Mb/d or 17% from 20.8Mb/d consumed last year at this time. Finished motor gasoline demand fell by 31K to 7.87Mb/d, but is down 21% from 9.93Mb/d last year. Jet fuel demand continues to rise modestly as more flights start up and consumption rose last week by 76Kb/d to 788Kb/d. However, it is still 885Kb/d lower or 53% less than last year’s 1.67b/d.
Baker Hughes Rig Data: Last week Friday the Baker Hughes rig survey showed a decline in the US rig count of 5 rigs (prior week down 17 rigs) to 279 rigs and down 71% from 969 rigs working a year ago. The Permian had a rig loss of 4 rigs (last week down 7 rigs) or down by 69% from a year earlier level of 441 rigs. The US oil rig count fell by 7 to 199 rigs (down 16 rigs last week) and down 75% from 788 rigs working last year. Canada’s rig count was flat at 21 rigs working but is down 80% from 107 rigs working at this time last year. The rate of weekly rig releases has clearly decelerated and we are close to the bottom for this key energy service sector activity indicator. Last week we saw the first green shoot with the Haynesville showing a rig count increase of two rigs to 33 rigs.
OPEC Monthly Data: OPEC today released their June 2020 monthly issue. They see demand at 81.3M/d in Q2/20 rising nearly 11Mb/d to 92.3Mb/d in Q3/20. Their big assumption is that China demand rises to 12.55Mb/d in Q2/20 from 10.27Mb/d in Q1/20 and OECD demand rebounds meaningfully. We suspect this may be high due to weak consumer demand in the OECD and the recent lock-down in Beijing due to the recent Covid-19 breakout. The report shows non-OPEC production falling 4.1Mb/d from 66.5Mb/d in Q1/20 to 61.4Mb/d in Q2/20. This fits with what we are seeing from the weekly EIA data and the reports from Canada. OPEC cut overall production in May 2020 by 6.3Mb/d to 24.2Mb/d with the Saudi’s taking the largest cutback at 3.16Mb/d. UAE helped with a 1.36Mb/d cut as did Kuwait with a 921Kb/d cut. As we suspected, other OPEC countries did not partially or fully meet their quota. Angola cut only by 33Kb/d to 1.28Mb/d, Iran raised production by 5Kb/d to 1.978Mb/d, Iraq cut only 340Kb/d versus the over 1.0Mb/d cut allocated and Nigeria cut by only 185Kb/d to 1.59Mb/d. Overall compliance appears to be 2-3Mb/d less than needed. OPEC in the report shows that the call on OPEC in Q2/20 is 14.6Mb/d and with production of 24.2Mb/d there is still an inventory build of 9.6Mb/d. So the deal last week to extend the cuts to the end of July does nothing to balance supply and demand. In the OPEC report they show Q2/20 demand at 81.3Mb/d, non-OPEC production at 61.4Mb/d, OPEC NGL’s at 5.3Mb/d leaving a call on OPEC of only 14.6Mb/d. They spin their positive story showing demand rising 11.0Mb/d to 92.3Mb/d in Q3/20 with non-OPEC production falling by 2.1Mb/d in Q3/20 to 59.3Mb/d. Under this view they show demand for OPEC crude rising to 27.8Mb/d and inventories worldwide starting to shrink. Our biggest disagreement is that we don’t buy their large increase in world demand for Q3/20 that they forecast.
Conclusion: As we write this, WTI is at US$37.43/b for the July contract (down US$0.95/b on the day) due to the overall inventory build. After a robust short covering rally of nearly 90% from the April low to US$40.44/b on Monday, crude prices have now rolled over and are down over 7%. We see a decline below US$30/b as the line in the sand for crude oil bulls (US$34.36/b next breakdown level). The breach of US$30/b should start the next phase of worry for energy bulls and restart aggressive selling of energy and energy service stocks. Much lower levels are expected once we get into the fall and the wage support programs by the governments end, and layoffs pick up and we see more bankruptcies. In addition this is also the window for the next expected Covid-19 wave. The energy and energy service companies with the most downside are those with high debt loads, high operating costs, have current balance sheet debt maturities of some materiality over the next 12 months and those that produce heavier barrels. Hold cash and remain patient for the next low risk BUY window as we saw in mid-March. If over-invested take appropriate defensive action.
The short covering rally of the last few weeks took the S&P Energy Bullish Percent Index from 0% on March 9th to 100% two weeks ago (84.6% now after stock market decline of the last two weeks). As the general stock market has declined, we expect to see the energy sector fall heavily as well. The Energy Bullish Percent Index is likely in this situation to fall to below 10%, providing the next low risk BUY signal. For the S&P/TSX this means a decline to below 40 for the Index, or nearly a two for one sale – OUCH! In a few days we see the next general market plunge starting. Downside for the Dow Jones Industrials in the near term 22,800 with much lower levels in July/August.
The S&P Energy Index today is at 78.82 (down 11% from last week’s level of 88.60) and down from the recent bear market rally high of 96.07 (Index down 18% from this recent high of two weeks ago). Be prepared for significantly lower energy and energy service stock prices in the coming weeks. Next downside breach is 76.50 (one bad market day away).
High risk tolerant speculative ownership of crude oil futures continues to rise crude. Last week speculators owned a net long position of 572Mb up modestly from 570Mb the week before. Commercials are adding more aggressively to positions and are now short 617Mb up from 605Mb the week before. Speculators are usually wrong and we expect them to get smacked hard once the current stock market decline has massive intermarket margin calls. At the next bottom in crude prices It is possible that commercials will move to net long position..
Our June SER Monthly Report will come out tomorrow. We go over the current market conditions and our key reason why we see an imminent breakdown in the overall stock markets that will drag energy stocks down as well. In our corporate update section we cover one of our favourite international ideas which just successfully completed its debt refinancing with a two year extension and covenant relief.
Subscribe to the Schachter Energy Report and receive access to our Webinar from Thursday May 28th, our Action Alerts, our TOP PICK recommendations when the next BUY signal occurs as well as our Quality Scoring System review of the 28 companies that we cover.
To get access to our research please go to http://bit.ly/2OvRCbP to subscribe.
(Note: Please share this comment on Facebook and Twitter. If you know someone who would enjoy our articles please recommend they visit our website and sign up for our free eblast.)
Most European brick-and-mortar clothing stores have been open for three or four weeks, yet sales continue to languish. In April, when all but the essential brick-and-mortar stores were shut, sales of clothing and accessories slumped by 50% in the UK and 67.4% in France, the home of fashion. In Spain, revenues in the sector plunged by 80.5%, according to data published by the trade association Acotex.
But even in May, when stores in most Spanish cities reopened, revenues in the sector fell 72% year over year and are down 45% year to date. Those figures include booming online sales.
“The textile and accessories trade is in a very delicate spot, requiring urgent and specific measures for the sector,” warned Acotex. In other words, government help and money. Otherwise, the trade association said, there will soon be a wave of bankruptcies and closings…CLICK for complete article
-
I know Mike is a very solid investor and respect his opinions very much. So if he says pay attention to this or that - I will.
~ Dale G.
-
I've started managing my own investments so view Michael's site as a one-stop shop from which to get information and perspectives.
~ Dave E.
-
Michael offers easy reading, honest, common sense information that anyone can use in a practical manner.
~ der_al.
-
A sane voice in a scrambled investment world.
~ Ed R.
Inside Edge Pro Contributors

Greg Weldon

Josef Schachter

Tyler Bollhorn

Ryan Irvine

Paul Beattie

Martin Straith

Patrick Ceresna

Mark Leibovit

James Thorne

Victor Adair