
Uncategorized
In the early days of the COVID-19 panic—back in mid-March—articles began to appear pushing the idea of “flattening the curve” (the Washington Post ran an article called “Flatten the Curve” on March 14). This idea was premised on spreading out the total number of COVID-19 infections over time, so as to not overburden the healthcare infrastructure. A March 11 article for Statnews, summed it up:
“I think the whole notion of flattening the curve is to slow things down so that this doesn’t hit us like a brick wall,” said Michael Mina, associate medical director of clinical microbiology at Boston’s Brigham and Women’s Hospital. “It’s really all borne out of the risk of our health care infrastructure pulling apart at the seams if the virus spreads too quickly and too many people start showing up at the emergency room at any given time.”
In those days, it was still considered madness to suggest outlawing jobs for millions of Americans or “shutting down” entire national economies in an effort to “flatten the curve.” Thus, the article lists for more moderate mitigation strategies…CLICK for complete article
Greater Vancouver’s Detached Market Drops Over 100 Thousand dollars in April.
Sell in May and go away, an adage used primarily in the stock market, applies to Vancouver’s Real Estate in 2020. In all actuality one should have sold much sooner than May, but better late than never. Home values dropped over 100 Thousand dollars from March to April across Greater Vancouver. With more significant losses forecasted.
Many analysts and even the Greater Vancouver Real Estate Board had touted a significant price increase for the detached market in 2020. Reality has hit them all hard, along with their ardent followers. Prices are still up from the beginning of the year albeit only a measly 7 thousand dollars. From $1.590Mil in January to 1.597Mil in April. Signalling the peak of the 2020 detached prices has already come and gone.
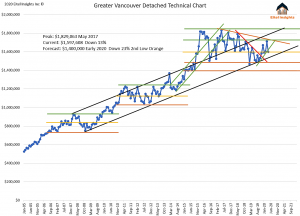
Eitel insights had strongly suggested selling into that perceived strength, and advised to hold off on any potential purchases. The chart above demonstrates why. Prices for a majority of 2019 were near the 1.50Million threshold (Higher Orange) which held as a temporary bottom, and in turn stabilized the market enabling a rally up to 1.709Million to occur in March. We have seen this movie before of pricing threshold temporarily holding only to be broken on subsequent tests.
During 2017 – 2018 prices tested the 1.60Million threshold which temporarily held. However a pricing threshold is akin to a camel, one added straw will break this markets back too. 1.60Million broke early in 2019 much like 1.50Million will break in 2020. Leaving 1.40Million as the next threshold inevitably tested.
Now, we advise, Don’t try to catch this falling knife. Prices are down over $230,000 from the peak which is good. It will become even more attractive with time. As prices decline to 1.40Million that will exemplify a discount of $430,000 to the market from the peak.
There is no rush to enter this market, we suggest patience.
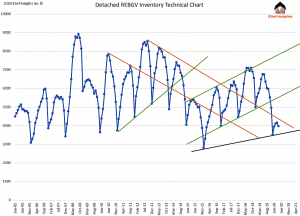
Inventory for the month of April waned as expected due to covid – 19, and the social distancing. The active listings are still above the staunch uptrend, finishing the month with just under 4000 properties for sale.
Once the social distancing relinquishes, the inventory will rapidly rise. A need for money has become a harsh circumstance for a majority of households. The stock markets have lost the equity gained over the previous two years. There isn’t even a possibility to work extra hours, as most work places have been closed, some never to reopen.
With few options remaining, selling real estate will become an unfortunate necessity. Which will inevitably lead to foreclosures coming to the market as well. None of which puts pressure on the buyers. If selling, take the hit early before the knockout punch is landed.

The housing market just experienced the lowest sales in April on record. For some perspective during the 08 -09 recent recession the sales for April were at 1298 and 1188 respectively. Sales numbers plummeted to only 393 home sales in April. Sub 400 sales have only occasionally occurred during the winter months, never in the spring markets. Sounds bad but there is an additional kicker.
As we have been pointing out for the past few articles, sales data is from land titles, meaning, the upcoming months will see likely even lower numbers reported.
The number of accepted offers so far this year, beginning with January, was over 500. February saw nearly 800, and March realized just under 700. Meaning the sales data from land titles of 393 sales came from completions on those previously accepted offers.
The kicker, April’s accepted offers were just over 200… the worst is yet to come.
One of my favourite quotes is as follows which will lead into my final thoughts. “While the individual man is an insoluble puzzle, in the aggregate he becomes a mathematical certainty. You can, for example, never foretell what one many will do, but you can say with precision what an average number will be up to. Individuals vary, but percentages remain constant. So says the statistician.” – William Winwood Reade
Eitel Insights’ forecast of 1.40 Million was offered by back in 2016 and published in 2017 (Western Investor). Not only were we the first to forecast the peak of 1.830 million, we forecasted the bottom at the same time. The housing markets are no longer guess work. Fundamental factors continually show up late to the game. By utilizing our actionable intelligence buying low and selling high is no longer based on a gut feel, it is technically predictable.
Not all markets in Greater Vancouver are created equal, some areas are closer to the bottom. While others still have significant percentage losses upcoming. Become an Eitel Insights client to find out which are which.
Dane Eitel, Eitel Insights
Watch Eitel Insights latest video:
In response to overwhelming demand, Michael Campbell will be conducting a series of interviews over the next month with keynote speakers from the World Outlook Conference and making them available to our Inside Edge Subscribers. In this week’s video James Thorne talks about what Central Bank support of the stock market means for your investments! Not yet an Inside Edge subscriber? This might be a great time to consider joining. Click for more info https://bit.ly/3bgj9aA
Each week Josef Schachter will give you his insights into global events, price forecasts and the fundamentals of the energy sector. Josef offers a twice monthly Black Gold newsletter covering the general energy market and 29 energy and energy service companies with regular updates. He holds quarterly subscriber webinars (next one Thursday May 28th) and provides Action BUY and SELL Alerts for paid subscribers.
EIA Weekly Data: Wednesday’s (April 29nd) EIA data was quite positive with inventories growing less than expected and consumption resurgent. Commercial stocks increased by 9.0Mb (versus a forecast of 10Mb). The build would have been higher by 2.9Mb had exports not risen by 412Kb/d to 3.3Mb/d last week. Overall stocks rose 11.6Mb on the week with the strategic reserve (SPR) taking in 1.2Mb. One bright spot was Gasoline inventories which fell 3.7Mb on the week as consumption lifted strongly. Refinery runs rose two points from 67.6% to 69.6%. US production of crude fell 100Kb/d to 12.1Mb/d and is now down 1.0Mb/d from the peak in mid-March. Production cutbacks keep on being announced by energy companies as storage fills up. On April 24th for example, Continental Resources (CLR-N) announced it would stop all drilling in the Bakken shale field and shut in nearly 150,000 b/d. Fellow North Dakota Bakken producer, Whiting Petroleum (WLL-N) filed for bankruptcy. By summer US production is likely to be under 11.0Mb/d. Cushing saw a rise in storage of 3.7Mb to 63.4Mb and may have less than a month left until full (effective capacity 76-77Mb).
On the positive side this week’s product consumed, lifted 12% or by 1.66Mb/d to 15.8Mb/d the first large increase since the start of the slide as the Covid-19 virus closed the US economy down. Finished motor gasoline demand lifted by 10% to 5.86Mb/d and jet fuel demand rose a whopping 31% to 800Kb/d from 612Kb/d in the prior week. This is very encouraging as the beginning of the reopening of the US economy expands. Hopefully we do not see a pick up in Covid-19 cases as the country emerges from the shutdown resulting in mitigation requirements stiffening again.
Baker Hughes Rig Data: Last week Friday the Baker Hughes rig survey showed a decline in the US rig count of 64 rigs (prior week down 73 rigs) to 465 rigs and down 53% from 991 rigs working a year ago. The Permian felt the largest basin loss with a rig loss of 37 rigs (last week down 33 rigs) or down by 47% from a year earlier. We expect the US rig count to fall to 400 or less during May. With high depletion for new wells this supports the view that the US production could fall to <11.0Mb/d during Q3/20, if crude prices remain low. Canada had a decline of four rigs, and the count now is at 26 rigs working down 59% from 63 a year ago. It is likely that 700Kb/d has been shut in already in Canada during Q2/20 and maybe a total of 1.2-1.6Mb/d before the end of Q3/20, if prices for WCS remain below operating and transportation costs and little real liquidity support comes to the industry.
Conclusion: WTI as we write this is at US$15.70/b for the June contract, up over US$3/b on the day. This was due to the very positive demand part of the EIA report and news that the recent trials of Gilead Sciences remdesivir trials are showing improvements for half the patients taking it. There is now more hope by investors that the US economy may be able to open quicker than prior forecasts. The daily crude oil price changes are moving fast. The farther you go out the higher the contango value. Into 2021, WTI prices are over US$30/b.
With storage just weeks away from being full (around the world) we expect more production to be shut in and that we may see miniscule pricing for the June contract before expiry on May 19th. The current price recovery won’t last as it is clear that there is inadequate storage and more oil needs to be shut in. Our target is for crude to fall below US$10/b into late May or late June before reduced supply and reduced demand balance out in Q3/20. One positive is that the US oil ETF the USO has now rolled out from its focus on the nearby June contract and has increased its position in more of the outlier months (30% July, 15% August, 15% September, 15% October, 15% December and 10% June 2021 contracts). This should remove the fear of negative pricing at contract expiry, as occurred in March and that this ETF could go out of business. The CME (which owns the oil-futures exchange) made a big mistake in not setting up a policy of $0 settlement and now the door is open for paper traders to have to pay to take away physical commodities whenever there is demand shortage or storage issues. One more negative is that speculators have added to their crude futures contracts and at April 21st were long 580Mb up from 501Mb in the prior week. Commercials had a growing bearish position of 590Mb short up from 552Mb in the prior week. This reflects to us what you see at tops versus at crude price bottoms.
The S&P/TSX Energy Index has strengthened to 76 as this oil recovery has occurred and optimism has risen about the economic reopening on both sides of the border. The recent bear market, short covering rally over the last six weeks, of nearly 100% from the low at 38.81, is now spent in our book and optimism is too buoyant. There is too much hope that the Canadian government will do something material to help the industry. We are pessimistic that it will be too little and too late for this leftist environmental minority government which has to get support from the NDP and Greens, that are anti-oil. The short covering rally took the S&P Energy Bullish Percent Index from 0% on March 9th to 96% currently. In lengthy bull markets this would be a SELL signal but in this instance we see this as a near term overbought indicator. We recommend investors hold off additional buying until we see a meaningful correction. We expect to see the energy sector correct significantly and that this Index will fall again below 5%, as the overall stock markets reverse and the S&P/TSX Energy Index should fall to the 32-36 level in the coming weeks..
The overall stock market decline will be likely due to poor Q1/20 earnings, negative outlooks by companies, and the too slow arrival of stimulus funds. The longer the delay in getting adequate testing kits so that the economy can be reopened, the lower the markets may go. Our targets are for the Dow Jones Industrials Index to plunge below 18,000 (now 24,730) and the TSX to below 9,000 (now 15,185). Both Canada and the US States want to start extensive testing and tracing and need test kits which are not available. We know these downsides are not the consensus and that is why we are highlighting the risk in the market at this time. The coming decline could be even uglier and more painful than the one from mid-February to mid-March.
With Q1/20 results now coming out for Canadian energy companies we are adding a rating system to our research to reflect those we see as strong, those that should survive and those that have problems and may need help to survive. In our upcoming May Interim Report out on Thursday May 7th we will highlight this rating regime and for those that have problems note the issues and what they need to survive. As companies report over the month or so, we will do this review for all the companies we cover.
Subscribe to the Schachter Energy Report and receive Action Alerts and our TOP PICK recommendations when the next BUY signal occurs as well as our review of companies ability to survive the present existential virus collapse impacting crude prices.
To get access to our research please go to http://bit.ly/2OvRCbP to subscribe.
American brick-and-mortar retail has been having a tough time for the past three years, and the pandemic might just finish it off altogether, turning physical stores into nothing more than “fulfillment” centers. In the early 2010s, in the aftermath of the Great Recession, several large retail chains announced plans to shutter dozens of stores. It was expected that the industry would bounce back in a few years; yet, the retail apocalypse showed no sign of recovering.
In 2017, retailers shuttered a record-breaking 8,000 stores of 102 million square of feet of store space. Then, 2018 proved far worse, with another 155 million square feet of space shut down. And still, that staggering rate of store closures that rocked the retail industry was nothing compared to 2019, when retailers set a new record for store closings at over 9,000…CLICK for complete article
-
I know Mike is a very solid investor and respect his opinions very much. So if he says pay attention to this or that - I will.
~ Dale G.
-
I've started managing my own investments so view Michael's site as a one-stop shop from which to get information and perspectives.
~ Dave E.
-
Michael offers easy reading, honest, common sense information that anyone can use in a practical manner.
~ der_al.
-
A sane voice in a scrambled investment world.
~ Ed R.
Inside Edge Pro Contributors

Greg Weldon

Josef Schachter

Tyler Bollhorn

Ryan Irvine

Paul Beattie

Martin Straith

Patrick Ceresna

Mark Leibovit

James Thorne

Victor Adair