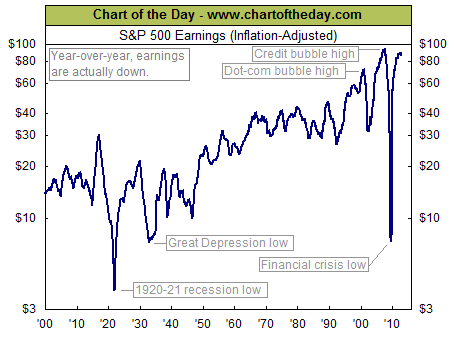
With fourth-quarter earnings largely in the books (over 97% of S&P 500 corporations have reported), today’s chart provides some long-term perspective to the current earnings environment by focusing on 12-month, as reported S&P 500 earnings. Today’s chart illustrates how earnings declined over 92% from its Q3 2007 peak to Q1 2009 low which brought inflation-adjusted earnings to near Great Depression lows. From its Q1 2009 low, S&P 500 earnings surged to a level that approached its credit bubble peak. Since Q4 2011, however, earnings have gone flat and have actually declined over the past two months. In the end, the latest data has inflation-adjusted earnings making new 13-month lows.

Quote of the Day
“A single idea, if it is right, saves us the labor of an infinity of experiences.” – Jacques Maritain
Events of the Day
December 08, 2012 – Hanukkah (1st day)
December 10, 2012 – Nobel Prizes awarded (announced in October)
Stocks of the Day
Find out which stocks investors are focused on with the most active stocks today.
Which stocks are making big money? Find out with the biggest stock gainers today.
What are the largest companies? Find out with the largest companies by market cap.
Which stocks are the biggest dividend payers? Find out with the highest dividend paying stocks.
Chart of the Day – Where’s the Market Headed
Where’s the Dow headed? The answer may surprise you. Find out right now with the exclusive & Barron’s recommended charts of Chart of the Day Plus.


