
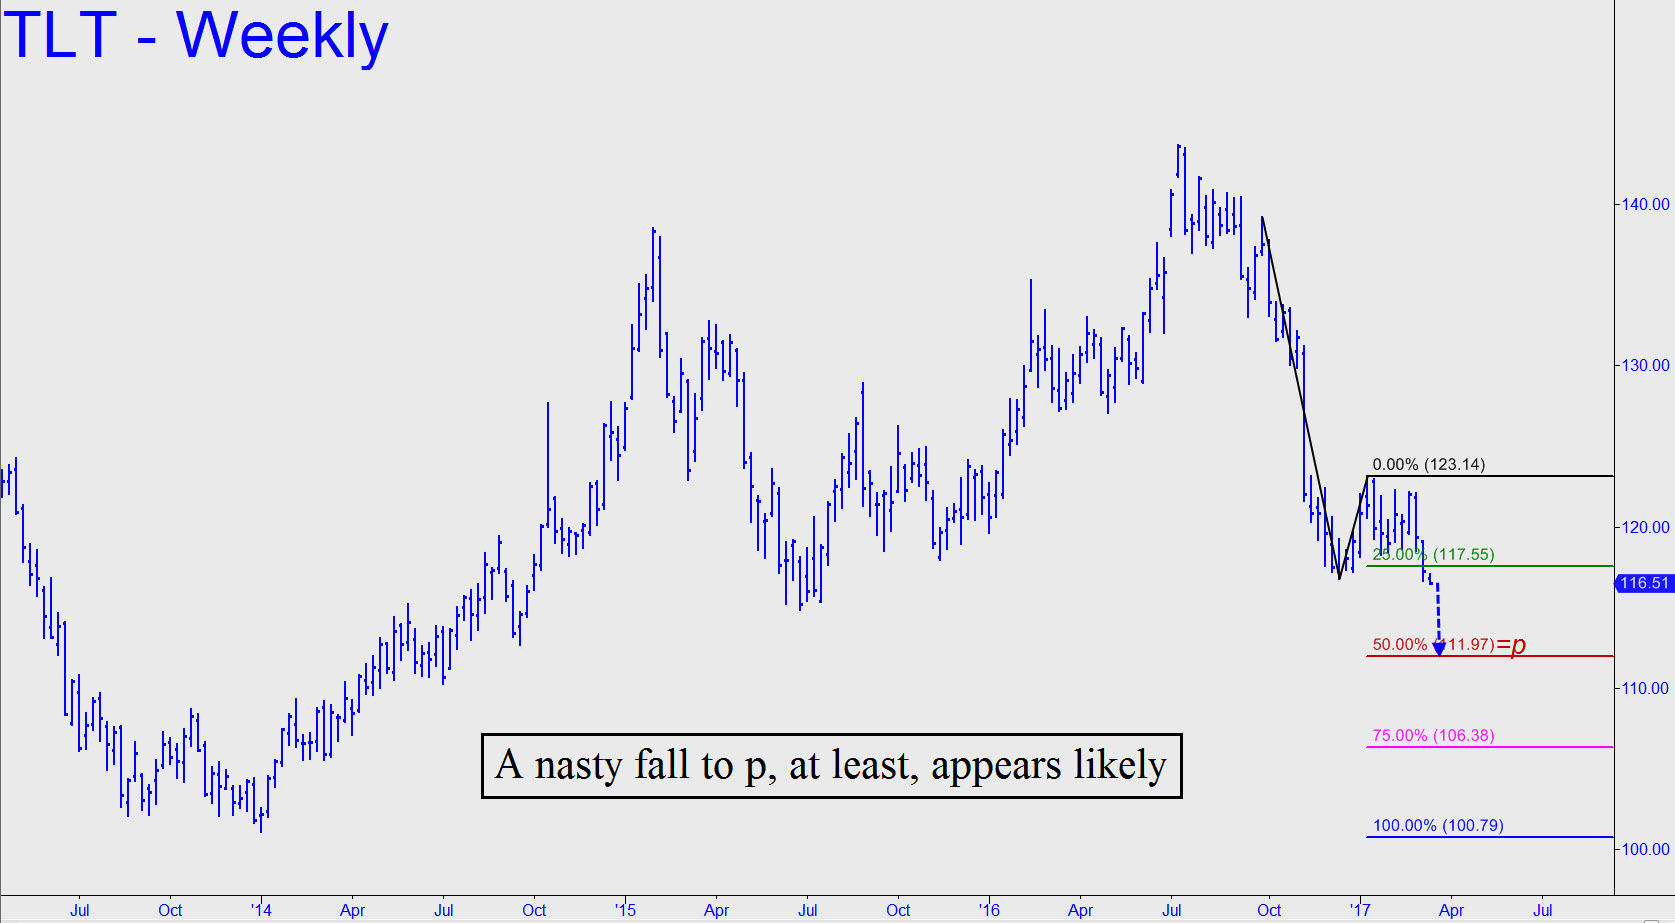

This proxy for T-Bonds has quietly slipped into no man’s land with the recent breach of December’s bombed-out lows near 116.80. Even before this occurred, TLT looked like a good bet to fall to at least 111.97, the midpoint Hidden Pivot support of the pattern shown. But it would require only a breach of the July 2015 low at 114.88 to do very serious damage to the long-term chart. If the 111.97 target is hit, it would correspond to a rise in long-term interest rates to about 3.37% from a current 3.19%. And if TLT were to fall all the way to the D target at 100.79, yields would be around 3.84%. For borrowers in the U.S. and around the world, this would be more than just a turn of the screw. Indeed, if stock prices were to fall simultaneously as seems logical, it would crush them beyond any hope of recovery. Meanwhile, any counter-stimulus equal to the problem would be tantamount to hyperinflation.
Click here for two weeks’ free access to Rick’s Picks
…also: FOMC: Don’t Get Lost in All the Hoopla


