
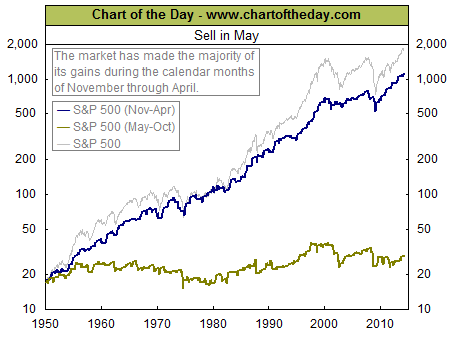
The stock market is about to enter what has historically been the weakest half of the year. Today’s chart illustrates that investing in the S&P 500 during the six months of November through and including April accounted for the vast majority of S&P 500 gains since 1950 (see blue line). While the May through October period has seen mild gains during major bull markets (i.e. 1950-56 & 1982-97), the overall subpar performance during the months of May through October is noteworthy. Hence the saying, ‘sell in May and walk away.’
Notes:
What should you invest in this time of year? Find out right now with the exclusive & Barron’s recommended charts of Chart of the Day Plus.

Quote of the Day
“Managers are people who do things right, and leaders are people who do the right thing.” – Warren G. Bennis
Events of the Day
May 01, 2014 – May Day
May 03, 2014 – Kentucky Derby
May 05, 2014 – Cinco de Mayo (Mexico)
May 06, 2014 – National Teacher Day
May 08, 2014 – NFL Draft begins (ends May 10th)
May 11, 2014 – Mother’s Day
Stocks of the Day
— Find out which stocks investors are focused on with the most active stocks today.
— Which stocks are making big money? Find out with the biggest stock gainers today.
— What are the largest companies? Find out with the largest companies by market cap.
— Which stocks are the biggest dividend payers? Find out with the highest dividend paying stocks.
— You can also quickly review the performance, dividend yield and market capitalization for each of the Dow Jones Industrial Average Companies as well as for each of the S&P 500 Companies.
Mailing List Info
Chart of the Day is FREE to anyone who subscribes. Subscribe HERE
To ensure email delivery of Chart of the Day, add mailinglist@chartoftheday.com to your whitelist.


