
Which one is right?
On Friday China reported its trade numbers. They were good. And they seemed to do nothing but instill confidence in China’s economy recovery.
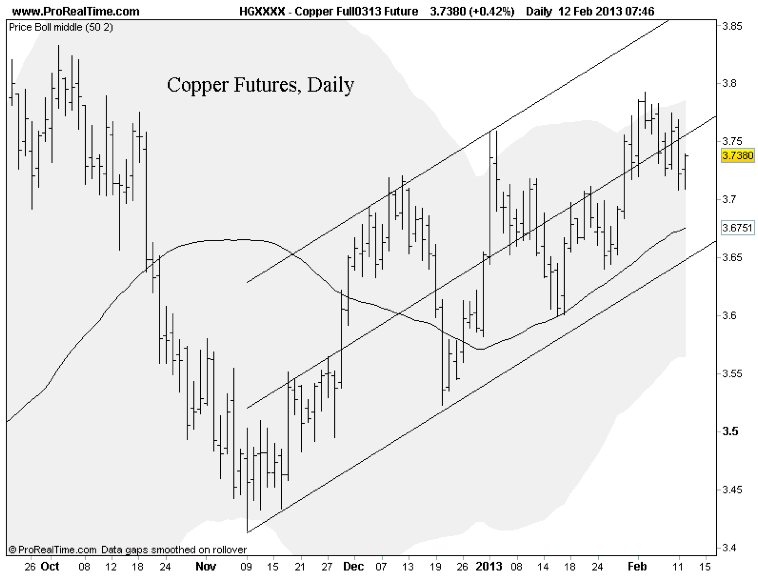
So you would expect a certain reaction from assets most closely ties to China’s economy. I immediately think copper.
Indeed, copper imports into China did grow notably in January.
If we consider Friday’s copper price action only, right after the news was released, the response was good. But the rally was more than erased yesterday. I didn’t see any new catalyst that would have driven copper lower, so I can only think it should fall into the category “adverse price action relative to the news.”

The uptrend in copper is intact for now, but the momentum is waning a bit and in the long- term one could make the case for a deep decline should this adverse price action continue and its uptrend channel be violated. The weekly consolidation is currently bullish, but just barely – a breakdown could happen quickly if this five-wave consolidation pattern resolves itself to the downside as it suggests:

It’s also worth noting that China’s imports of crude oil were strong. Unlike copper, crude oil did well yesterday:

And I imagine that move really hit a lot of new crude oil bears hard. But should this be reassuring for the crude oil bulls out there?
Among the growing population expecting the recent US stock market strength to hit a temporary stopping point, crude oil is also expected to take a breather. I’ll agree. But crude isn’t going to break when so many are expecting it to; it’ll shake out a whole lot of bears before it turns lower.
But I do think that turn is coming soon, both for crude oil and stocks. In my Commodities Essential newsletter last week I talked about why. Here is a short summary with updated charts …
A look at the NYSE Bullish Percent Index suggests stocks are overbought and near a substantial turning point. The index peaked out at or above 70 twice last year. Those peaks coincided with substantial corrections:

And there’s another item I find useful, particularly to help identify turning points: the CFTC’s weekly Commitment of Traders (COT) report.
The COT report shows the open interest and the net long/short positioning broken down by three investor categories – small speculators, large speculators, and commercials – in a particular futures contract.
I look specifically for relative extremes in positioning among the small and large speculators. When speculative positioning reaches extremes, the speculators tend to be wrong about the future direction of prices. Thus, these extremes suggest greater potential for a turnaround … for a playable correction.
Here is a chart showing the weekly COT data for the S&P 500 futures going back one year:

This chart suggests speculative positioning has reached an extreme that will induce a steep, playable correction at least.
Of course, timing is critical as these are weekly figures that can persist even after reaching lopsided levels. The latest data shows large speculators already beginning to dump long positions. Will this create a feedback loop of selling? Or will this rally reach higher before a real correction materializes?
Either way, I think we are very close to a substantial pullback in risk appetite.
I think crude oil will be the commodity most tied to a risk asset sell-off. Copper may be dragged down as well, but I don’t expect copper to perform as poorly as crude oil unless some key support levels are first taken out. In fact, the Commitment of Traders data on crude oil suggests a turning point is not far (just as the S&P 500 COT data does):

It seems there are two ways a trader/investor could be leaning right now:
Way #1: Risk On. There will be a continued melt-up in risk assets on the premise of continued money printing and recovery in key global economies
Way #2: Risk Off. At least a substantial correction is due, but poor price action could quickly morph into something uglier than a correction as the merit of money printing, unmanageable debt and economic recovery are undermined by renewed deflation expectations.
I suppose there is some middle ground. But I think there are too many leaning towards way #1. As such, I am beginning to lean towards way #2.
There may be a few more weeks of upside. We may need to see a real blow-off in risk appetite before any correction materializes.
But the higher we go from here, the harder we fall. (At least that’s what they say!) I say watch crude.
- JR Crooks
- Black Swan Capital
- www.blackswantrading.com


