

Todd Market Forecast for Thursday May 12, 2016
DOW + 9 on 250 net declines
NASDAQ COMP – 23 on 1000 net declines
SHORT TERM TREND Bullish
INTERMEDIATE TERM TREND Bearish
STOCKS: Today was disappointing. It opened up sharply, but waffled around. A couple of things may have been at work.
First, jobless claims were up sharply and there is some concern about the retail sales figure to be released on Friday. A lot of retail stocks have been taking it on the chin.
GOLD: Gold was down $11. The dollar rebounded.
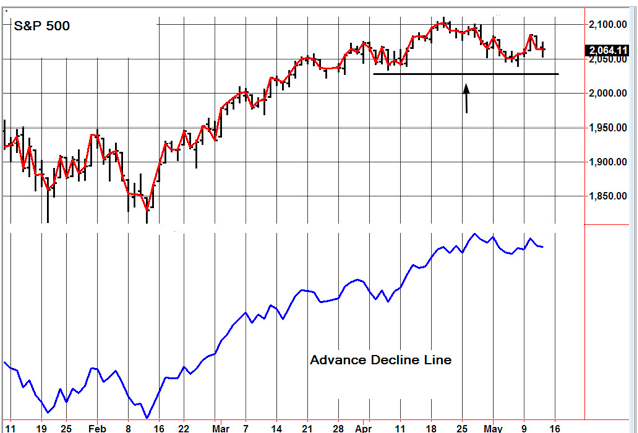
CHART: The market is very choppy and indecisive right now. It can’t seem to break down or up. Seasonality suggests that it will break down below the support line (arrow), but we have some very high put call ratios which argue the other way.
BOTTOM LINE: (Trading)
Our intermediate term system is on a sell. (related, a technical index flashes a Danger Signal – CBOE Volatility Index – Money Talks Ed.)
System 7 We sold the SSO at 64.28 for a loss of 80 cents. Stay in cash.
System 8 We are in cash. Stay there.
News and fundamentals: Jobless claims were 294,000, worse than the expected 267,000. On Friday we get retail sales, PPI final demand and consumer sentiment.
Interesting Stuff: The use of mathematics has brought rigor to economics. Unfortunately, it has also brought mortis — Attributed to Robert Heilbroner
TORONTO EXCHANGE: Toronto was down a fraction.
BONDS: Bonds fell back somewhat.
THE REST: The dollar was up. Silver was lower. Crude oil was mildly higher.
Bonds –Bullish as of April 27.
U.S. dollar – Bearish as of March 7.
Euro — Bullish as of March 7
Gold —-Bearish as of May 9.
Silver—- Bearish as of May 9.
Crude oil —- Bearish as of April 4.
Toronto Stock Exchange—- Bullish from January 22.
S&P TSX Venture Fund — Bullish from January 29.
We are on a long term buy signal for the markets of the U.S., Canada, Britain, Germany and France.
|
|
Thu. |
Fri. |
Mon. |
Tue. |
Wed. |
Thu. |
Evaluation |
|
Monetary conditions |
0 |
0 |
0 |
0 |
0 |
0 |
0 |
|
5 day RSI S&P 500 |
26 |
37 |
40 |
68 |
47 |
46 |
0 |
|
5 day RSI NASDAQ |
18 |
29 |
37 |
61 |
43 |
38 |
0 |
|
McCl- lAN OSC. |
-126 |
-82 |
-95 |
-15 |
-75 |
-87 |
0
|
|
Composite Gauge |
11 |
6 |
11 |
5 |
15 |
11 |
0 |
|
Comp. Gauge, 5 day m.a. |
11.4 |
10.4 |
11.2 |
9.2 |
9.6 |
9.6 |
0 |
|
CBOE Put Call Ratio |
1.20 |
1.19 |
1.14 |
1.09 |
.94 |
1.27 |
+ |
|
VIX |
15.91 |
14.72 |
14.57 |
13.63 |
14.69 |
14.41 |
|
|
VIX % change |
-1 |
-7 |
-1 |
-6 |
+8 |
-2 |
0 |
|
VIX % change 5 day m.a. |
+0.8 |
-1.2 |
+0.2 |
-2.4
|
-1.4 |
-1.6 |
0 |
|
Adv – Dec 3 day m.a. |
-786 |
+5 |
+153 |
+726 |
+132 |
+124 |
0 |
|
Supply Demand 5 day m.a. |
.55 |
.62 |
.54 |
.66 |
.55 |
.59 |
0 |
|
Trading Index (TRIN) |
1.25 |
.94 |
1.32 |
.61 |
.94 |
1.32 |
0
|
|
S&P 500
|
2051 |
2057 |
2059 |
2084 |
2064 |
2064 |
Plurality +1 |
INDICATOR PARAMETERS
Monetary conditions (+2 means the Fed is actively dropping rates; +1 means a bias toward easing. 0 means neutral, -1 means a bias toward tightening, -2 means actively raising rates). RSI (30 or below is oversold, 80 or above is overbought). McClellan Oscillator ( minus 100 is oversold. Plus 100 is overbought). Composite Gauge (5 or below is negative, 13 or above is positive). Composite Gauge five day m.a. (8.0 or below is overbought. 13.0 or above is oversold). CBOE Put Call Ratio ( .80 or below is a negative. 1.00 or above is a positive). Volatility Index, VIX (low teens bearish, high twenties bullish), VIX % single day change. + 5 or greater bullish. -5 or less, bearish. VIX % change 5 day m.a. +3.0 or above bullish, -3.0 or below, bearish. Advances minus declines three day m.a.( +500 is bearish. – 500 is bullish). Supply Demand 5 day m.a. (.45 or below is a positive. .80 or above is a negative). Trading Index (TRIN) 1.40 or above bullish. No level for bearish.
www.toddmarketforecast.com – Available Mon- Friday after 6:00 P.M. Eastern, 3:00 Pacific.
No guarantees are made. Traders can and do lose money. The publisher may take positions in recommended securities.


