

Dog days of summer? Not much happening in the markets? Tight trading ranges? Yes, all are true. But that’s no reason to be complacent! Quiet markets and tight trading ranges can be very deceiving, often leading to surprises. (
(Ed Note: If you’d prefer to watch this presentation in Video go HERE)
The last couple of weeks since I last spoke with you by video haven’t seen much in the markets other than tight trading ranges, a lot of coiling up like a spring ready to break.
That’s somewhat understandable considering we’re almost in the dog days of summer. And there’s a lot of uncertainty about what’s happening in Europe and, of course, the latest developments in the Middle East with Iran and Syria.
The major trends have not changed so let’s go right to the charts.
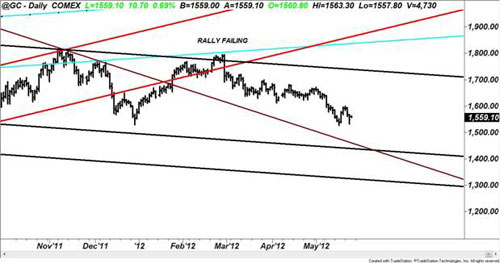
Gold: Here is a fresh new chart of gold. As you can see, gold is largely going quite a bit sideways. It’s coiling up and that’s usually an indication of a substantial move coming.
I do believe that it will be to the downside. Nothing’s changed there.
My system signals continue to suggest a sharp move to the downside; however, in a tight trading like this anything goes. I wouldn’t be surprised to see one last rally out of gold, even up to $1,680, before the next leg down occurs. You can see right here there’s tremendous resistance overhead in gold between $1,680 and $1,700.
Bear in mind, I’m long-term very bullish on gold, but that next leg up in gold will not materialize until we get a solid test of long-term support down below $1,500, probably around the $1,400 level.
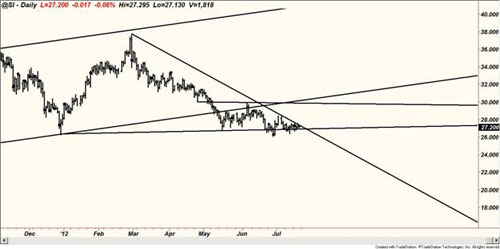
Silver: Silver, much like gold as you can see here, is really coiling up in a very tightly wound trading action here. Silver, like gold, could stage one last rally. However, I believe that we are still very likely to see $23 and $20 silver before silver’s long-term bull market reemerges.
You can see here it’s on the edge of doing something in this contracting triangle — we’re very close to perhaps a short-covering rally or a complete breakdown.
There isn’t much in the way of support once $26 is broken. There’s some minor technical support at $23, and then really no support until around the $20 level. So keep your eyes on both gold and silver. I think we’re close to some significant moves there despite the recent, very tight, sideways action.
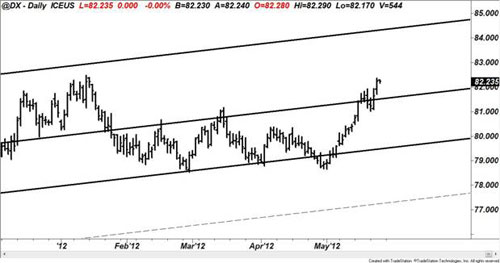
U.S. Dollar Index: The dollar is looking very healthy here, again, because the euro is so sickly. The dollar has had a nice uptrend, which I correctly forecast.
We’ve pulled back a little bit and we could pull back a little bit further basis the Dollar Index to about 83, but then we should see another leg higher to the 86, 87 level as Europe’s crisis continues to roll on.
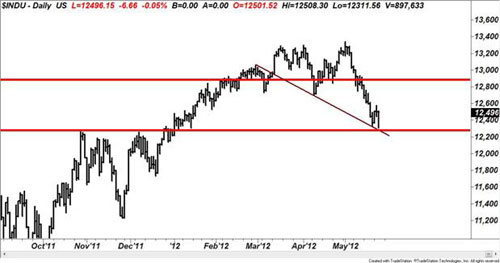
Dow Industrials: The Dow Industrials have been very resilient, which is a testament to what I’ve been telling you all along — that it is in a new long-term bull market; but short- and intermediate-term, the Dow is not acting that well.
The internals on the Dow Industrials are not very strong. The breath of the recent rally is not very healthy. Volume is lackluster. As you can see from this pattern here it’s really not, as Elliott Wave people would call it, impulsive to the upside.
This is a correction. And we are now at a very significant resistance level in the Dow. So I would not be surprised to see the Dow start to roll over.
I’m still looking for a test just below 12,000, 11,500, maybe even 11,000 down here, before the next big leg up in the Dow Industrials occurs.
As quiet as the markets have been in choppy, tight trading ranges over the last couple weeks, and the fact that we’re heading into the dog days of summer, I do recommend that you stay in touch with all my writings and keep abreast of the markets because, as you can see from these charts, things are coiling up and that’s usually a sign, a precursor, of some big moves ahead.
So stay tuned and have a good week.


