

 Traders and investors everywhere are spooked by volatility whenever it rears its head. We hear about it every time stocks take a tumble, even if that doesn’t happen so much these days. So the Investopedia definition I’ll show you is probably the last thing they’re thinking of.
“Volatility: A statistical measure of the dispersion of returns for a given security or market index. Commonly, [emphasis mine] the higher the volatility, the riskier the security.”
Now, that doesn’t sound so scary, does it?
Volatility is nothing more than a statistical tool that shows how much a stock goes up or down. Yet many see volatility as a bad thing, because they equate it to risk. And risk is bad for us, right?
Well, sometimes risk is bad. But to the smart investor, volatility is a difference maker. Because without it, you might as well just buy a CD. More importantly, you have zero chance of beating the market. And where’s the fun in that?
That’s right: Without volatility, you don’t beat the market.
That’s why one of my 10 Trading Commandments is “Volatility is a trader’s best friend!”
Now, let me prove it to you…
Directional Volatility Takes You “FAR” as a Trader
Think about volatility as merely the distribution of a stock’s returns. The wider the distribution, the higher the volatility.
And the higher the volatility, the more the stock is moving, and that means we’re getting paid if it’s moving in our direction.
To beat the market, especially using options, we want volatility on our side. I call it the “FAR Principle” – fast, aggressive, and right.
I want a fast move to happen before my option expires. I need an aggressivemove that I can leverage with an option. And I need the move to be in the right direction to agree with my call or put.
Having volatility in my corner, along with picking the right direction, is how I (and you) get paid as an investor.
How to Find Volatility Before It Happens
 Understanding how volatility leads to profits is one thing. The key, though, is getting on board a stock before the volatility hits.
Watching a big move from the sidelines is no fun at all; you need to learn how to spot volatility before it happens.
One of my favorite indicators to identify potential volatility is the Bollinger Band.
This indicator measures volatility by looking at the distribution of price changes over a certain period.
I won’t get into the details here – you don’t need that stuff to start using it in your trading and investing. It’s enough to say that a break above the top Bollinger Band is often followed by a volatility rally, while a move below the bottom band often initiates a volatility sell-off.
But I go beyond these breaks above or below the bands. I also monitor the distance between the top and bottom bands to tell me when the volatility surge is about to happen. The tighter the bands get, the higher the probability that a volatility breakout is coming. Monitoring the distance between the bands positions me ahead of the wave of a volatility breakout.
But once we have our read on the Bollinger Bands, we still need to answer one more question – a big one, at that: Will it be a volatility rally or sell-off? This is where a few other technical tools come into play.
While keeping it simple is often the best approach, I tilt the scales in my favor by adding two straightforward technical criteria to find bullish FAR moves.
First, I want a stock that is trading above its 50-day moving average. Second, I want to see the 50-day in an uptrend. Combining those criteria with a break above the upper Bollinger Band increases the odds that a bullish volatility rally is in the works.
Here are a few stocks I’ve already analyzed for you, so you can try this yourself…
Adobe Systems (Nasdaq: ADBE) Breaking Out
Let’s look at Adobe Systems Inc., a stock that I feel is currently on the verge of a volatility rally. Here’s a chart of ADBE shares showing the Bollinger Bands andthat 50-day moving average.
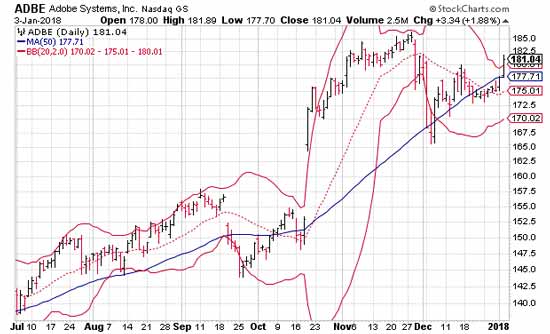
- This week, the distance between Bollinger Bands is approaching an annual low. This tells me the stock price is coiling like a spring, getting ready to make a big move.
- The 50-day moving average is in a very strong uptrend.
- On Wednesday, ADBE rallied well above the 50-day and broke above its top Bollinger Band.
Based on these bullish technical developments, I’m looking for a volatility rally that will push the stock above the $185 level over the short term.
If you want to ride along and make some fast money, consider the February $180 call.
There are all sorts of ways a stock can tell you that it wants to make you money. This is just one of them.
Next week, I’ll talk about how I use what they call “short interest” to put the trading odds in my favor… and big profits in my account. Until then, make volatility your friend; you’ll love the gains that are possible.


