

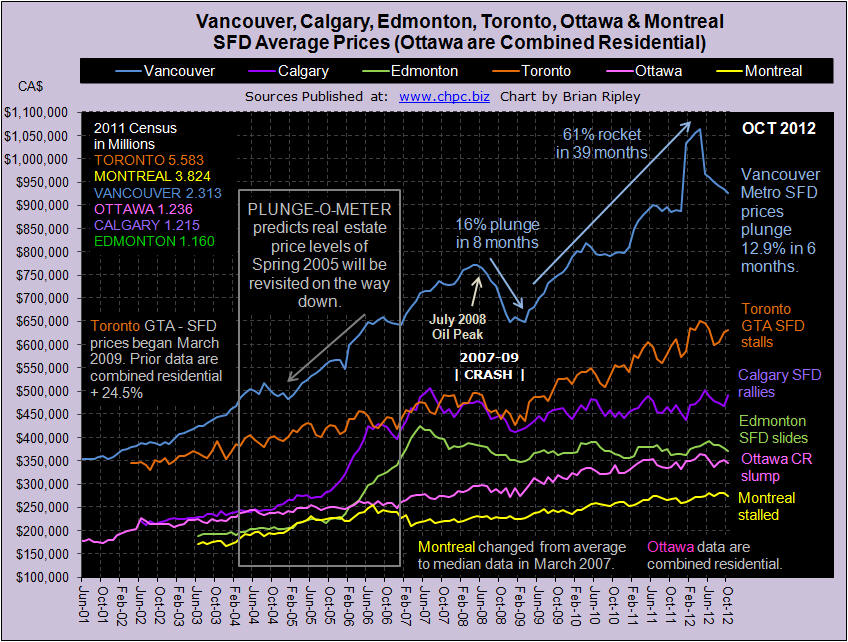
When prices go exponential, Chartists who track price series love to use the elegance of the Eiffel Tower as a metaphor. In short Vancouver Eiffelizes while Calgary Zooms.
The left side of the tower is exciting and for those who can time the ultimate exhaustion and exit point. They are rewarded… well exponentially. Vancouver average single family detached prices in October 2012 dropped again for a six month plunge of 12.9% and a loss of of $137,300 which is greater by 12% than the 2007-09 crash amount and the current plunge is a 77% retracement of the $177,329 gain since the beginning of the year (Vancouver Chart).
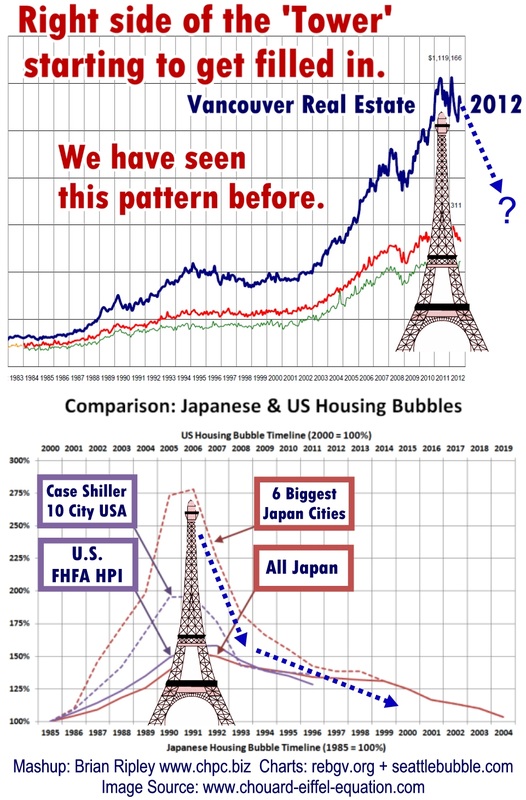
But the right side of the tower is where exponential decay occurs and the trip down often has the right leg breaking well below the trend that was in place prior to the exponential move up.
When it comes to real estate (a slow asset), the right leg can stretch out much further over time as evidenced by the Japanese experience.
As the downside trip gathers momentum, the market participants lower their expectations. We already hear real estate agents advising their client sellers to list their properties for sale below the last recorded comparable sale price to insure action and increase the probability of a successful transaction.
The fear of missing out in Vancouver is being replaced with the fear of getting stuck.
….read all the rest of Canadian City Pricing HERE


