

Quotable
The boast of heraldry, the pomp of pow’r,
And all that beauty, all that wealth e’er gave,
Awaits alike th’inevitable hour.
The paths of glory lead but to the grave.
Thomas Gray
Commentary & Analysis
Schadenfreude: That buy gold and sell the dollar thing doesn’t seem to be working out
I realize it’s not fair to pile on, but there is a certain joy one experiences when the blather from the cocky prognosticators of dollar doom and gold love are proven so utterly wrong by Mister Market. The German word schadenfreude says it best.
Scientific analysis this is not, but it is interesting, I think…the symmetry meme suggests we may have a couple more years left in this commodity bear market relative to stocks; which likely means we have another couple of years left in this US dollar bull market…but, confident we never should be as every moment in the market is unique (to paraphrase Mark Douglas).
I presented the Stocks/Commodities Ratio chart below, back in May of 2014, during an online webinar titled, US $ Reserve Currency Status: Is the US dollar doomed or is a powerful dollar bull market ready to resume. The chart shows the relationship between financial assets, i.e. stocks, measured by the S&P 500 Index, and real assets, i.e. commodities, measured by the Thomson Reuters Commodities Index. In short, the S&P 500 divided by the Commodities Index. So, when the value goes down, it means commodities are gaining relative to stocks, and vice versa. I said at the time, May of last year, it looked like the 10-year bull market in commodities was clearly over; the S/C ratio was at 6.14. The ratio has since jumped to 9.92; or about 60% (and sitting bang on the 61.8% retracement level—correction time?). Stocks are smoking commodities.
So what drove down the S/C ratio, favoring commodities over stocks, from 1999 to mid-2008? Clearly the insatiable demand for commodities from China and symbiotic relationship it created between the US and China, i.e. China sends stuff, the US sends back dollars, China reinvests those dollars in US Treasuries, dollar liquidity explodes globally (evidenced by the massive US current account deficit).
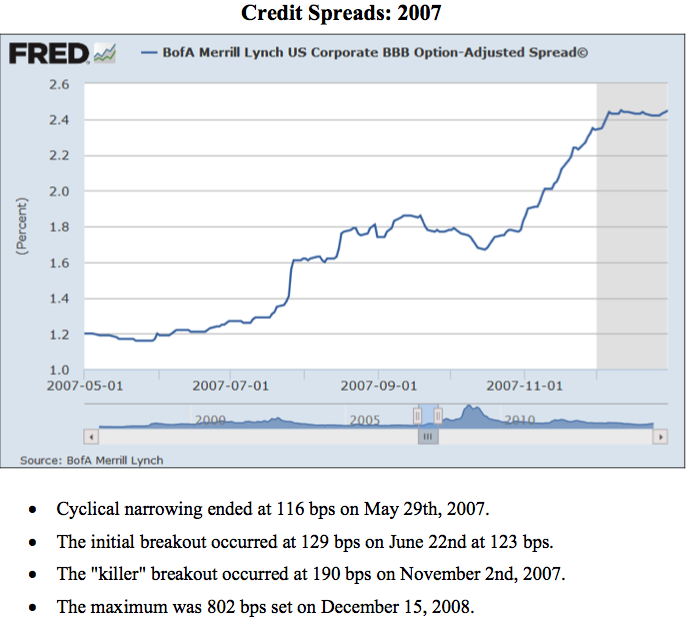
So what ended the game and drove the S/C ratio higher, favoring stocks over commodities–the Credit Crunch. It was a sea change event in the global economy. It marked the beginning of the new bull market in the US dollar, and we said as much at the time.
And why do I care about the S/C ratio? Because it appears highly correlated with the direction of the US dollar and could give us clues as to when the current dollar bull market has run its course.
Thanks to the elusive gift of hindsight we now all know China was the driver of the commodities bull market. Of course back in 1998-99 not too many realized just how strong the impact of China would have on global markets. And suspect not too many people realized how the symbiotic relationship between China and the US would impact negatively on the US dollar at the time.
So how when and how will this cycle end? If we get symmetry in duration going forward, maybe this cycle runs another 2-3 years. We can conjecture on the future trigger event(s) from now till the cows come home and develop plausible rational scenarios, but we don’t know what it will be. It is likely something already at work beneath the surface, that seen and unseen stuff that Frederic Bastiat warned us about.
But to get a sense of what types of things we should be watching for, let’s look at the key global macro triggers for major trend changes in the US dollar index since the dollar left the gold standard and began trading based on supply and demand factors against the other major currencies.
You will see this chart in the webinar PowerPoint I referred to above; it displays the global macro events, identified with hindsight, which led to a major trend change in the US dollar:
Since the Gold Standard was abandoned in 1971, we have seen three major bear markets in the dollar, all lasting about seven years, and two major bull market moves (the first seven years in duration, the second about 10 years). We are now in the midst of the third major bull market in the dollar, my guess is it carries out to 2018—representing about 10 years.
Macro Events Leading to Change in US Dollar Trend:
- Abandoned Gold Standard – Bear Market
- Fed Chairman Volcker hike rates to squeeze out inflaiton – Bull Market
- Plaza Accord because the dollar was too high (yen too low really) – Bear Market
- Tech Company Boom – Bull Market
- Tech Company Bust/Global Deflation Fear – Bear Market
- Credit Crunch (end of US/China symbiotic relationship) – Bull Market
- _____Unknown Event___________________________ — Bear Market
I realize there are plenty of gurus out there who already know exactly why the US dollar will fall again, and they likely know exactly when it will happen. Here is my tip of the day—they don’t know!
Readers of Currency Currents have seen the boom-bust sequence chart below before. I do believe it does represent how humans drive price action in free- and quasi-free markets; granted it is a very stylized view but still helpful.
- Commodities – Given the news of a 13-year low in the commodities index today, we are into the “fear” stage, but not yet into “despair.”
- The US dollar – We are either late in the “growing convictions” stage or in the beginning of “hubris” stage and setup for overshoot territory.
If the US dollar were to test the highs of that last bull market, we have approximately another 20% to go—that’s a lot.
US $ Index vs. Gold Weekly: Can you say mirror image?

The best way to participate in the US dollar bull market, and its corrections along the way, may be through currency options. And you may want to consider subscribing to our Currency Options Strategist; it is only $395 per year. [Our Canadian dollar put idea is working nicely, as talked about in our last Currency Currents. We are up about 100% based on Friday’s bid price on the option—see below.]
It is simple to use. We tell you when to buy a put or call on a major currency, using exchange listed ETFs. We tell you when to get out and take profit or cut loses. We never use any strategies but “buy a put” or “buy a call” so you always have limited risk and know what that risk is when you make the trade. We use options as simple long-term directional bets on the direction of a major currency against the US dollar.
Current Open Positions: Black Swan Currency Options Strategist.

We are short euro, Aussie, and Canadian dollar in our options service; fortunately all are profitable at the moment. We may look to grab some open gains soon, maybe peel off half profits on some of the positions and let the rest ride for more, i.e. keep some skin in the game.
If you are tired of failed prognostications and one-way hyperbolic bets from the guru crowd and are looking for a service that plays both sides of the US dollar move in an effort to make money for its subscribers and does not pretend it can forecast markets, you may want to give Black Swan Currency Options a try.
Regards,
Jack Crooks
President, Black Swan Capital
Twitter: @bswancap


