

Summary of Housing Price Changes for Major Canadian Cities September 2013
CALGARY average detached house prices in September 2013 met with more resistance and dropped another 0.9% (Calgary Chart) and are down 2.8% from the June peak (Plunge-O-Meter). Strata unit prices caught a bid and Townhouse prices ticked up 0.3% M/M and condo prices were up 0.1% M/M. As noted above in the “Strata Distortion” chart Calgarians are willing to trade one house for only 1.5 townhouses and this is a result of falling inventory (Scorecard) and migrant workers and flood victims competing for housing. Alberta remains a different country with respect to record highearnings and immigration. The sentiment in Calgary is the least bearish (34% bears to bulls) of the 3 markets polled with only 21% of the survey thinking Calgary SFD prices will be 20% lower in 12 months. What do you think? VOTE HERE.
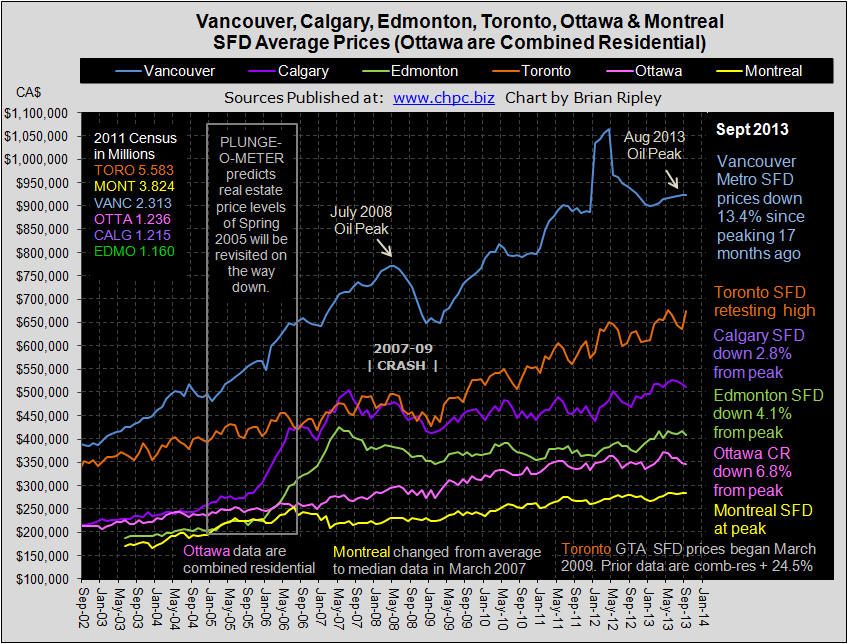
EDMONTON average detached house prices in September 2013 slumped 1.9% M/M (Canada Chart) and townhouse and condo prices also remained flat or falling M/M as sales continue to drop M/M (Scorecard). Bidding has yet to break the May 2007 peak SFD price (Plunge-O-Meter) which remains 4.1% below the high.
TORONTO average detached house prices for the GTA in September 2013 zoomed 6.1% M/M and are now only 0.4% away from the trifecta high set in May 2013 (Toronto Chart). Combined residential sales are off 2.1% M/M with average condo sales leading the way down 6.5% M/M. The gap between Vancouver and Toronto SFD housing prices (Vancouver vs Toronto) narrowed to 37% more expensive in Vancouver. The GTA may have appeal to the HNWI as a “safe” haven but the media does not rate Toronto as investment grade. Polled sentiment here continues to suggest that prices will be down another 20% in 12 months. What do you think? VOTE HERE.
OTTAWA average detached house prices are not available, instead the chart on this site reflects Ottawa’s average combined residential prices. OREB’s report is sparse and opaque and the CMHC, records for Ottawa inventory remain one month lagging. In September 2013 Ottawa combined residential prices dropped 0.6% M/M on a flagging sales drop of 8.2% M/M (Scorecard) and prices remain 6.8% below the peak price set in April (Plunge-O-Meter).
MONTREAL median (not average) detached house prices in August 2013 (I WILL UPDATE WHEN I GET SEPT DATA) ticked back up 0.7% M/M to the June 2013 record price peak (Canada Chart). SFD prices are range bound held in by negative sales dropping 13.2% M/M and down 0.4% Y/Y. The joy came in with condo sales up 5.5% M/M and up 8.9% Y/Y and condo prices rose 1.8% M/M and 3.3% Y/Y (Scorecard). In the 2011 Census, Montreal added 6.4% more dwelling units while only adding 5.2% more people. There is no shortage of housing, but there is a shortage of earnings; the Province of Quebec ranks 7th in Canada’s 10 provinces for earnings and printed an unemployment rate of 8.2% in July (0.6% above Ontario’s).


