

….IF SPX 1685 IS BROKEN, THE RISK OF A 5% TO 10% DIP IMPROVES.
Applying some ‘guerilla tactics’ for VRtrader Platinum subscribers, having purchased inverse ETFs on yesterday’s opening, I decided to ‘ring the register’ when equities sold off midday and when it became apparent that 1685 support in the S&P 500 held. The impact of ‘Turnaround Tuesday’ and ‘Weird Wollie Wednesday’ may now be behind us setting the stage for a further bounce during the upcoming Options Expiration week. For the short-term, I believe Thursday’s lows holding are the key. That said, there is no guarantee we’re going to surge to new highs right away, nor that we’ve eliminated the risk of a further correction during August. We also have to keep an eye out for the potential perils of September and October.
Recall, my original forecast or 2013 was for a positive (bullish) year to be followed by weakness during 2014 and possibly 2015. The party is not quite over YET, so long as Central Bankers feel the way to nirvana is via the printing press.
Equities began the session with modest gains after upbeat data from China helped ease some concerns regarding the pace of global growth. The Middle Kingdom reported an increase in exports (+5.1% actual, +3.0% expected) and imports (+10.9% actual, +2.1% forecast) while its trade surplus narrowed to $17.82 billion from $27.10 billion.
The slide in equities and dollar/yen was halted shortly after the first hour of action. Stocks then returned to their highs but the S&P was unable to reclaim the 1,700 level.
In Thursday’s economic data, the initial claims level increased from an upwardly revised 328,000 (from 326,000) for the week ending July 27 to 333,000 for the week ending August 3. The Briefing.com consensus expected the initial claims level to increase to 340,000. Even though the claims level increased this week, the headline number is actually a strong positive sign for the labor market. Throughout July, the initial claims data were distorted by seasonal adjustment problems from the motor vehicle industry. The Department of Labor announced that this week’s claims data were unaffected by seasonal biases. That means the initial claims, which were around 350,000 prior to the distortions, actually improved throughout July.
Today, June wholesale inventories will be reported at 10:00 ET.
Here are the new AAII Survey (Sentiment) results for this week:
Bullish: 39.5%
Neutral: 33.9%
Bearish: 26.6%
Change from Last Week:
Bullish: +3.9
Neutral: -5.5
Bearish: +1.6
Long-Term Average:
Bullish: 39.0%
Neutral: 30.5%
Bearish: 30.5%
Note: The AAII survey is based on a 6-month outlook. AAII voting is open all week to its members. At the AAII Website, you can download a spreadsheet which contains historical sentiment survey results back to 1987.
——————————————-
Following a three-day decline, the Dow Industrials were up 27.65 at 15498.32. A ‘Key Reversal’ pattern was formed to the upside so Thursday’s intraday low of 15418.60 now becomes important support. VRtrader Platinum subscribers bought and sold the inverse ETF for the DJ (DOG) earlier in the session. As you know, the DJ traded at a new record high at 15658.43 on Friday. Once the rally resumes the next big upside target in VR analysis would place the DJ into the 16000.00 to 16250.00 range. Support at 15150.00.
——————————————–
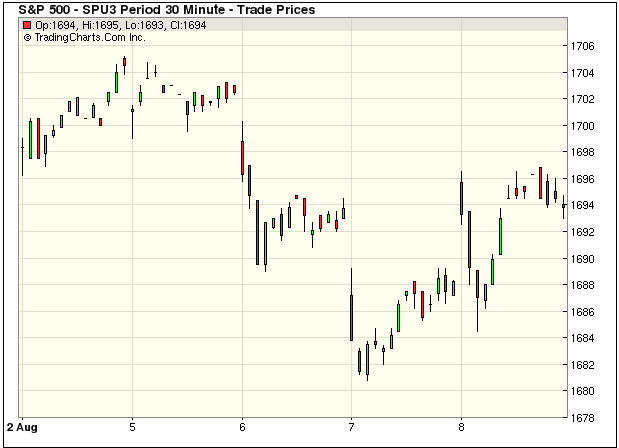
The S&P 500 was up 6.57 at 1697.48 – once again holding important support at 1685.00 intraday. That is the reason VRtrader Platinum subscribers were instructed to traded the DOG (mentioned above) along with the PSQ (the inverse ETF for the Nasdsaq 100). Once the rally resumes, unfulfilled upside targets include 1730, 1757.00 and potentially 1805.00. Support lies at 1685 and then 1659.00. A new record high was posted on August 2 at 1709.67.
——————————————–
The Dow Transports were up 52.08 at 6521.29. The Transports touched 6686.86, a new record high on August but were since negatively diverging as other major indexes rallied. We have to wait for a breakout here to give the bulls more ammunition. The next big technical target is 6900.00. On a bigger picture basis, a ‘theoretical’ bullish reverse ‘head and shoulders’ pattern has formed pointing to potentially 8900.00 in the Transports. There is no time associated with that projection. Downside support lies at 6180.00.
——————————————
The Russell 2000 was up 5.13 at 1049.47. The Russell raded at a new record high intraday Monday at 1063.52.
——————————————
The Nasdaq Composite was up 15.11 at 3669.12. A Leibovit Negative VR was posted on Tuesday confirming a short-term top and following a seven day consecutive advance that pushed to a new record high at 3694.19 intraday on August 5 – a high 100 points away from my still unfulfilled technical target fo 3800. VRtrader Platinum subscribers successfully traded PSQ (the inverse ETF for the Nasdaq 100 on Thursday).
—————————————-
The CBOE Volatility Index (VIX), which measures the cost of using options as insurance against declines in the S&P 500 (i.e., the higher the number, the more fear in the marketplace) was .25 at 12.73. The VIX touched 21.91 intraday on Monday, June 24 – the highest high since the March 15 low of 11.21 – the lowest level since February 2007. It was unchanged at on Friday. The higher we go in the VIX, the more likely a bear cycle is upon us.
—————————————–
Eight of the nine market sectors were higher on Thursday:
XLB +1.48% Materials
XLE +0.55% Energy
XLF +0.24% Financial
XLI +0.46% Industrial
XLK +0.33% Technology
XLP +0.53% Consumer Staples
XLU +0.38% Utilities
XLV +0.00% Health Care
XLY +0.67% Consumer Discretionary
———————————————
NYSE Advance/Decline 2719/1294.
NASDAQ Advance/Decline 1482/1026.
NYSE UP volume to DOWN volume was 3 to 1.
NASDAQ UP volume to DOWN volume was 3 to 2.
——————————————–
From the VRtrader.com website here is a link to World Market Indices:
http://www.vrtrader.com/vr_free/worldmarkets/index.asp
——————————————-
ECONOMIC CALENDAR:
(Courtesy of Don Vialoux):
Canadian July Housing Starts to be released at 8:30 AM EDT on Friday are expected to slip to 190,000 from 191,000 in June.
Canadian July Employment to be released at 8:30 AM EDT on Friday is expected to increase 6,000 versus a decline of 400 in June. The July Unemployment Rate is expected to remain unchanged from June at 7.1%.
Ed Note:This is a single comment isolated from a one of of the 4 Email Alerts Mark sends out every day for his VRPlatinum Newsletter Service. You can sign up for Mark’s Special Trial Offer
Here is the Special Trial Offer:
Use this month to kick our tires. Pay 50% for the first 30 days (No refund) and sample our Silver or Platinum service and then decide what works best for you. If you aren’t 100% ready to move forward, simply email us to cancel one week before your 30 day 50% off trial subscription ends and it will be canceled and you will not be charged ANY FURTHER, no questions asked. Just send an email to mark.vrtrader@gmail.com or call 928-282-1275 to cancel. You will receive an emailed confirmation of your cancellation at that time.


