
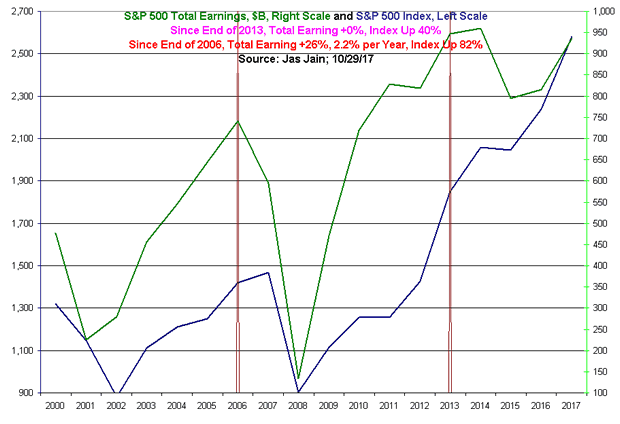
SP 500 Total Earnings Same as 2013 and Index Up 40% Since
Earnings per share for S&P 500 are up 6.6% since the end of 2013, all the gain is due to share buyback, while the total reported earnings are the same (see Fig. 1).

If the total earnings are the same as 3 years and 10 months ago without a recession we can say that we are operating in an essentially flat earnings environment. During the same period the index is up 40%. The only reason that earnings are up for the past 12 months is that earnings per share went down almost 20% since the end of 2014 to August 2016.
A much worse picture of market valuation emerges if we look at the Market Cap to GDP Ratio. Fig. 2 shows the ratio of total market cap of S&P 500 companies to the GDP. If we include all the public companies the ratio is between 140-150%. The only period when the market valuation was more extreme than today was during 1999-2000.

The sentiment with Bulls at 62.3 and Bears at 15.1 and VIX below 10 is at an all-time extreme in terms of bullishness. Fig. 3 shows the Complacency Index at a new high. All this doesn’t mean that the market will go down tomorrow or in a near future, but all it says is that risk has risen to a historically high level.

Larger Image


